ALT Properties Pane Settings
The ALT Properties Pane includes information and settings about your ALT Data Points Table or your ALT Plot. When the ALT Data Points Table is displayed, the following sections appear:
- Data Set Properties
- Calculation Parameters
- Results
When the ALT Plot is displayed, the following sections appear:
- Calculation Parameters
- Plot Properties
- Results
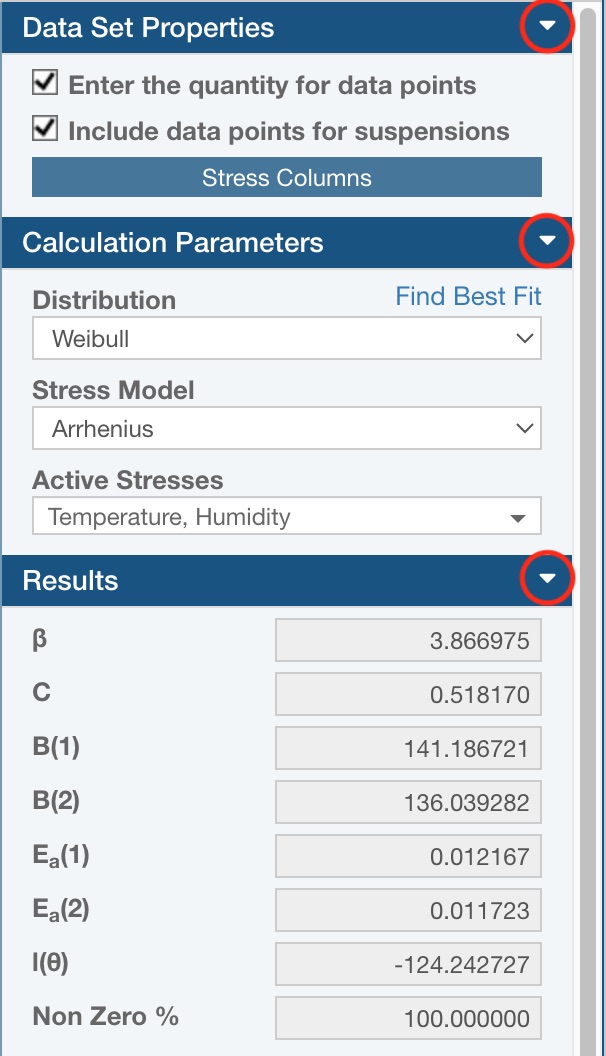
Each section can be expanded and collapsed using the expand/collapse arrow icon in the right corner of the section header.
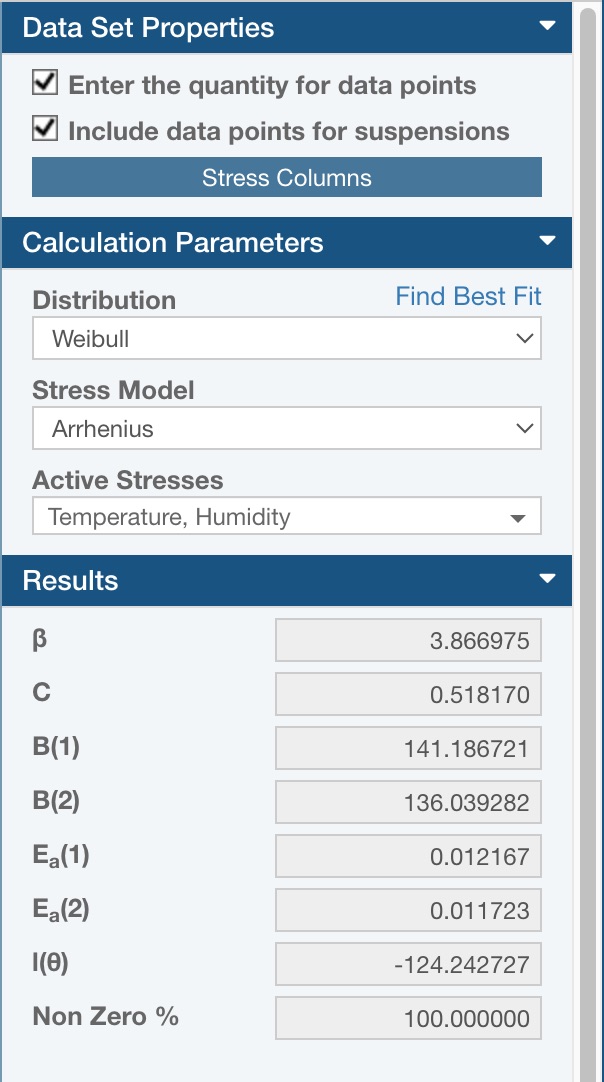
Data Set Properties (shown when the Data Points Table is displayed)
The Data Set Properties section allows you to configure the Data Points Table to match the data format you are using for your ALT analysis.
By default, the Data Points Table is set to the simplest form of ALT data: a set of failure times and stress values. To change this data format to match your ALT data, set the appropriate selections in the Data Set Properties section.
By default, it is assumed that each data point represents a single failure. If you want to enter a quantity with your data points, select the Enter the quantity for data points checkbox. The Quantity column will appear in the Data Points Table.
By default, each data point is assumed to be a failure. If you would like to also include suspension data, select the Include data points for suspensions checkbox. When selected, the Failure and Suspension columns will appear in the Data Points Table, and you must indicate if the data point represents a failure or a suspension. By default, data points will be set to failure.
By default, only one stress column is included in the Data Points Table. If you would like to add additional stress columns, click the Stress Columns button.
The Stress Columns dialog appears.

Select the Add stress column (n) checkbox to add an additional column and then enter the Name for this stress along with the Use Stress value that will be used for the ALT analysis. Specify Transformation, if needed.
The Transformation field allows you to define the model used to transform the stress data. It is used only when the Stress Model is set to General Log-Linear (Complex). Choices are: No Transformation, Logarithmic, and Reciprocal. For more details, see Stress Models Supported in Relyence ALT.
Click Close to save your Stress Columns configuration.
Calculation Parameters
The Calculation Parameters allow you to select the settings you wish to use for the ALT calculations.
First, select the desired distribution from the Distribution dropdown list. Available distributions include Exponential, Lognormal, Rayleigh, and Weibull. Relyence will use Weibull by default. If you want to perform a best fit analysis in order to determine the distribution the best fits your data, click the Find Best Fit link. For more information about best fit analysis, see the ALT Best Fit Analysis topic.
Second, select the Stress Model from the list of choices: Arrhenius, Eyring, General Eyring, General Log-Linear (Complex), General Log-Linear (No Transformation), General Log-Linear (Logarithmic), General Log-Linear (Reciprocal), Inverse Power Law, Temperature Humidity, or Temperature Nonthermal. The Relyence default setting is Arrhenius. For more details, see Stress Models Supported in Relyence ALT.
Third, select the Active Stresses from the list of choices. The available choices are based on your settings in the Stress Columns dialog.
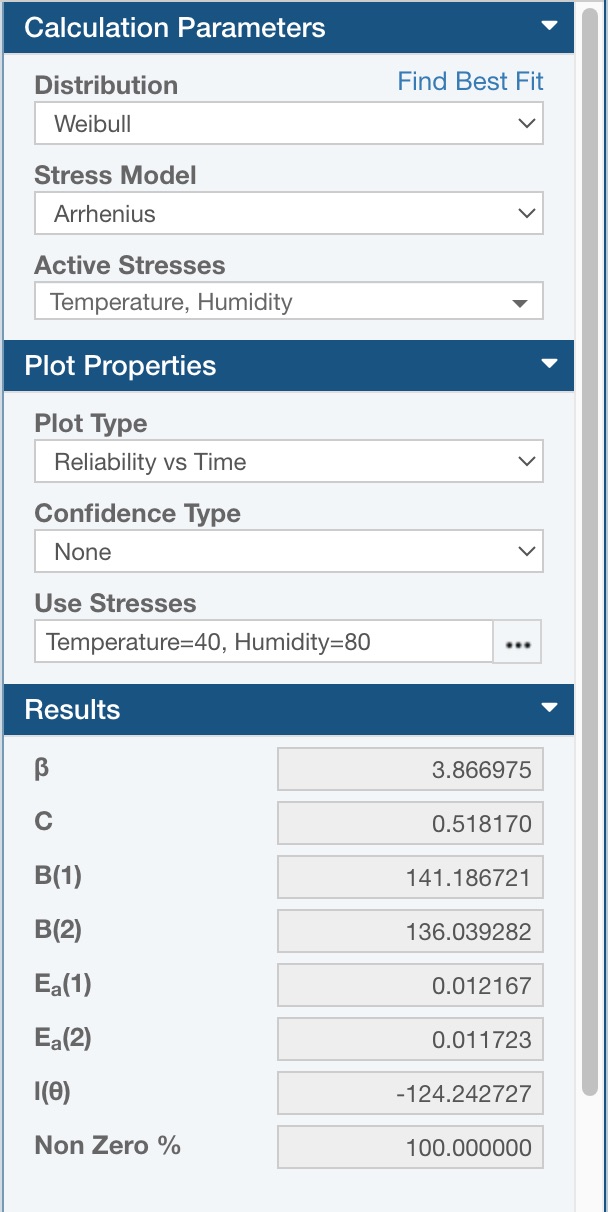
Plot Properties (shown when the ALT Plot is displayed)
The Plot Properties allow you to select the settings you wish to use for your ALT Plots.
First, select the desired type from the Plot Type dropdown list. Available Plot Types are Acceleration Factor vs Stress, Failure Rate vs Time, PDF Plot (Probability Density Function), Probability, Reliability vs Time, Standard Deviation vs Stress, or Unreliability vs Time. Relyence will use Reliability vs Time by default.
Second, the Confidence Type enables you to add confidence bound lines to your ALT Plots. You can select from None, Lower Confidence, Upper Confidence, Double Confidence, or Upper and Lower Confidence. The Relyence default setting is None.
Third, select the Confidence Level percentage you want to use when calculating the confidence bounds. You can enter a value from 1 - 100. The Relyence default setting is 90.
Fourth, if you are adding confidence bounds, select the Confidence Bound Type to use for computation. Choose from either Time or Reliability. The Relyence default setting is Time.
Lastly, specify the Use Stresses to use for analysis. By default, Relyence will use the Use Stress set in Stress Columns dialog your Data Set.
Results
The Results section is for informational purposes only. The data in this section is not editable. The Results pane displays the distribution parameters from the most recent ALT calculation.
Additionally, the Non Zero % field is also displayed in the Results section. This field reports the percentage of data points that are not zero.