Calculating Competing Failure Modes
The option to Calculate Competing Failure Modes for any Life Data Set is useful since real-world products rarely have a single mode of failure. If the failure data for an item, including failure by multiple failure modes, is combined into a single data set, the most critical mechanism of failure can be overlooked.
Competing Failure Mode analysis allows you to record all failure data in a single Life Data set, but also separate failures by mode or mechanism and model each with its own statistical distribution, and thus see critical details for the different failure modes or mechanisms.
Competing Failure Modes analysis in Relyence Weibull allows you to consider up to five distinct Failure Modes.
Distribution-specific results are determined for each failure mode as well as Total, or overall, results. Since for Competing Failure Modes analysis, you can think of a reliability model for a series system, where the blocks in series are represented by the failure modes, the Total results are the result of that series analysis.
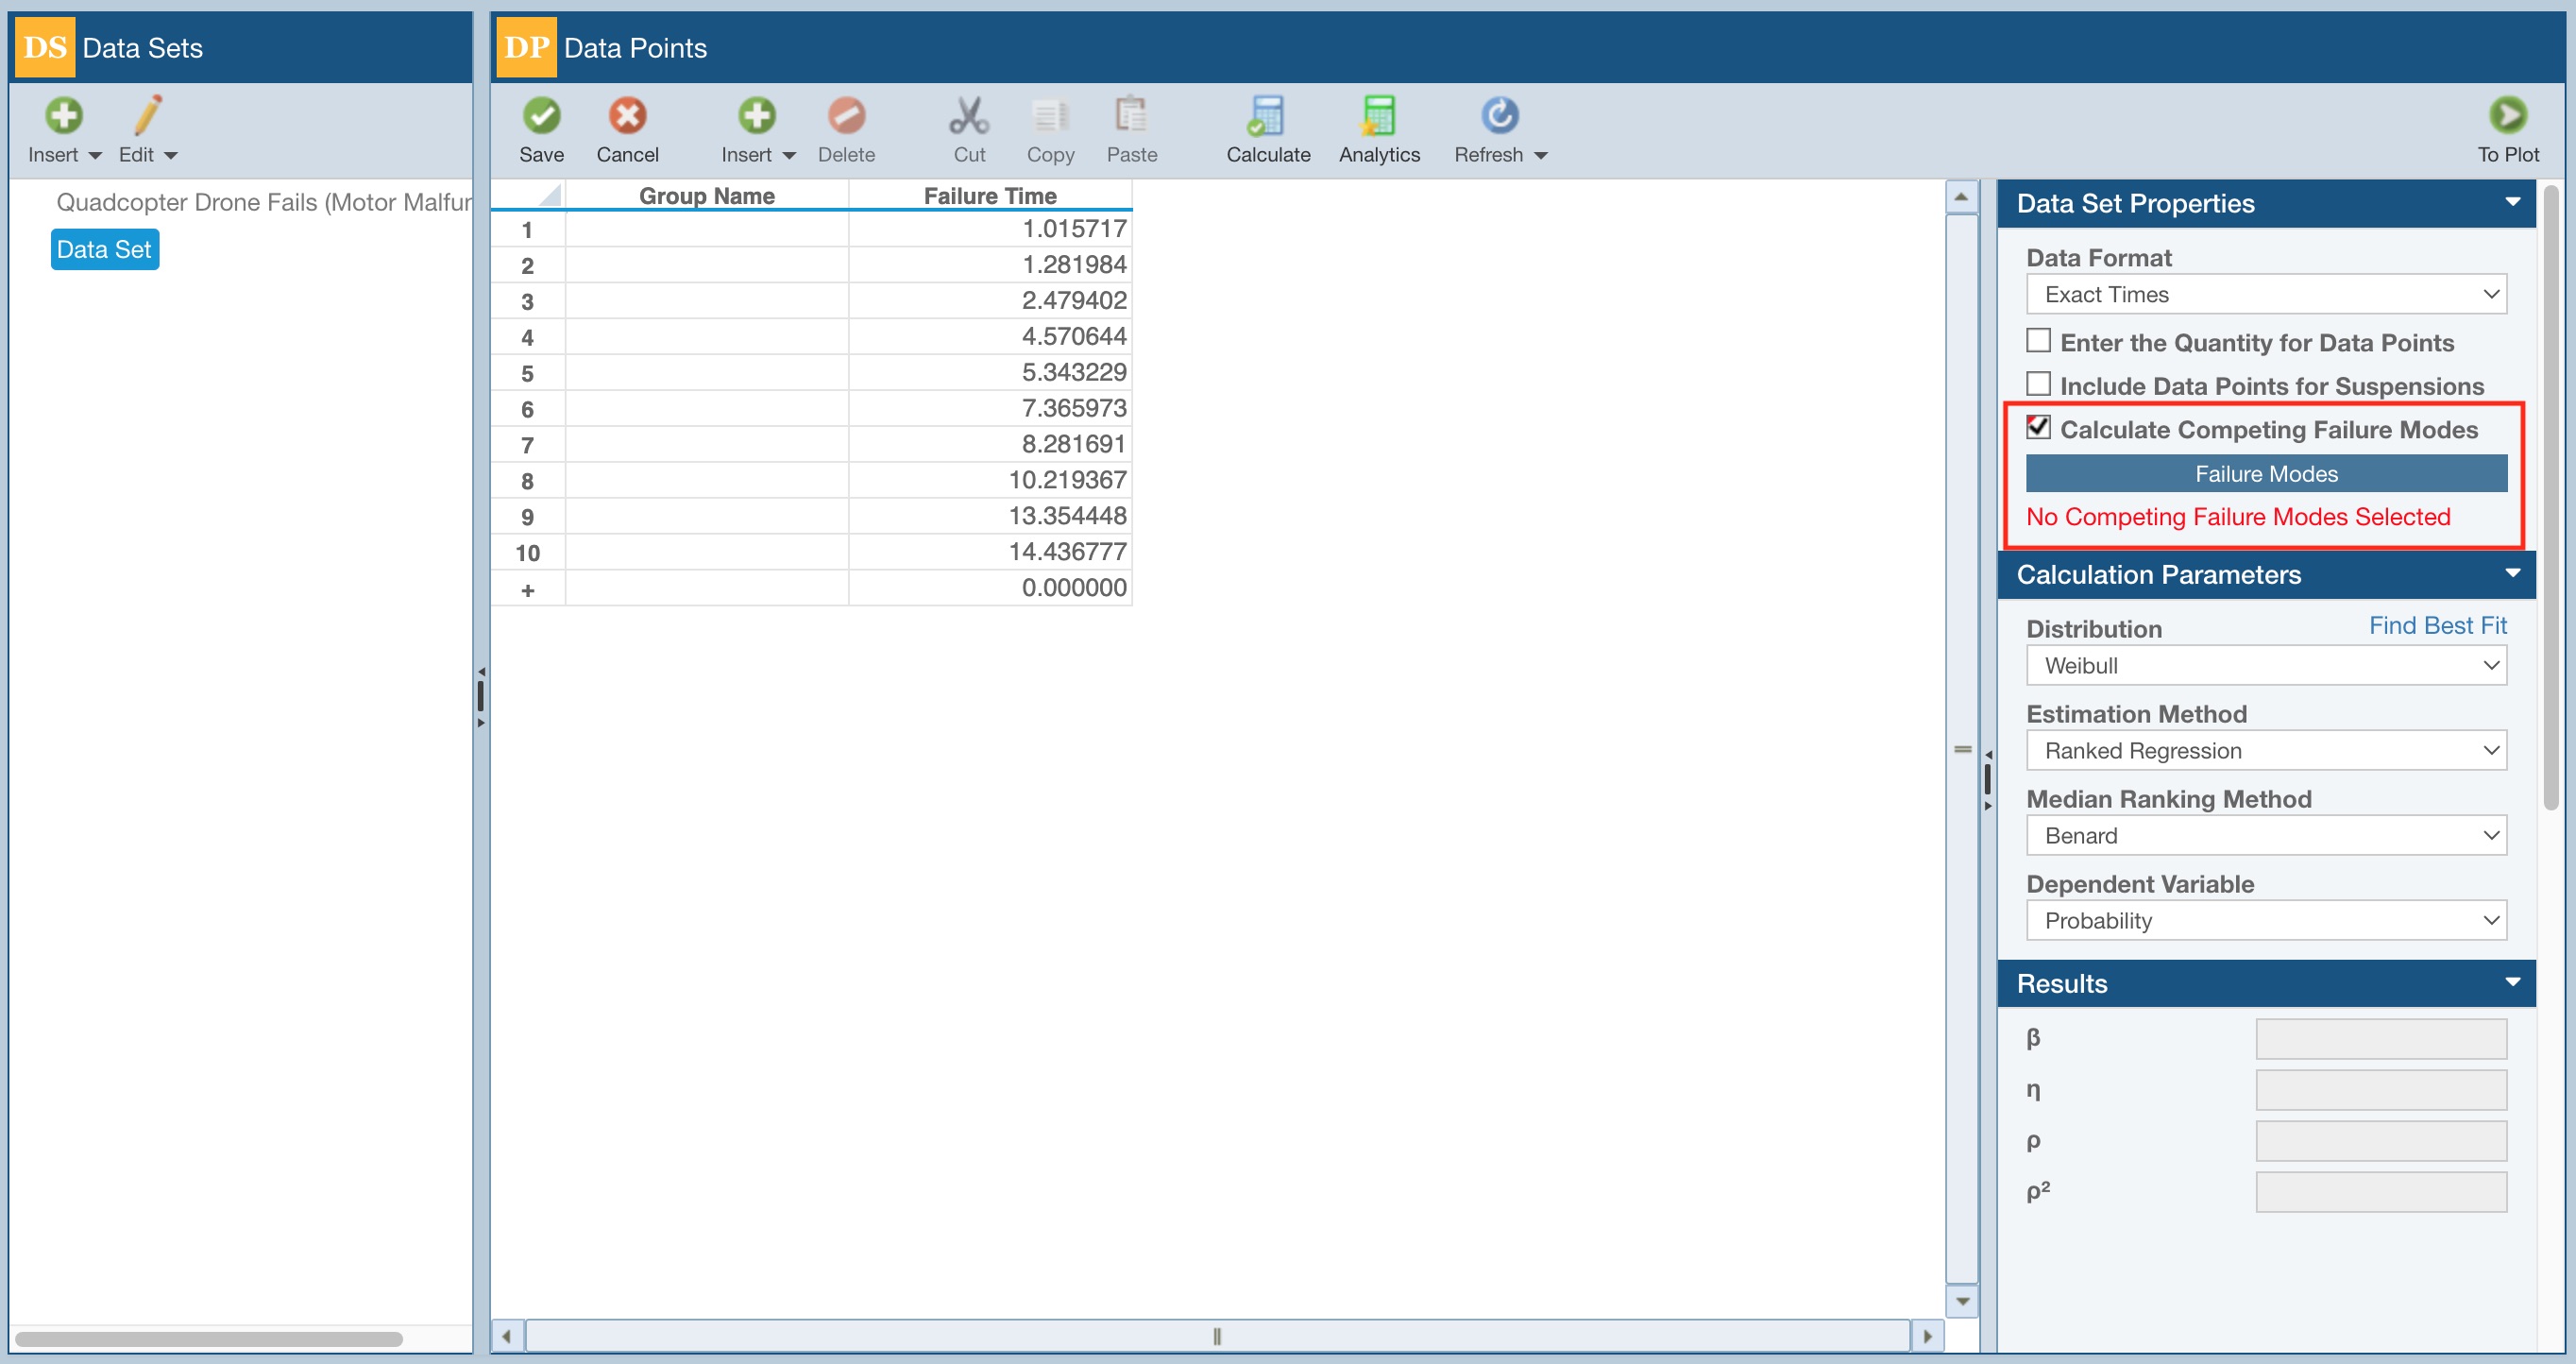
You begin Life Data analysis including competing failure modes analysis by creating a Life Data Set (Entering Life Data Sets).
Enter the Life Data in the Data Points table (the sample data below was entered using Tools>Generate Data Points from the Sidebar) and in the Data Set Properties, select Calculate Competing Failure Modes.
Once Calculate Competing Failure Modes is checked on, you can assign a Group Name to each data point.
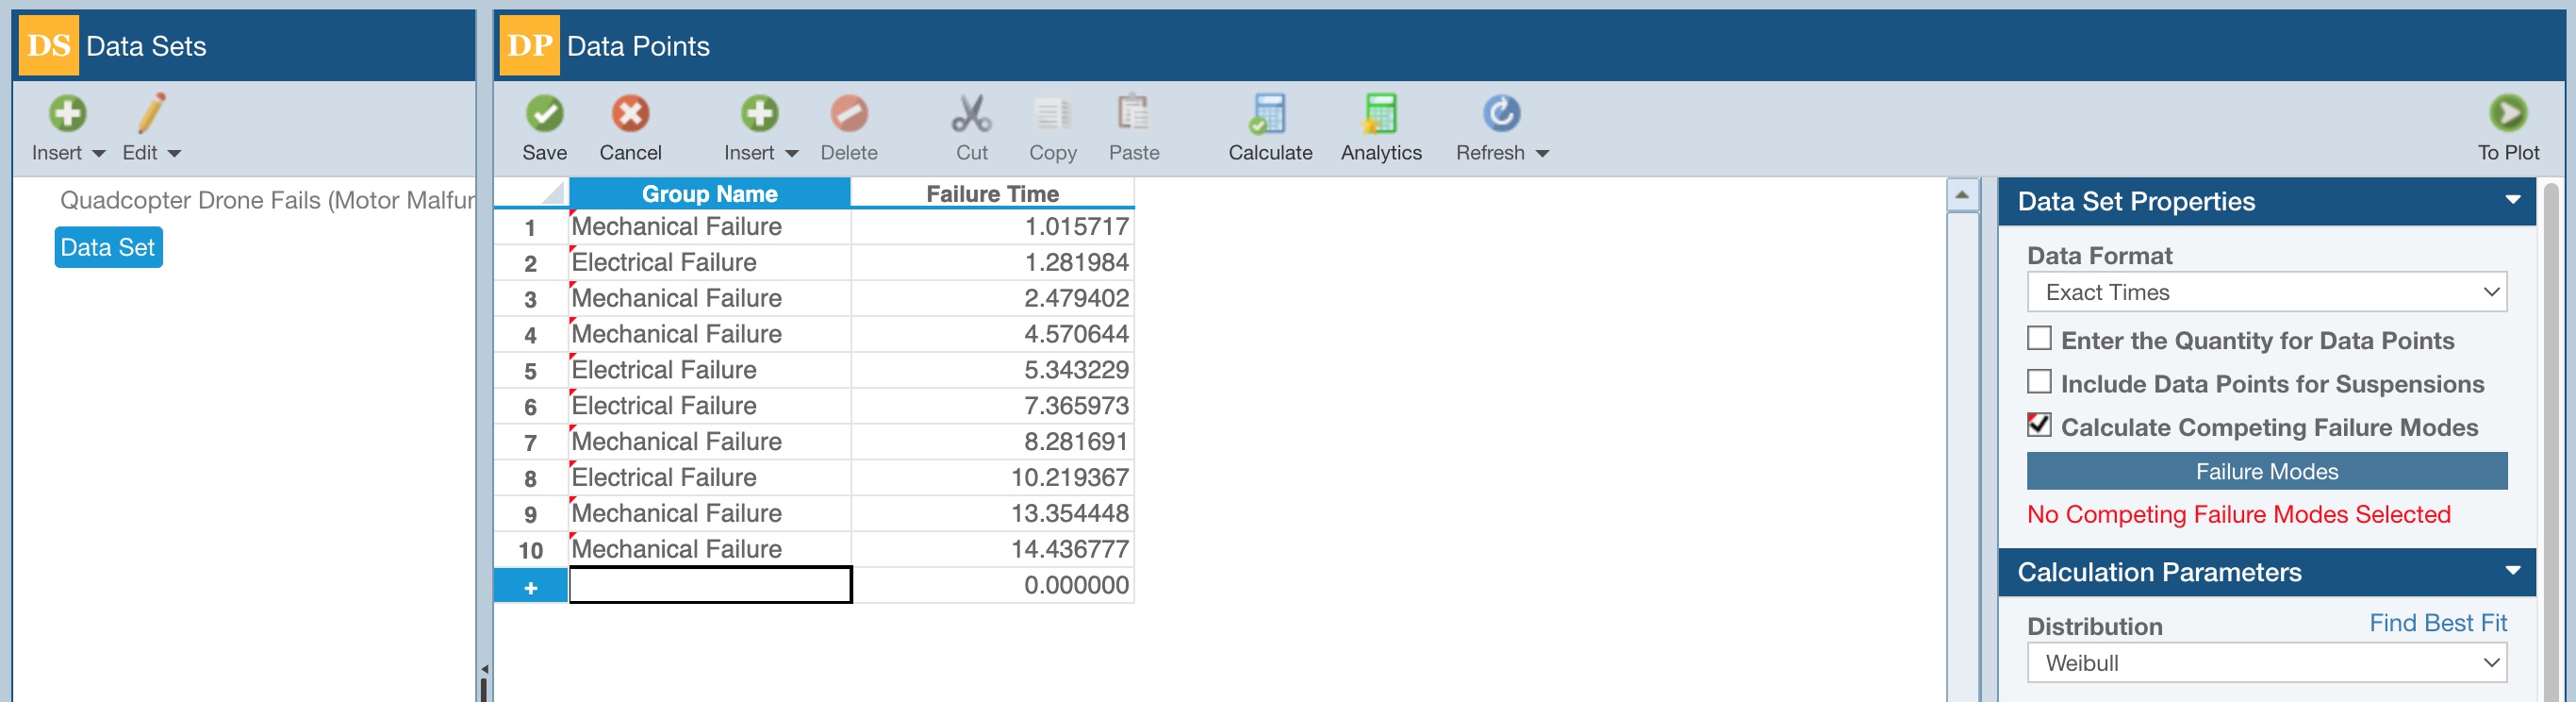
Group Names are used to identify which Failure Times are associated with which Failure Mode.
In some cases, each Failure Mode will have only one associated Group Name, like in the example above.
In other instances, multiple Group Names will be associated to the same Failure Mode.
This is more likely to happen in a case where you have multiple sets of data for identical components in a system.
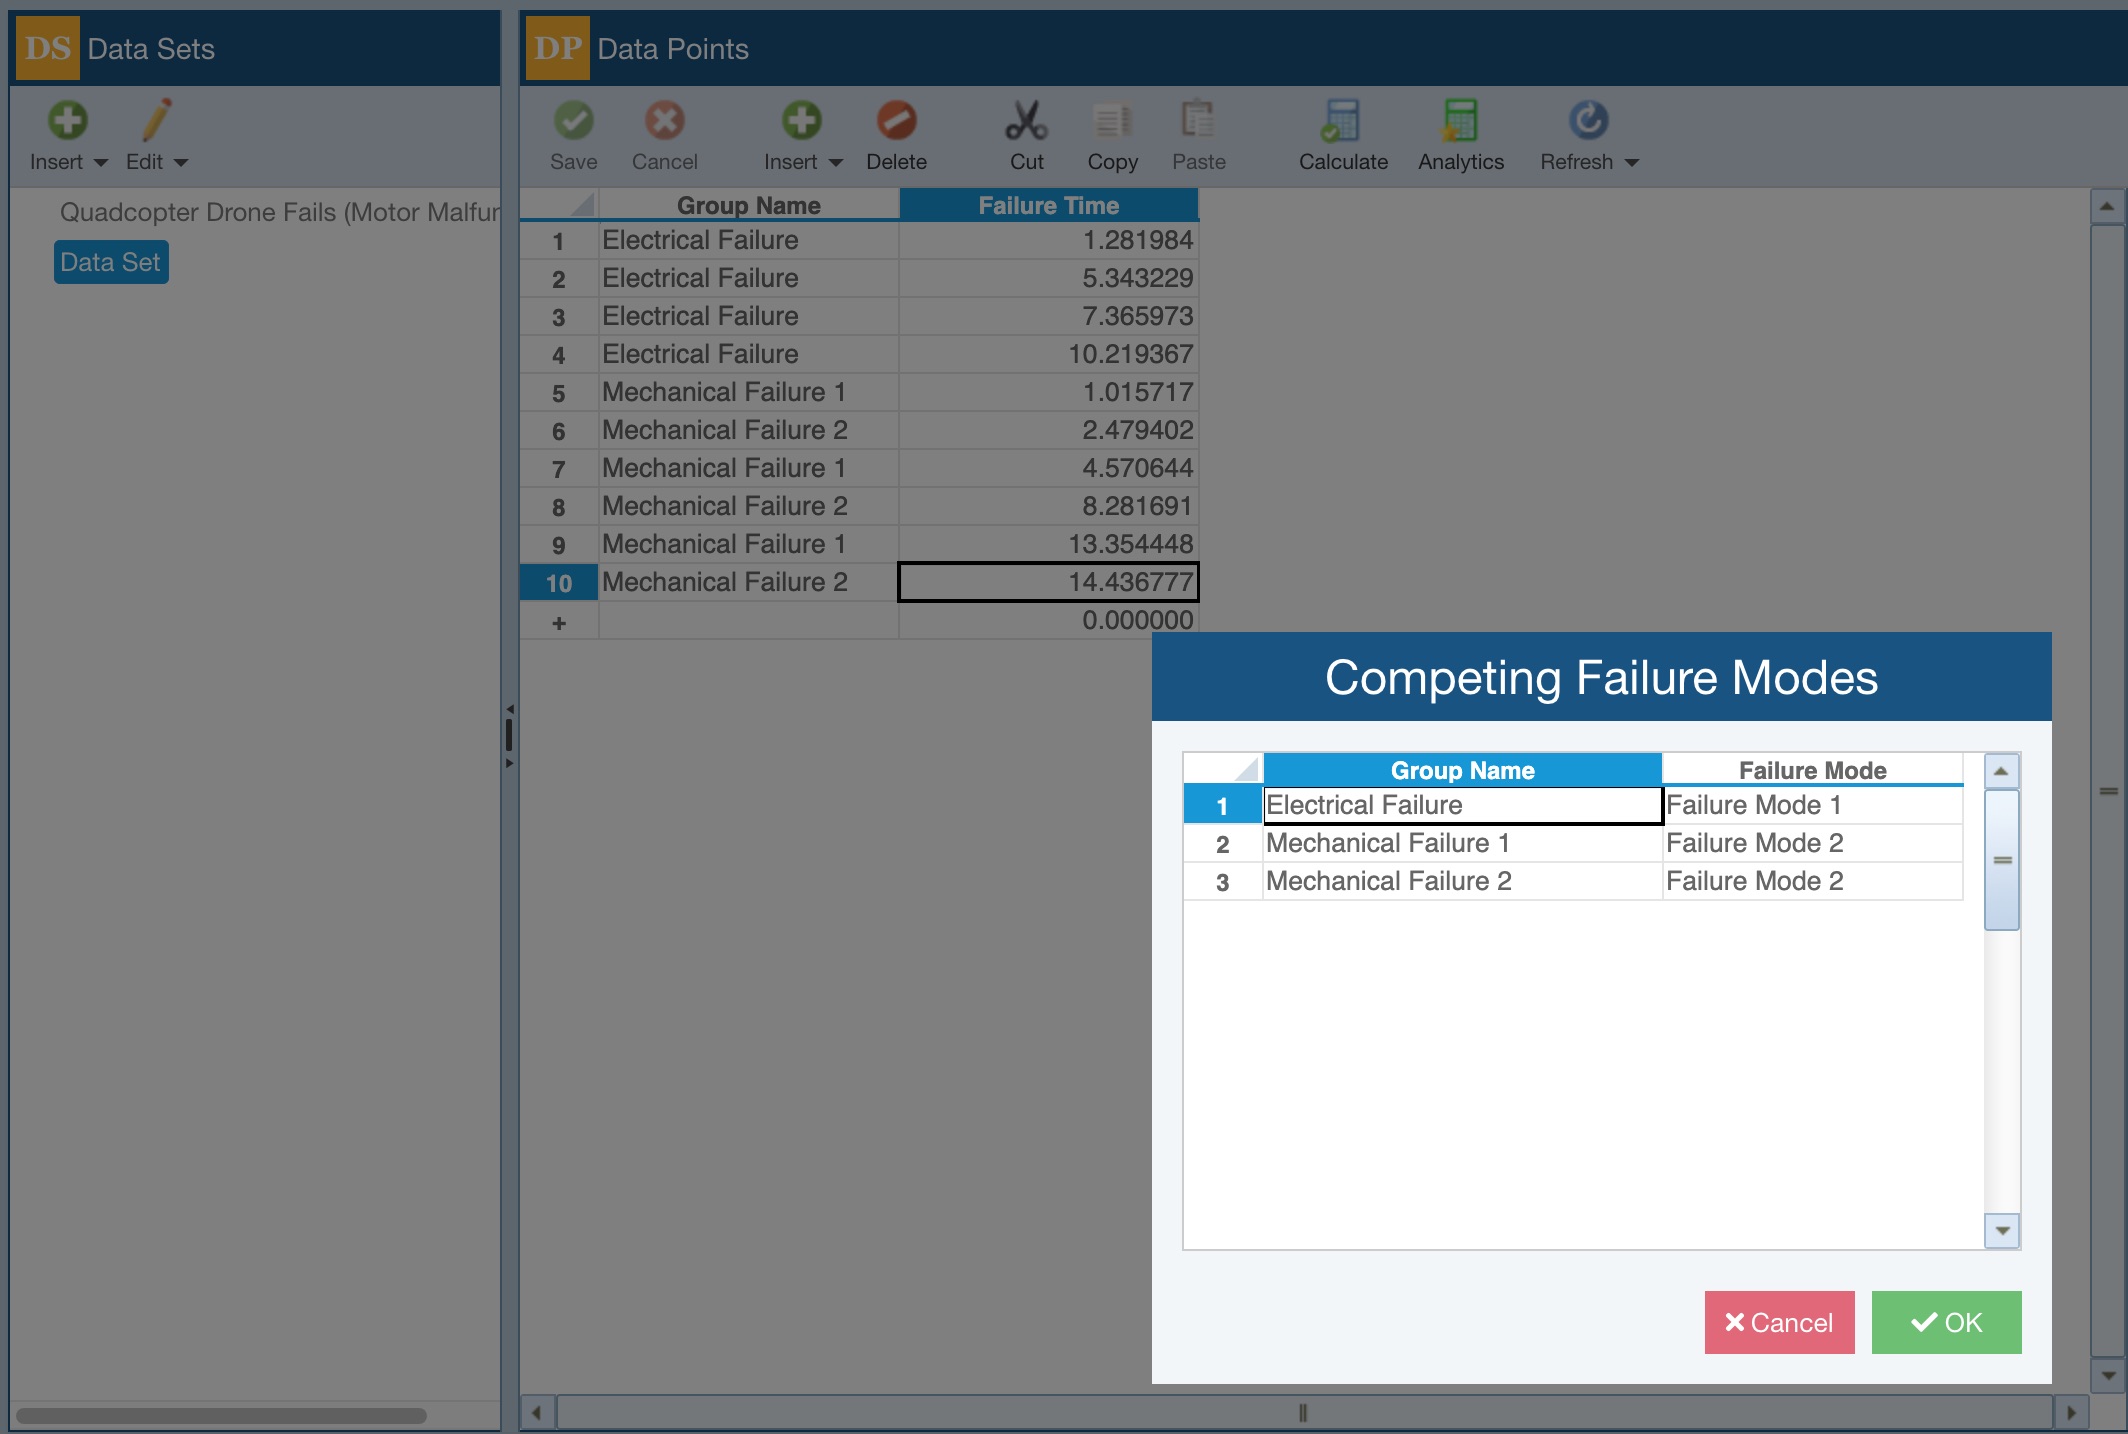
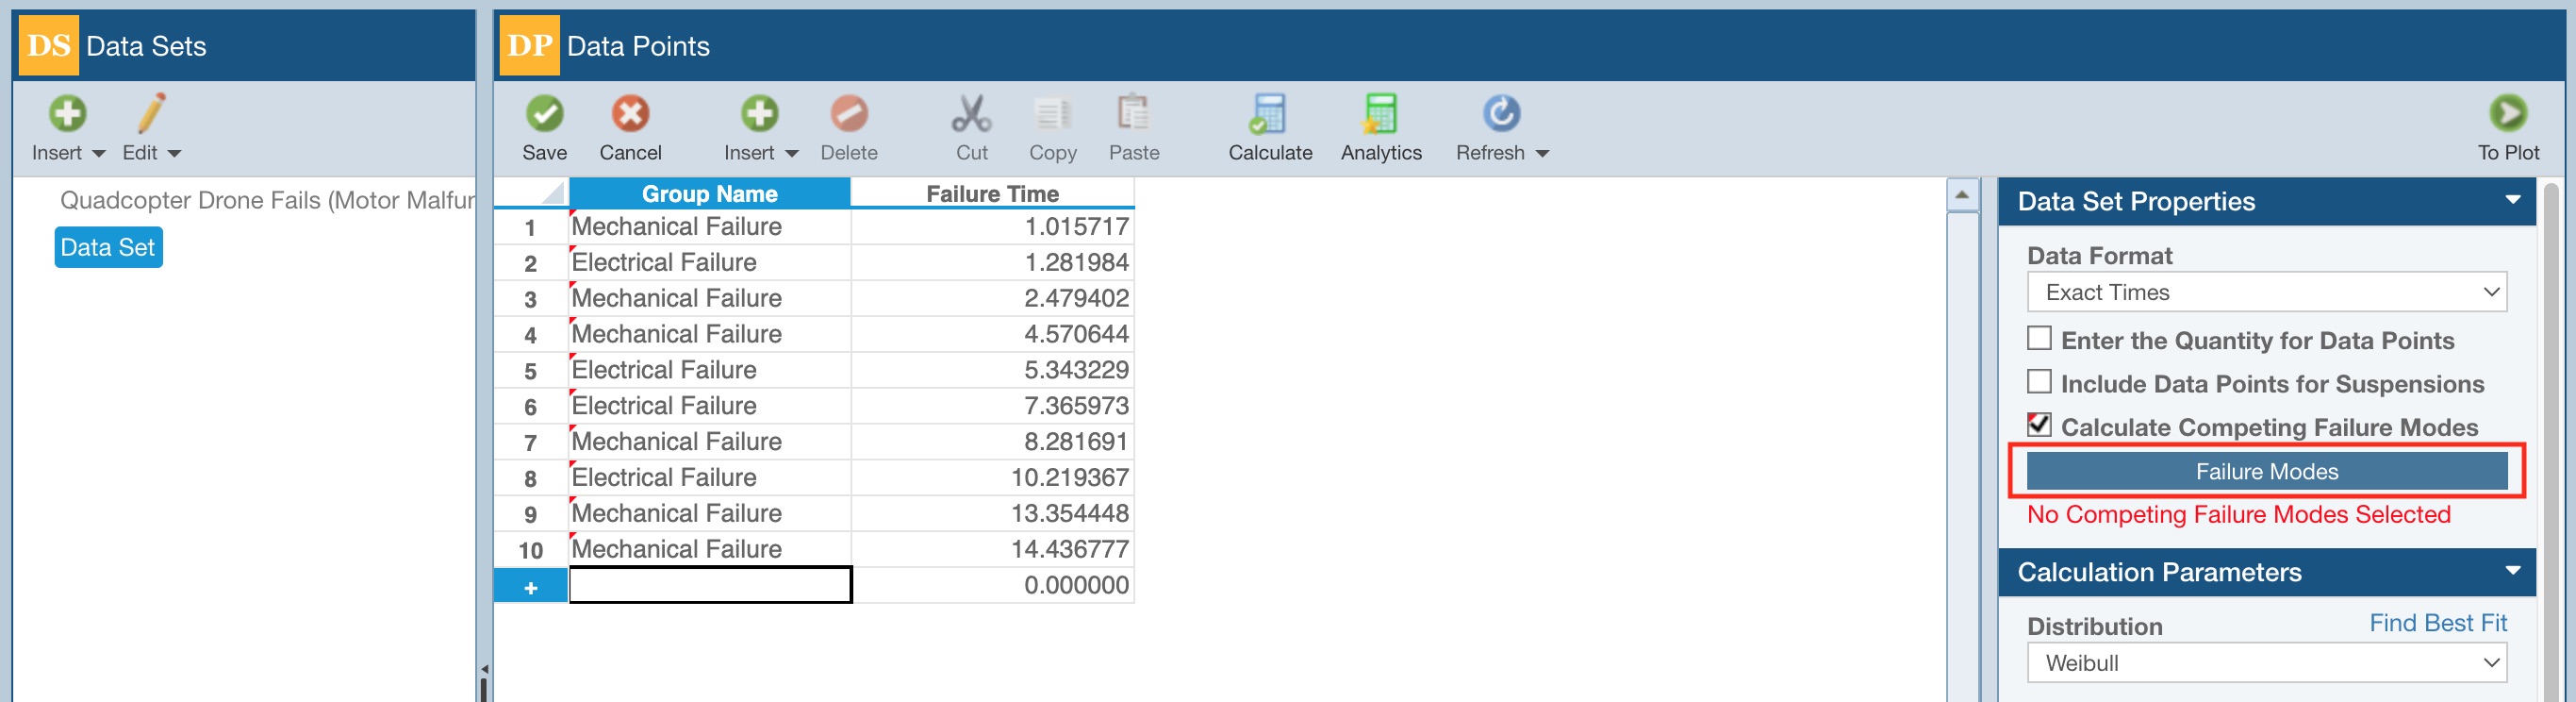
Once Group Names are assigned, you can associate each Group to a Failure Mode by clicking Failure Modes in the Data Sets pane.
The Competing Failure Modes dialog appears.
Associate each Group Name to a Failure Mode.
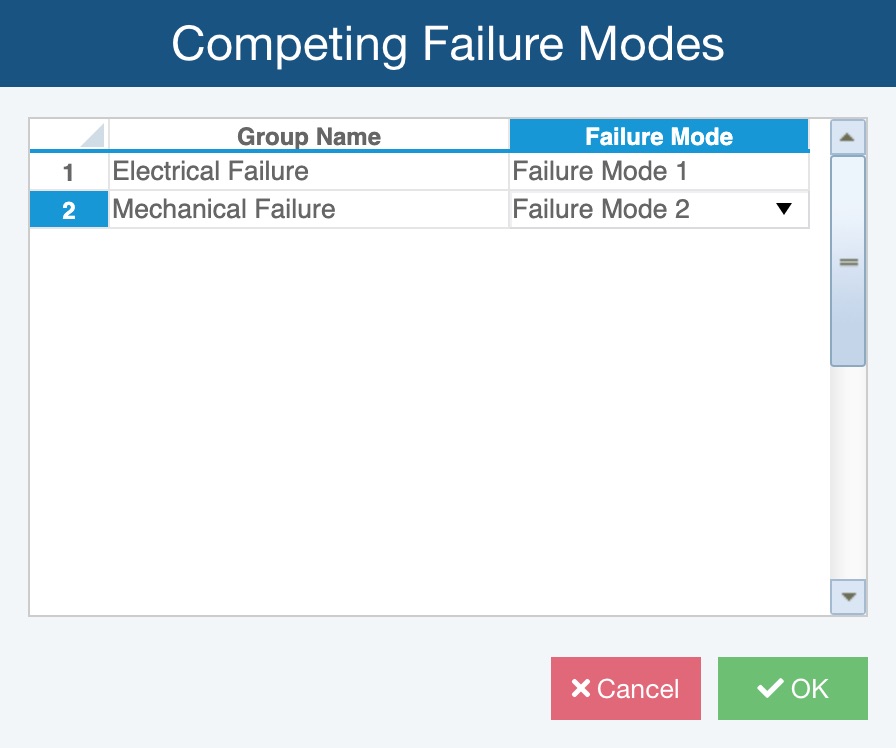
If No Failure Mode is set for a Group Name, those data points will be considered Suspensions in the Competing Failure Mode analysis.
Click OK.
Next, click Calculate to calculate the Data Set, including Competing Failure Modes analysis, and note how the results are included for each Failure Mode.

Click To Plot to see the desired graphical outputs, including each Failure Mode and the Total (overall) results.
