Customizing Failure Direct Connect
By default, the Failure Data widget needed to utilize the Relyence Failure Direct Connect feature is not placed on the Relyence supplied FRACAS templates. To use Relyence Failure Direct Connect, which requires both Relyence FMEA and Relyence FRACAS to be licensed, you will first need to customize your FRACAS Forms and/or Tables to include the special Failure Data widget.
Note: You can change the default terms "Incidents" and "Problems" used in Relyence FRACAS. Therefore, you may see your or your organization's preferred terms instead of "Incidents" and "Problems" in the software. For ease of understanding, the default terms of Incidents and Problems will be used throughout this documentation. For details on customizing these terms see the Relyence FRACAS Settings topic.
It is important to note that FRACAS processes are typically very unique to each organization. Relyence FRACAS is completely customizable for your use, and this tutorial is meant to show an example setup. This tutorial will not cover how to customize the Relyence FRACAS interface to meet your needs. To find information on customizing Relyence FRACAS, please review Customizing the FRACAS Interface. Also, our implementation team can help you in customizing the Relyence FRACAS interface to meet your needs. We can also aid in defining your process, or establishing a new FRACAS. Feel free to contact us for details.
To begin the customizable process, make sure Relyence FRACAS is active by clicking FRACAS and Incidents in the Sidebar.
You can add the Failure Data widget to your FRACAS Incident Forms or Incident Table or both.
Adding the Failure Data widget to the Incident Table
From the FRACAS Incident Table, click Views>Customize view from the toolbar.
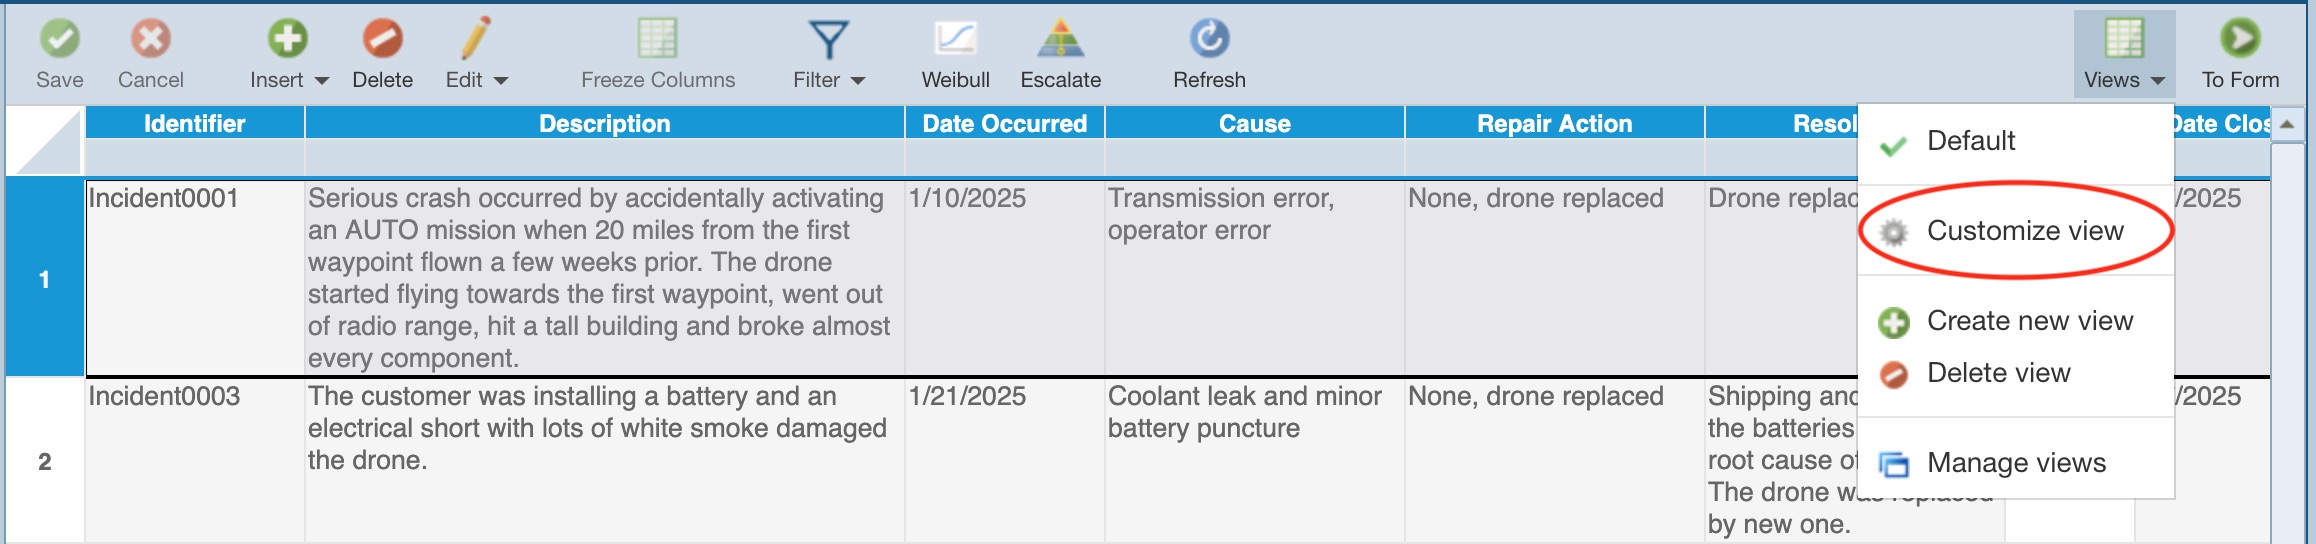
You can decide if you want to change the currently active View or create a new one. For more details about Customizing FRACAS Views, see the Customizing the FRACAS Interface topic. Click Change This View.
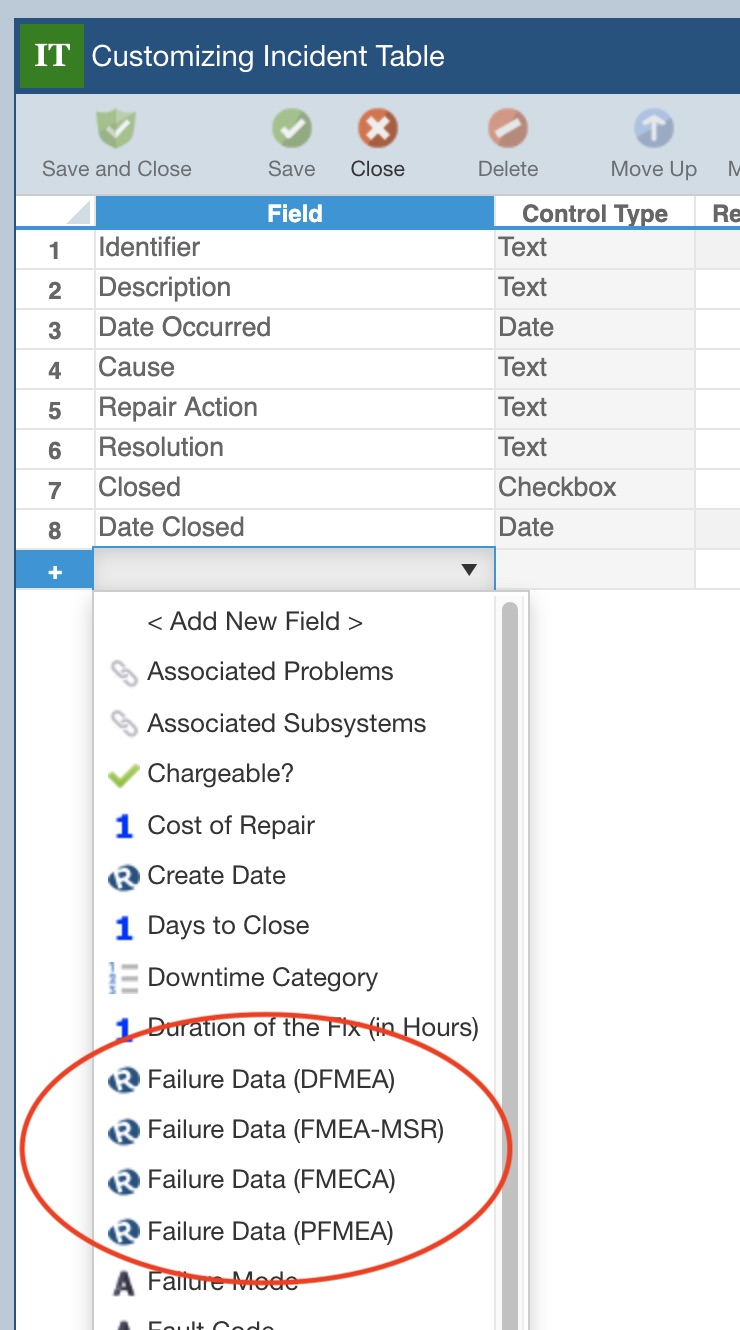
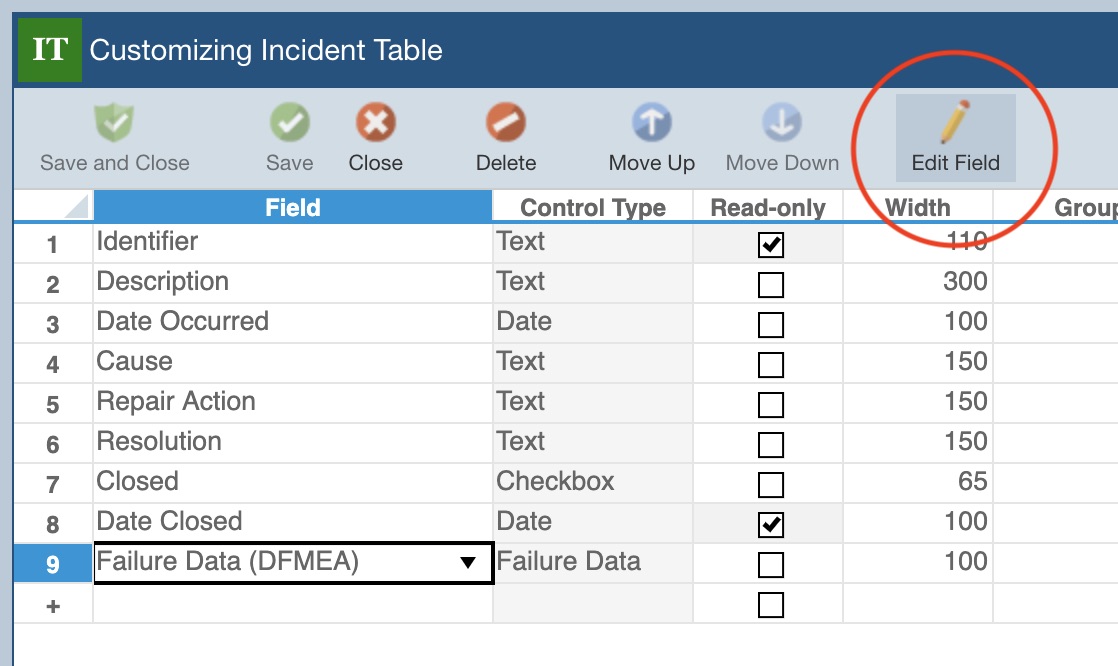
The Customizing Incident Table window appears.
Click in the last row of the Table, click the dropdown arrow in the Field column, and select the Failure Data widget you want to use, and then press Tab to add it. Note that you can add the Failure Data widget for any or all FMEA types you use, such as DFMEA, FMECA, etc.
To keep the changes, click Save and Close. Otherwise, click Close.
You can customize the Failure Data widget, see the Customizing the Failure Data widget section of this topic for details.
Adding the Failure Data widget to an Incident Form
Click the To Form button in the toolbar from the FRACAS Incident Table.
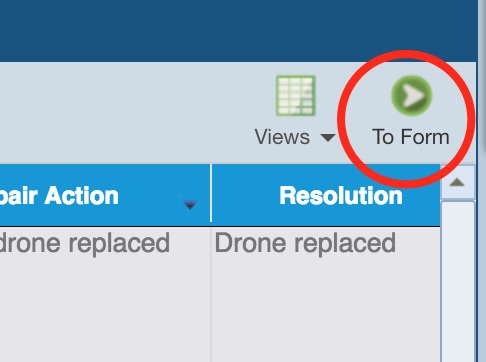
The Incident Form appears. Click the Customize button in the upper right of the toolbar.
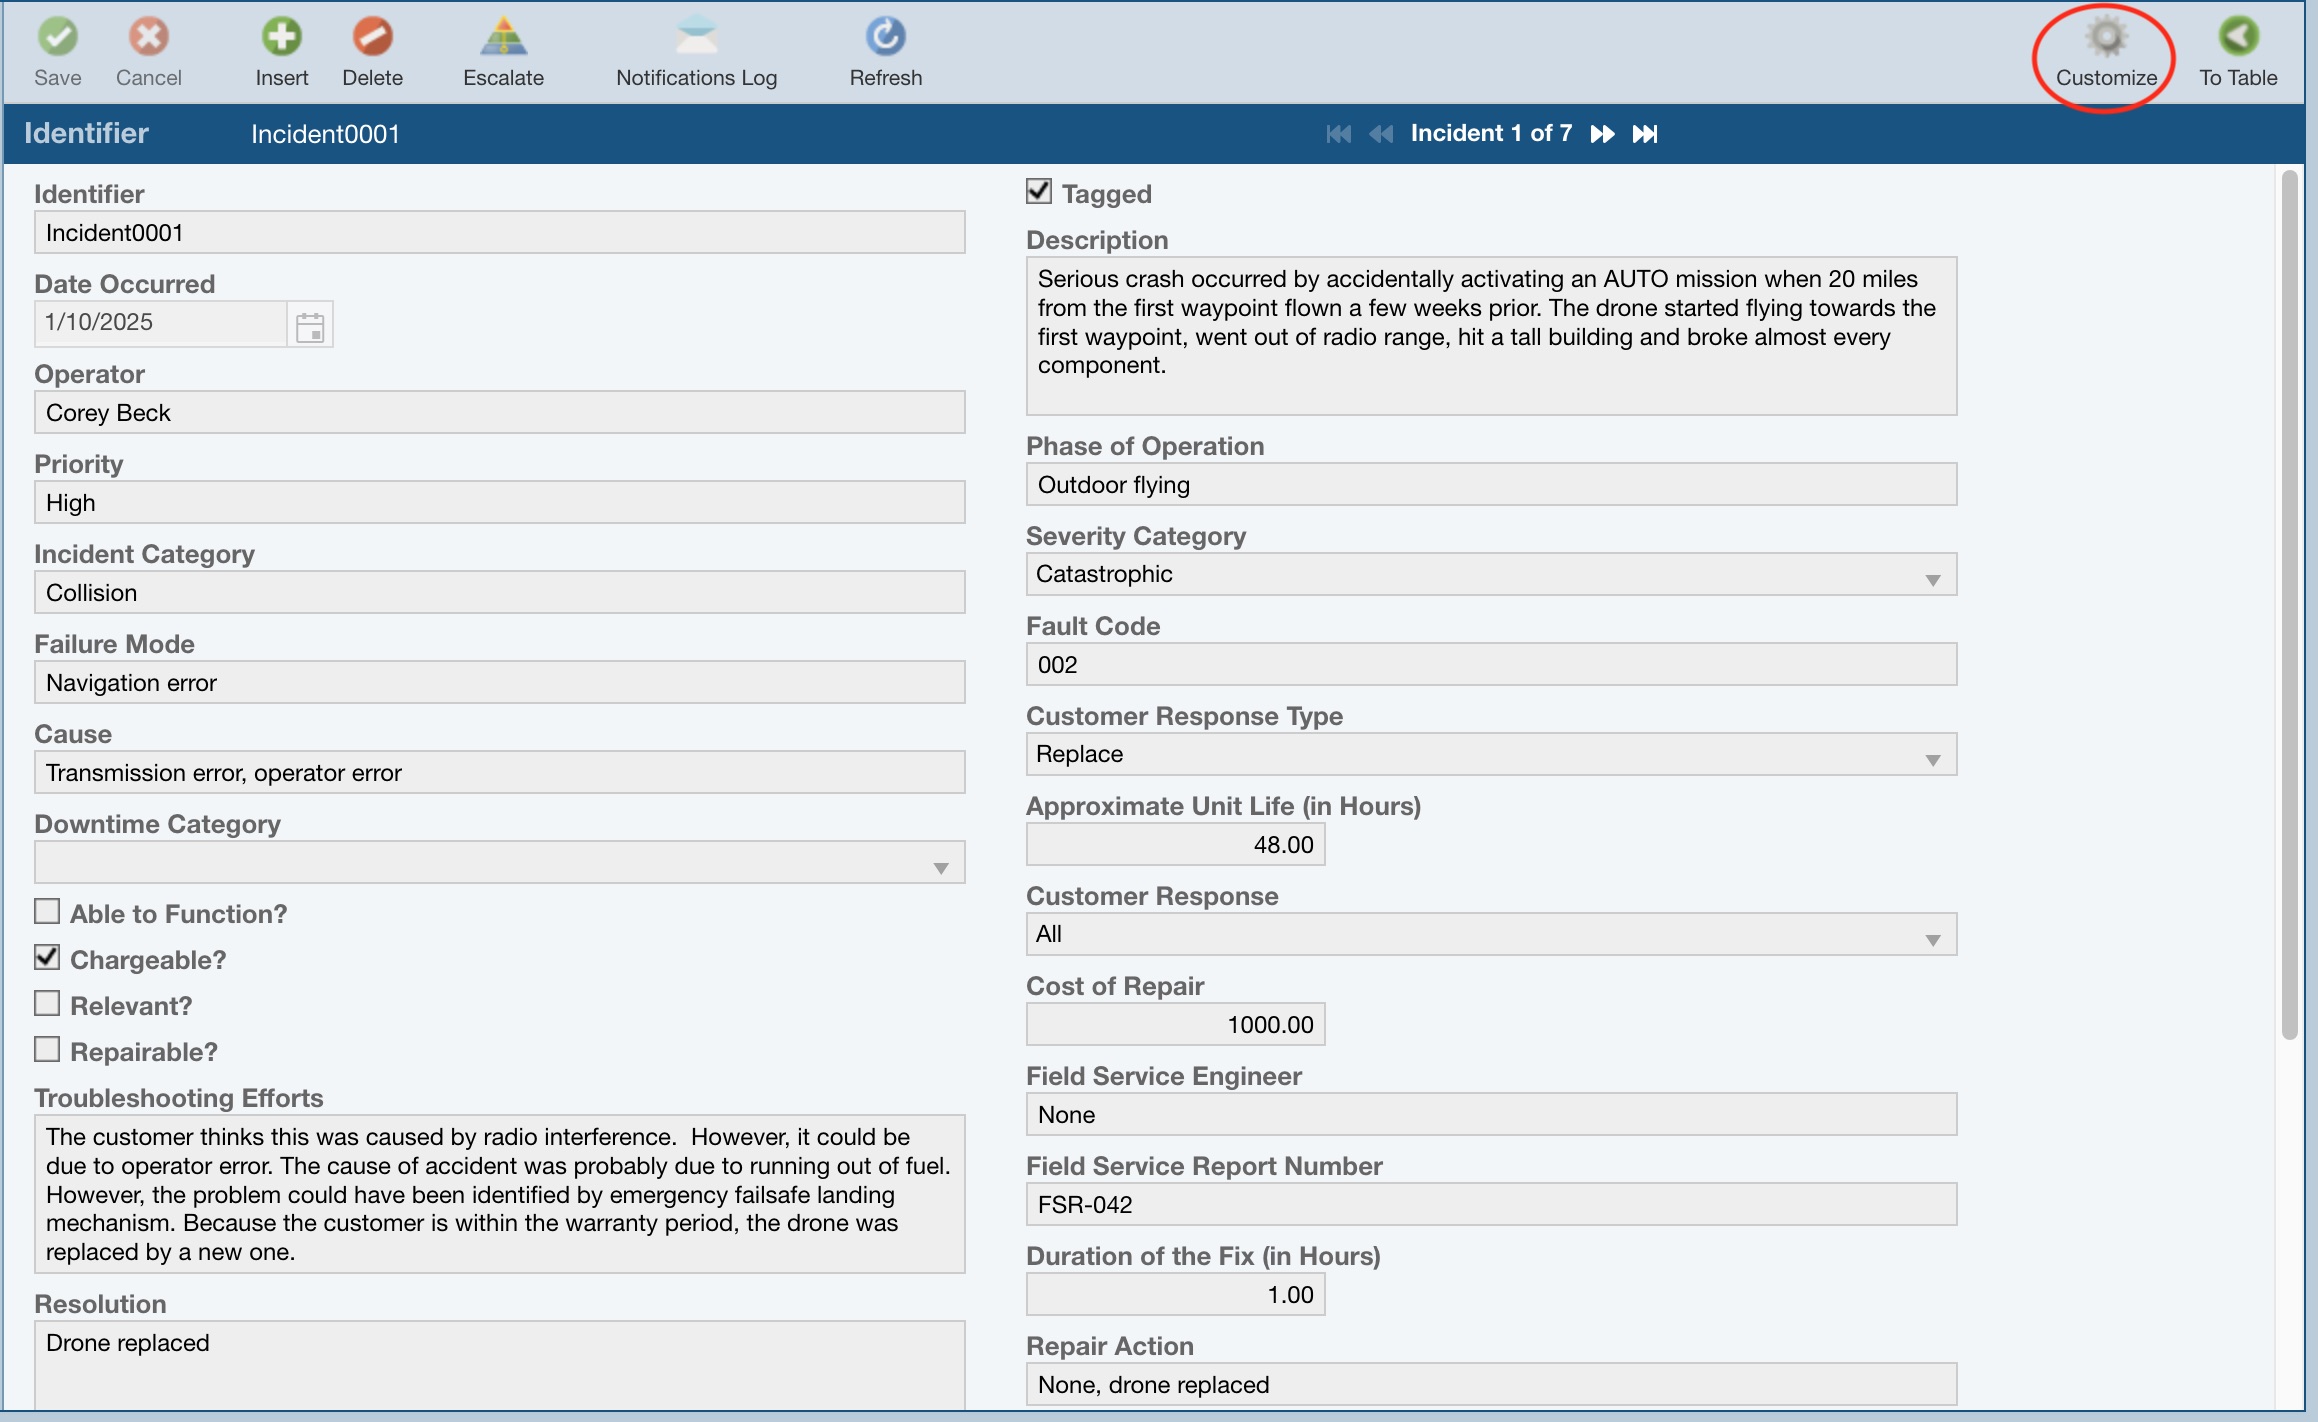
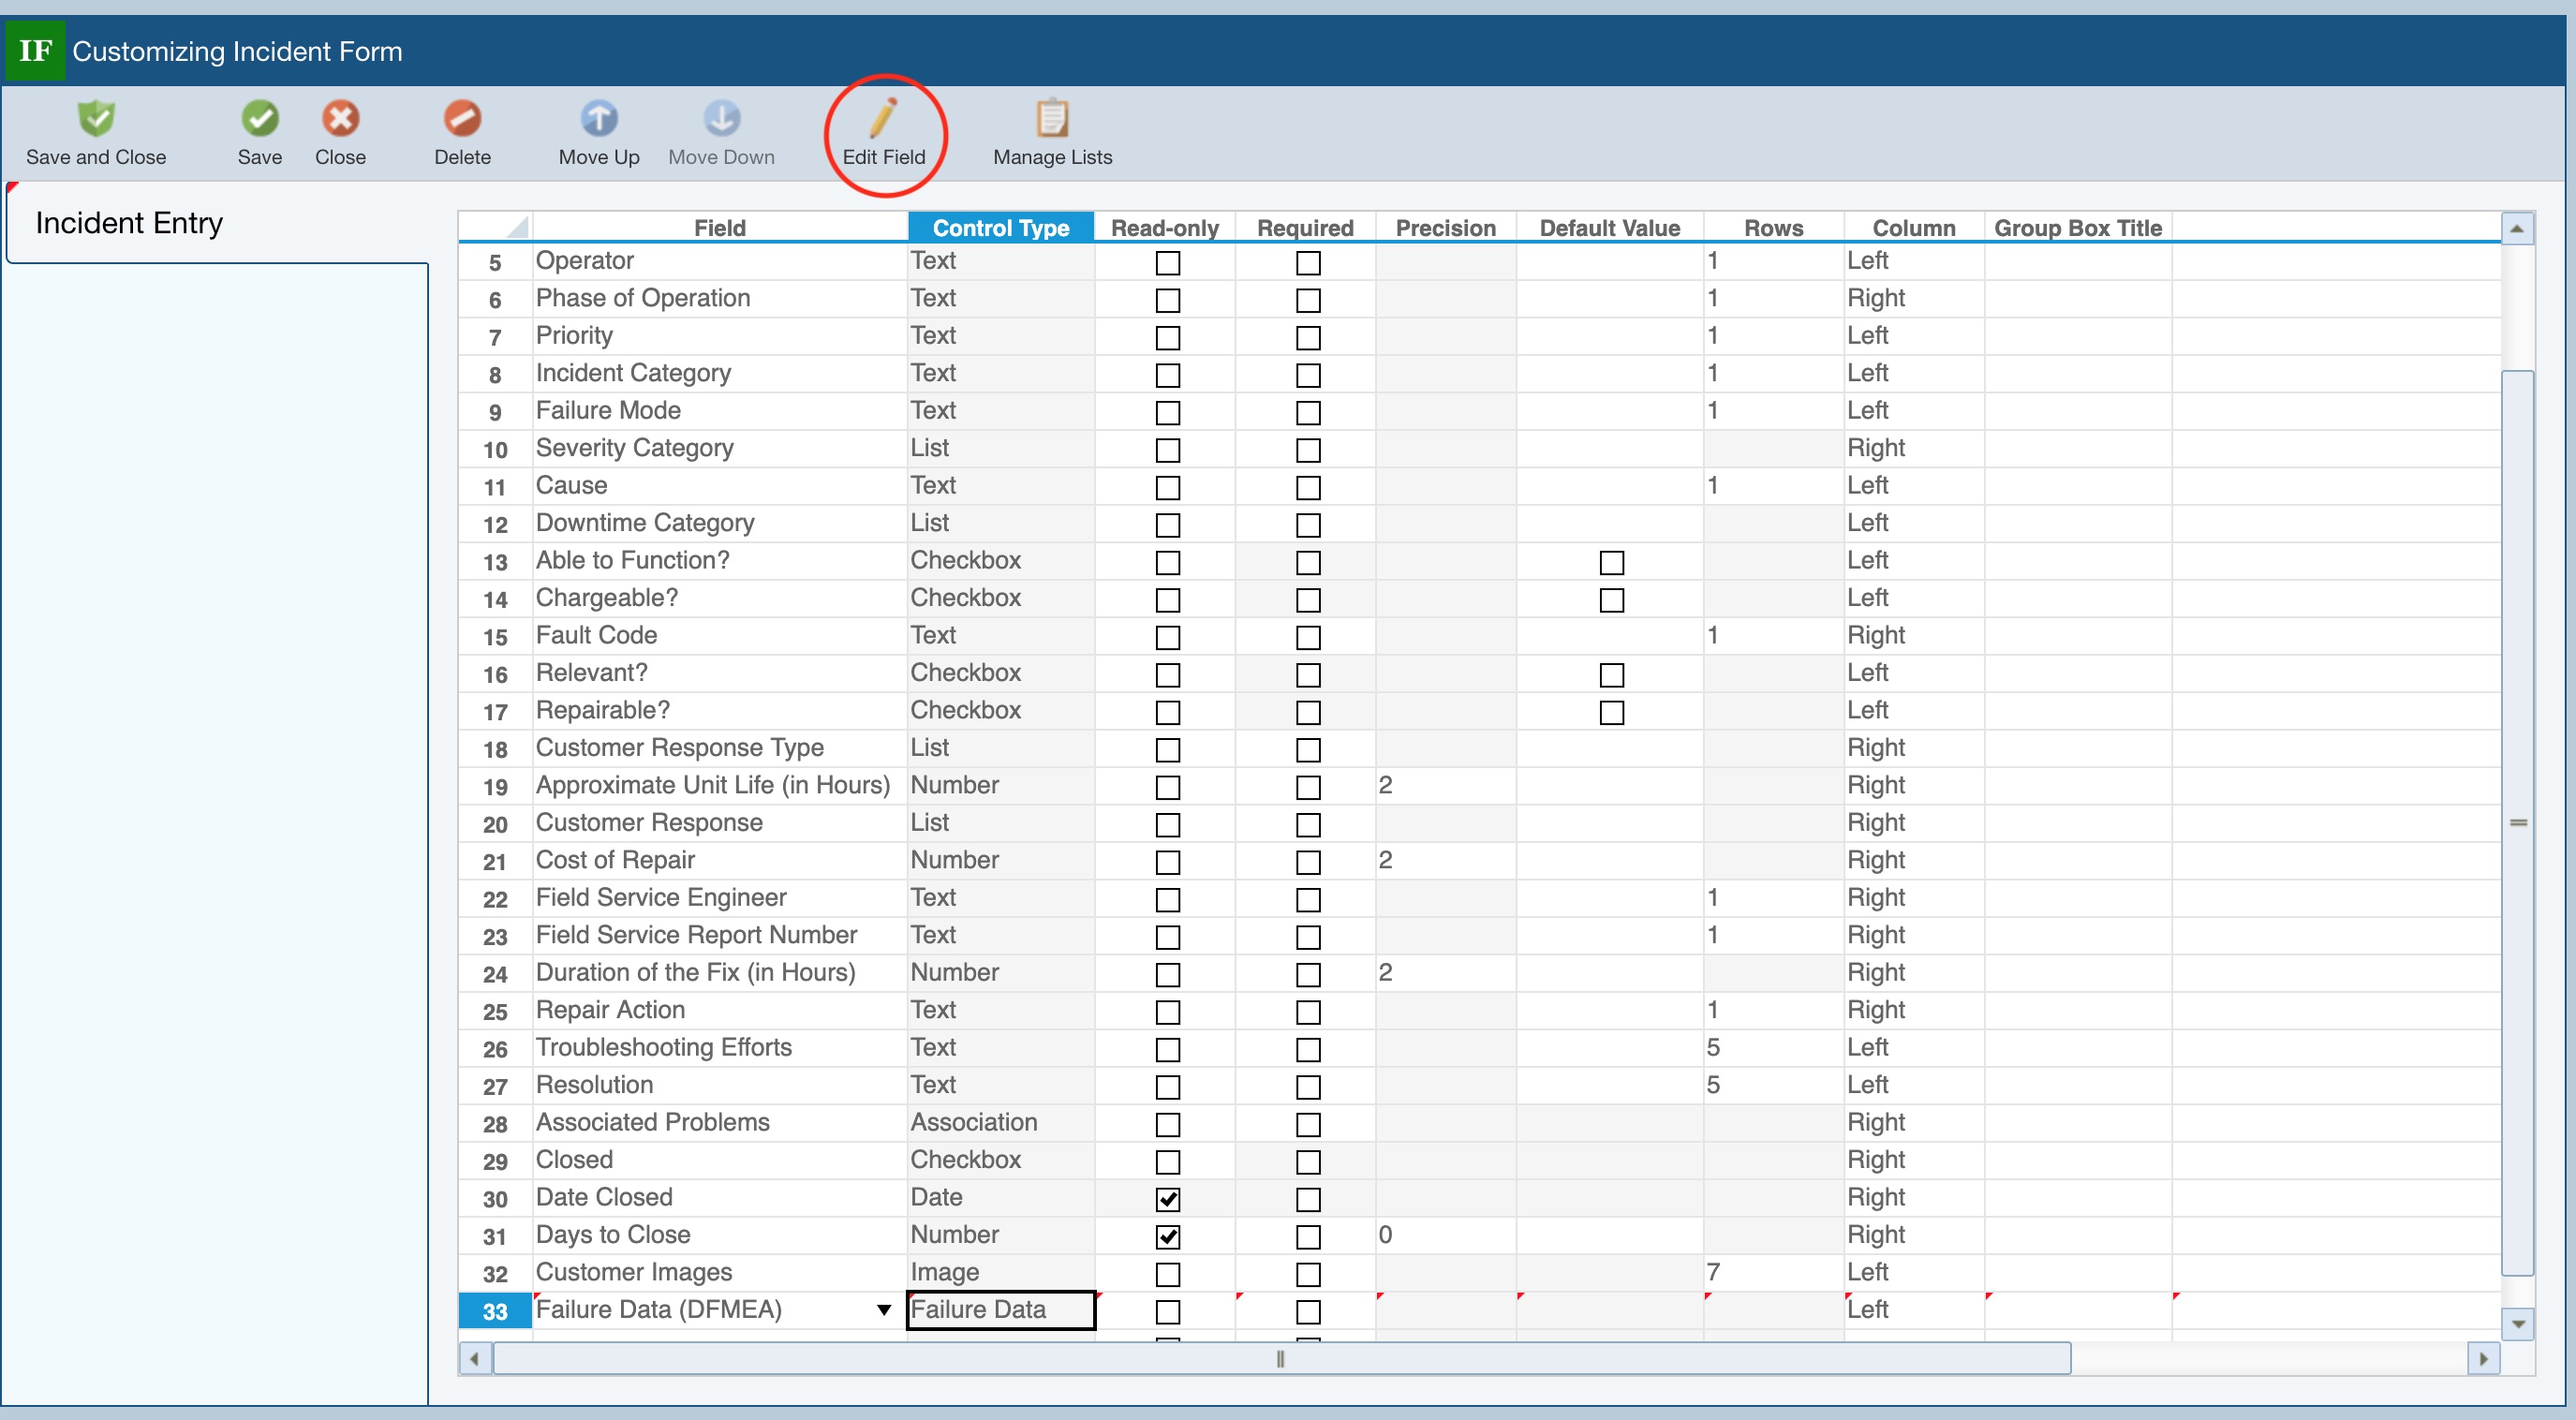
The Customizing Incident Form window appears.
Click in the last row of the Table, click the dropdown arrow in the Field column, and select the Failure Data widget you want to use, and then press Tab to add it. Note that you can add the Failure Data widget for any or all FMEA types you use, such as DFMEA, FMECA, etc.
.jpg)
Customizing the Failure Data widget
The Failure Data widget is fully customizable. Editing the Failure Data widget is the same procedure whether you edit it from the Incident Table customization or the Incident Form customization. Changes made in either place apply to the other.
If you are editing the Table view from the Customizing Incident Table window, select the Failure Data widget row in the Table, and click Edit Field button in the toolbar.
If you are editing the Form view from the Customizing Incident Form window, select the Failure Data widget row in the Table, and click the Edit button in the toolbar.
The Edit Field dialog appears.
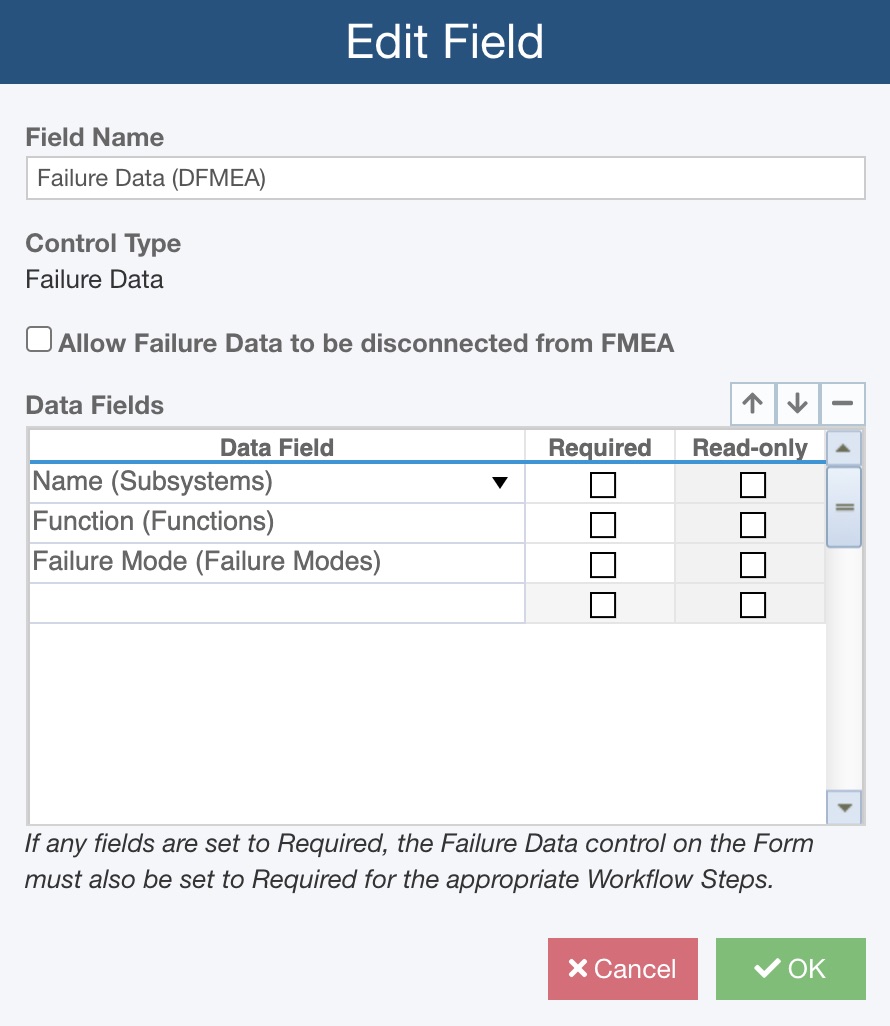
The Edit Field dialog enables you to fully customize the Failure Data widget for your needs.
Field Name
You can change the Field Name, or the title, displayed for this widget on the Form. You can enter any Field Name you prefer.
Control Type
The Control Type is for information purposes only. In this case it indicates that this is the special Failure Data widget.
Allow Failure Data to be disconnected from FMEA
When using the Failure Data widget during FRACAS data entry, the data fields in the Failure Data widget are populated with the failure information from the FMEA Worksheet. This enables the FRACAS team member to select the failure information that applies based on information already recorded during the FMEA process.
However, in some cases, the necessary failure information may not be able to be located in the FMEA lists. At this point, the FRACAS team member can decide to request that new failure information be added to the FMEA.
When new failure information is entered in FRACAS, it it transmitted back to the FMEA team for review and possible updating of the FMEA Worksheet.
If you prefer, you can allow the FRACAS team members to freely add new failure information without any notification back to the FMEA team. For example, perhaps your FMEA is completed and approved and no further changes are allowed. However, you still want to allow the FRACAS team members to be able to record new failure information if necessary. To allow disconnected failure information, select the Allow Failure Data to be disconnected from FMEA checkbox. Keep it clear to enforce failure data connections.
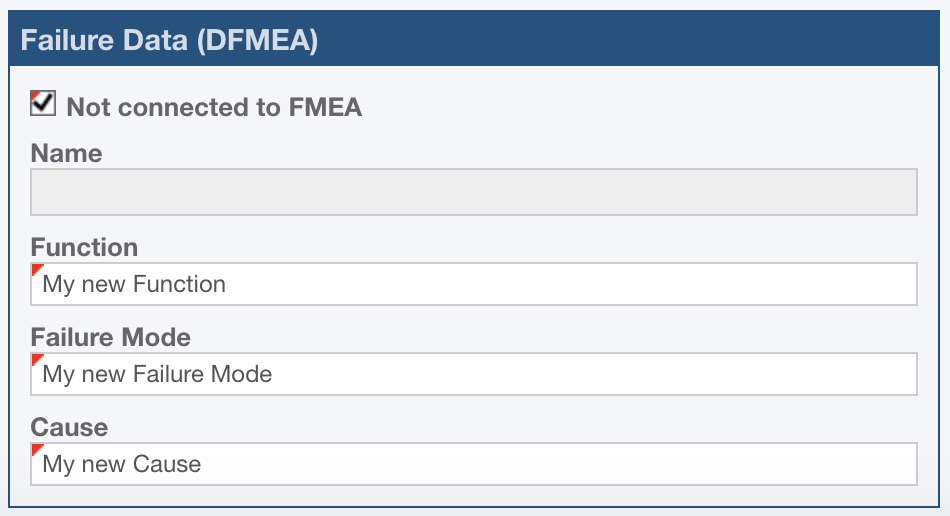
When this option is enabled, the Not connected to FMEA checkbox appears at the top of the Failure Data widget. To enter new, disconnected Failure Data, select the checkbox and then type in the new failure information. The entered data is available only in FRACAS and is not reviewable by the FMEA team.
Data Fields Table
Data Fields
You can select from any of the available FMEA or Analysis Tree data fields to include in the Failure Data widget.
By default, the widget includes the Subsystem Name, Function, and Failure Mode data fields.
Move Up, Move Down, Delete
The arrow up, arrow down, and delete buttons allow you to move the selected row in the table up or down, or to remove it from the list.
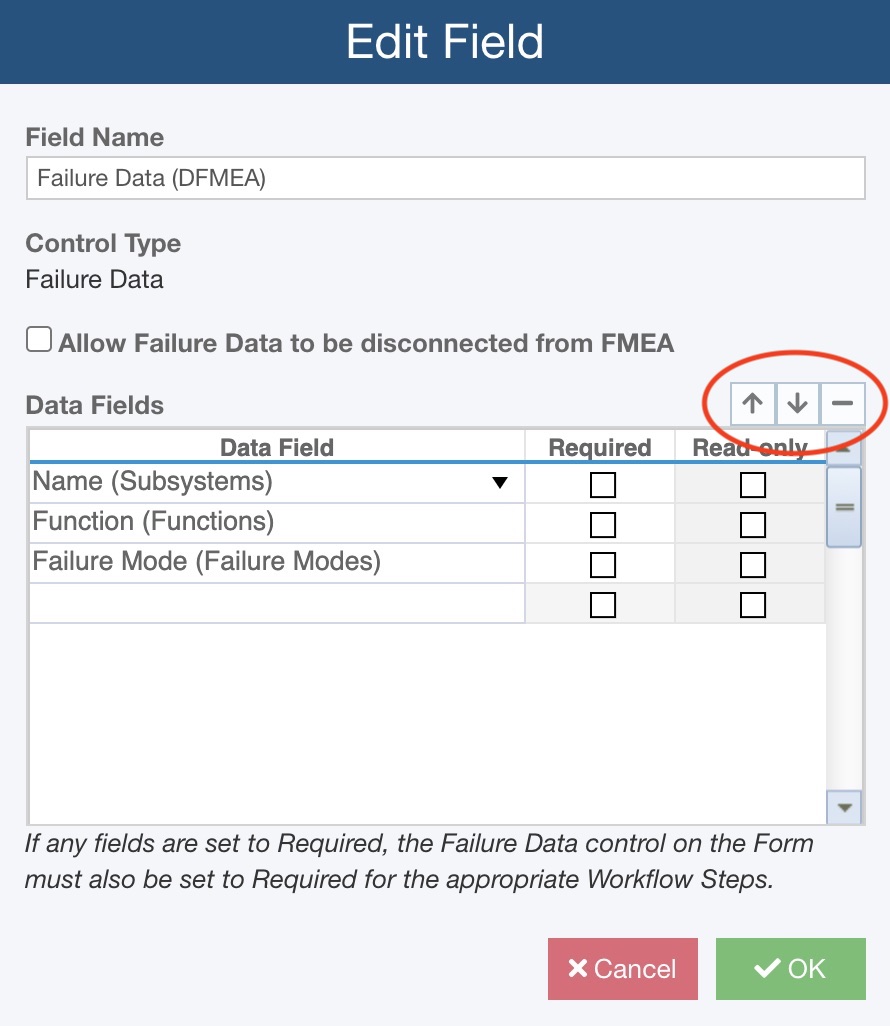
Required
If a data field is required it means that a data value must be entered, i.e. blanks are not allowed. To make any data fields required, select the Required checkbox for the applicable Data Field.
There are two steps to setting a data field to be required when using the Failure Data widget:
1. Select the Required checkbox in the Failure Data widget for the Data Field.
2. Select the Required checkbox in the Customizing Form table for the Workflow Step for which you want to enforce the required setting.
For example, perhaps you want to make sure that before an Incident is Closed in FRACAS that the Cause is recorded. If you have a multi-step Workflow, you may have one or more Workflow Steps (Forms) before the final Closed Workflow Step. In this case, you want the Cause data field to be required only on the Close Step. At the earlier stages, the Cause may not be known - perhaps you need to wait on a product return and analysis to determine the Cause. In this situation, select Required for the Cause data field in the Failure Data widget, and then select Required on the Form for the Closed Workflow Step.
Read-only
If a selected data field is not editable, it will be marked Read-only.
The following data fields are available to be connected to FMEA (due to customization, these field names may be labeled differently in your FMEA):
- Function
- Failure Mode
- Cause
- Effect
You may choose additional FMEA data fields to be placed in the Failure Data widget. These additional fields may be helpful for informational purposes for your FRACAS team, so adding them to the Failure Data widget may be useful. For example, it may be helpful for your FRACAS team to see the Recommended Actions taken for a Failure Mode.
FRACAS team members cannot modify or add new items to these additional data fields, so are designated Read-only and appear as disabled in the Failure Data widget.