Generating ALT Reports
Once you have completed data entry and calculation, you may want to generate a report of your ALT plot or ALT input data.
Generating an ALT Plot Report
To generate an ALT plot report, click Report from the Sidebar when the ALT plot is displayed.
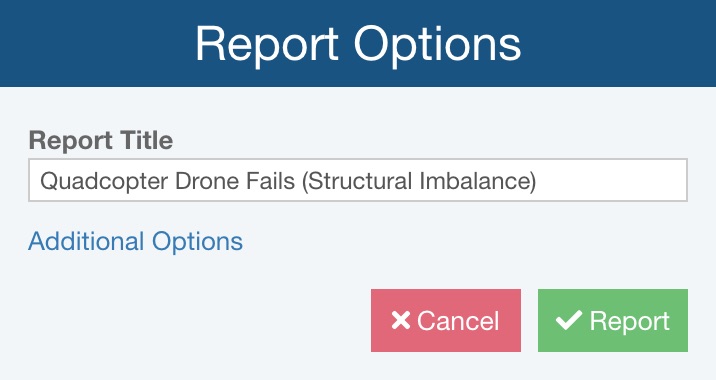
The Report Options dialog appears.

Enter the Report Title, which will appear at the top of the ALT Plot report.
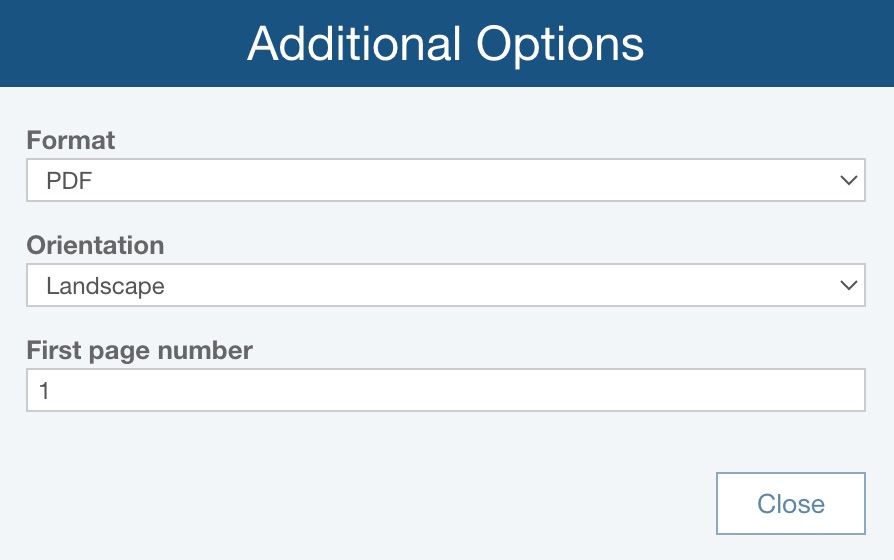
If needed, click Additional Options to see additional reporting options.

For Format, select from PDF, BMP, JPG, PNG, SVG.
If Format = PDF, for Orientation, choose between:
- Portrait - the report page will be set so it is taller than it is wider
- Landscape - the report page will be set so it is wider than it is tall
If Format = PDF, for First page number, enter the desired first page number for the ALT Plot report; this can be helpful if the report will be a specific set of page numbers in a larger deliverable.
Click Report.
The ALT plot report is downloaded to your default Downloads location in the selected Format.
.jpg)
Generating an ALT Data Report
You may also want to create a report of your ALT input data. If you are viewing the Plot and not the Data Points table, click the To Table toolbar button.

Click Report from the Sidebar menu.
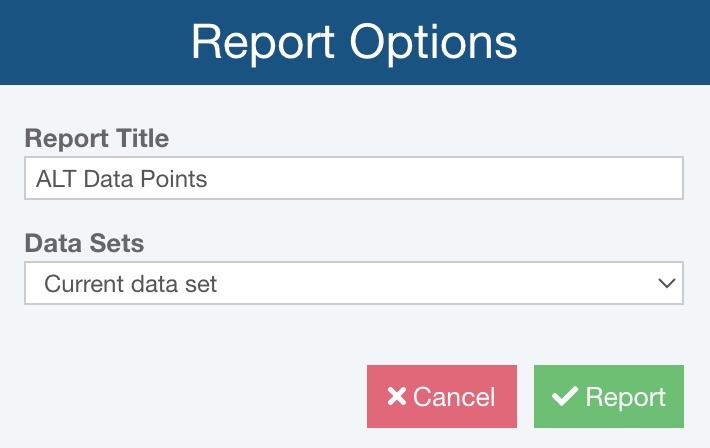
The Report Options dialog appears.

Enter a Report title. Select Current data set or All data sets from the Data sets dropdown list depending on what you want to see in your report. Click the Report button to generate the report.
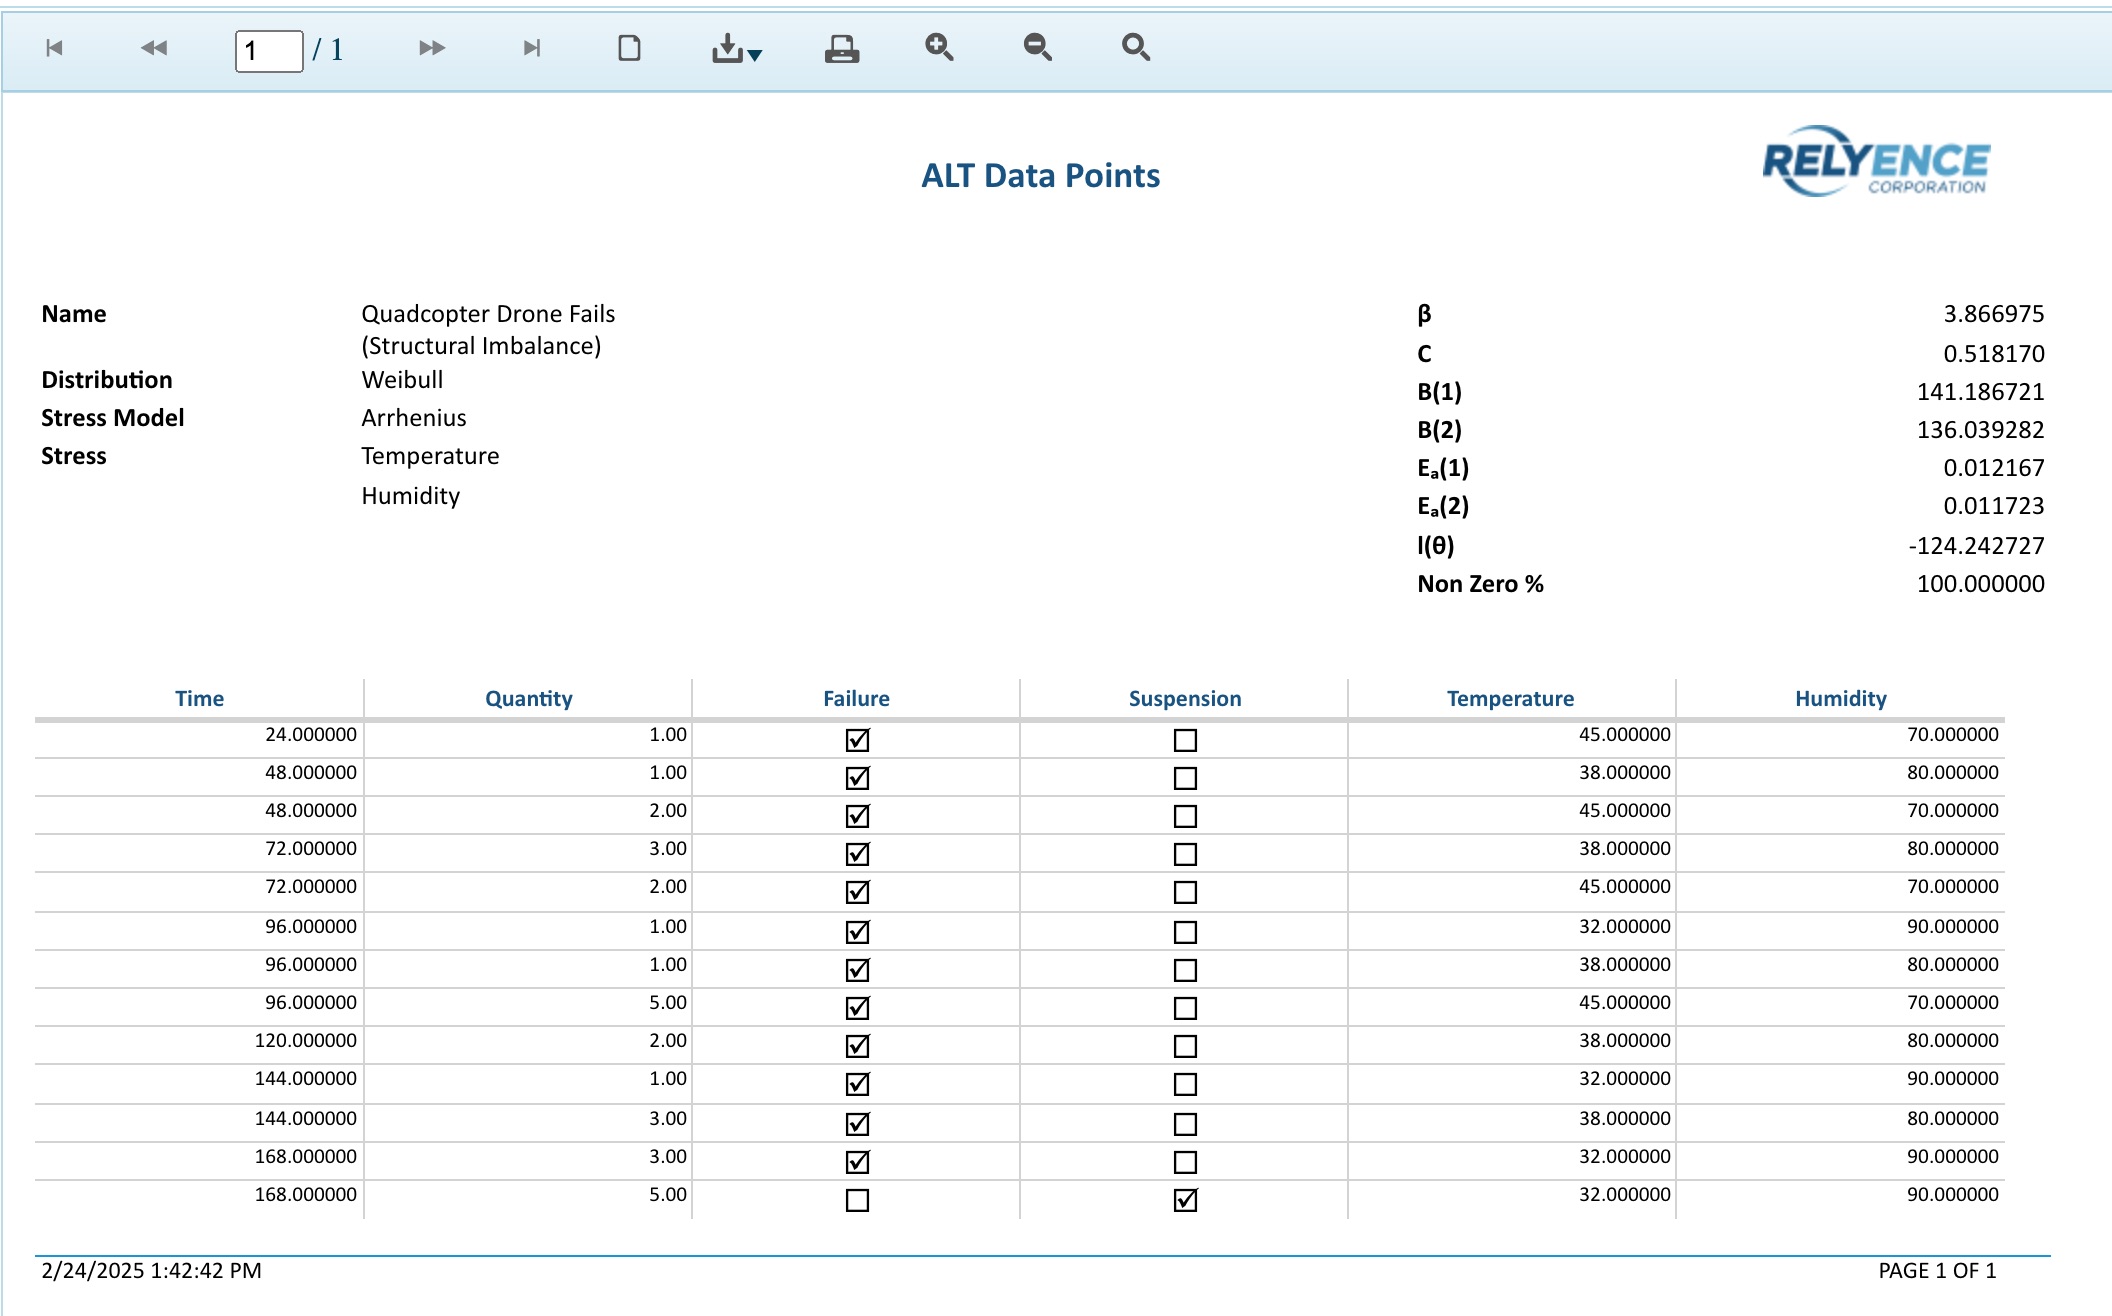
The report appears in a new browser tab.

You can print reports, or save them in a PDF, Excel, PowerPoint, TIFF, or Word format.
Close the Report browser tab when you are done viewing the report.