Generating Fault Tree Reports
You can create reports of your Fault Tree diagram, in a diagram or tabular format, your Fault Tree Table, in a tabular format, and your Fault Tree calculation results tables.
Generating Fault Tree Diagram Reports
To generate a report of your fault tree diagram, from the Fault Tree Diagram pane, click Report from the Sidebar. The Report Options dialog appears.
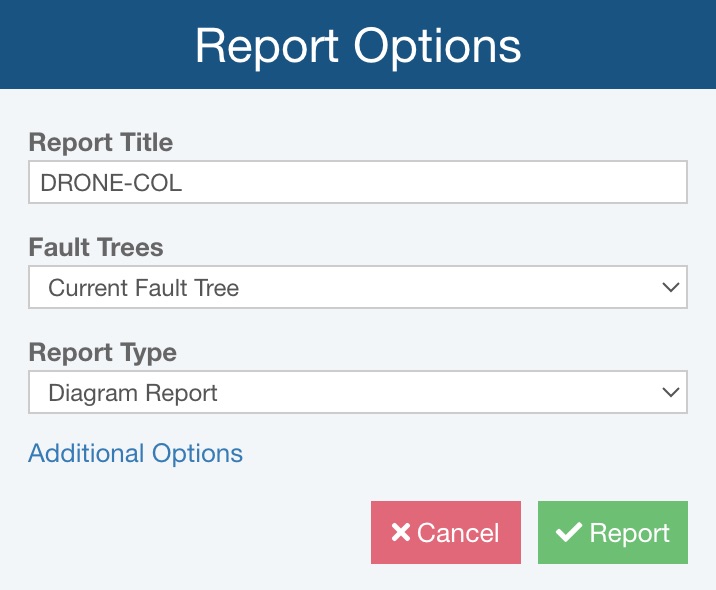
Enter a Report Title , which will appear at the top of the Fault Tree diagram report.
For Fault Trees, select which fault trees to include in the report. Select from:
- Current Fault Tree
- Current Fault Tree and Subtrees
- All Fault Trees and Subtrees
For Report Type, choose:
- Diagram Report - the Fault Tree diagram will be shown in a graphical format on a new browser tab.
- Tabular Report - the Fault Tree diagram details will be generated to an Excel format (.xlsx) downloaded to your default downloads directory, where a worksheet is created for each Top Gate and Transfer Gate in the fault tree; Names of Transfer Gates will appear as links and when clicked navigate to the worksheet for the Transfer gate.
If Report Type is set to Diagram Report, if needed, you can click the Additional Options link for additional reporting options.
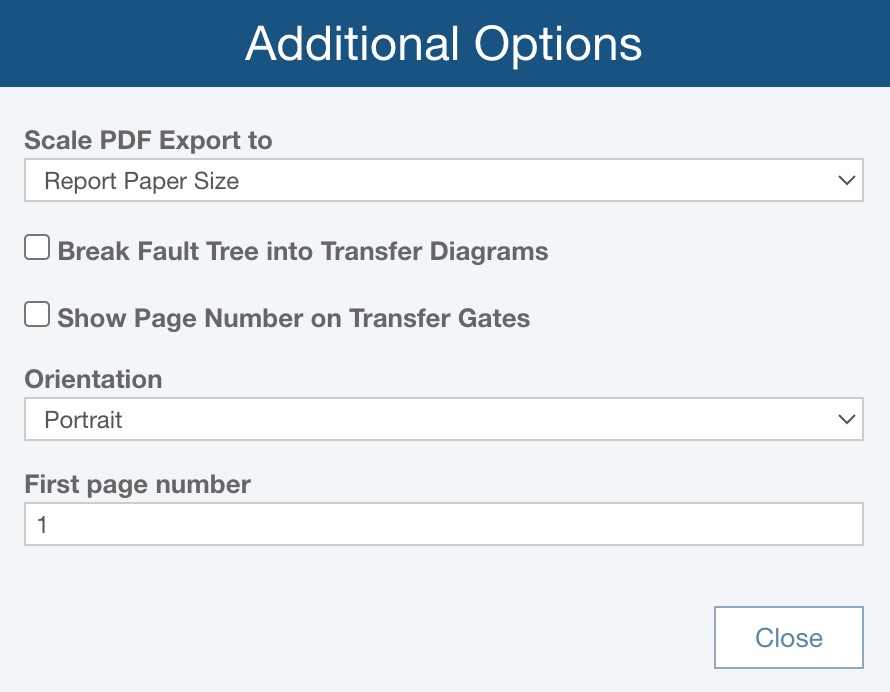
For Scale PDF Export to, choose:
- Report Paper Size - if the Fault Tree diagram is exported to PDF, it will be scaled based on the Report Paper Size, set via Settings
- Diagram Size - if the Fault Tree diagram is exported to PDF, it will be scaled based on the size of the Fault Tree diagram
Select Break Fault Tree into Transfer Diagrams, if preferred. Due to scaling and pagination settings, if needed, branches will be broken into Transfer Diagrams that show branch details on another page.
Select Show Page Number on Transfer Gates, if preferred. When Transfer Gates are used, either as created in the Fault Tree diagram or as added from the report generation, a reference to the page number for the branch details will be denoted with the Transfer Gate.
For Orientation, choose:
- Portrait - the report page will be set so it is taller than it is wider
- Landscape - the report page will be set so it is wider than it is tall
For First page number, enter the desired first page number for the fault tree diagram report; this can be helpful if the report will be a specific set of page numbers in a larger deliverable.
Click Close to return to the Report Options dialog.
Click Report to generate the report.
If you generate a Diagram Report, the report appears in a new browser tab.
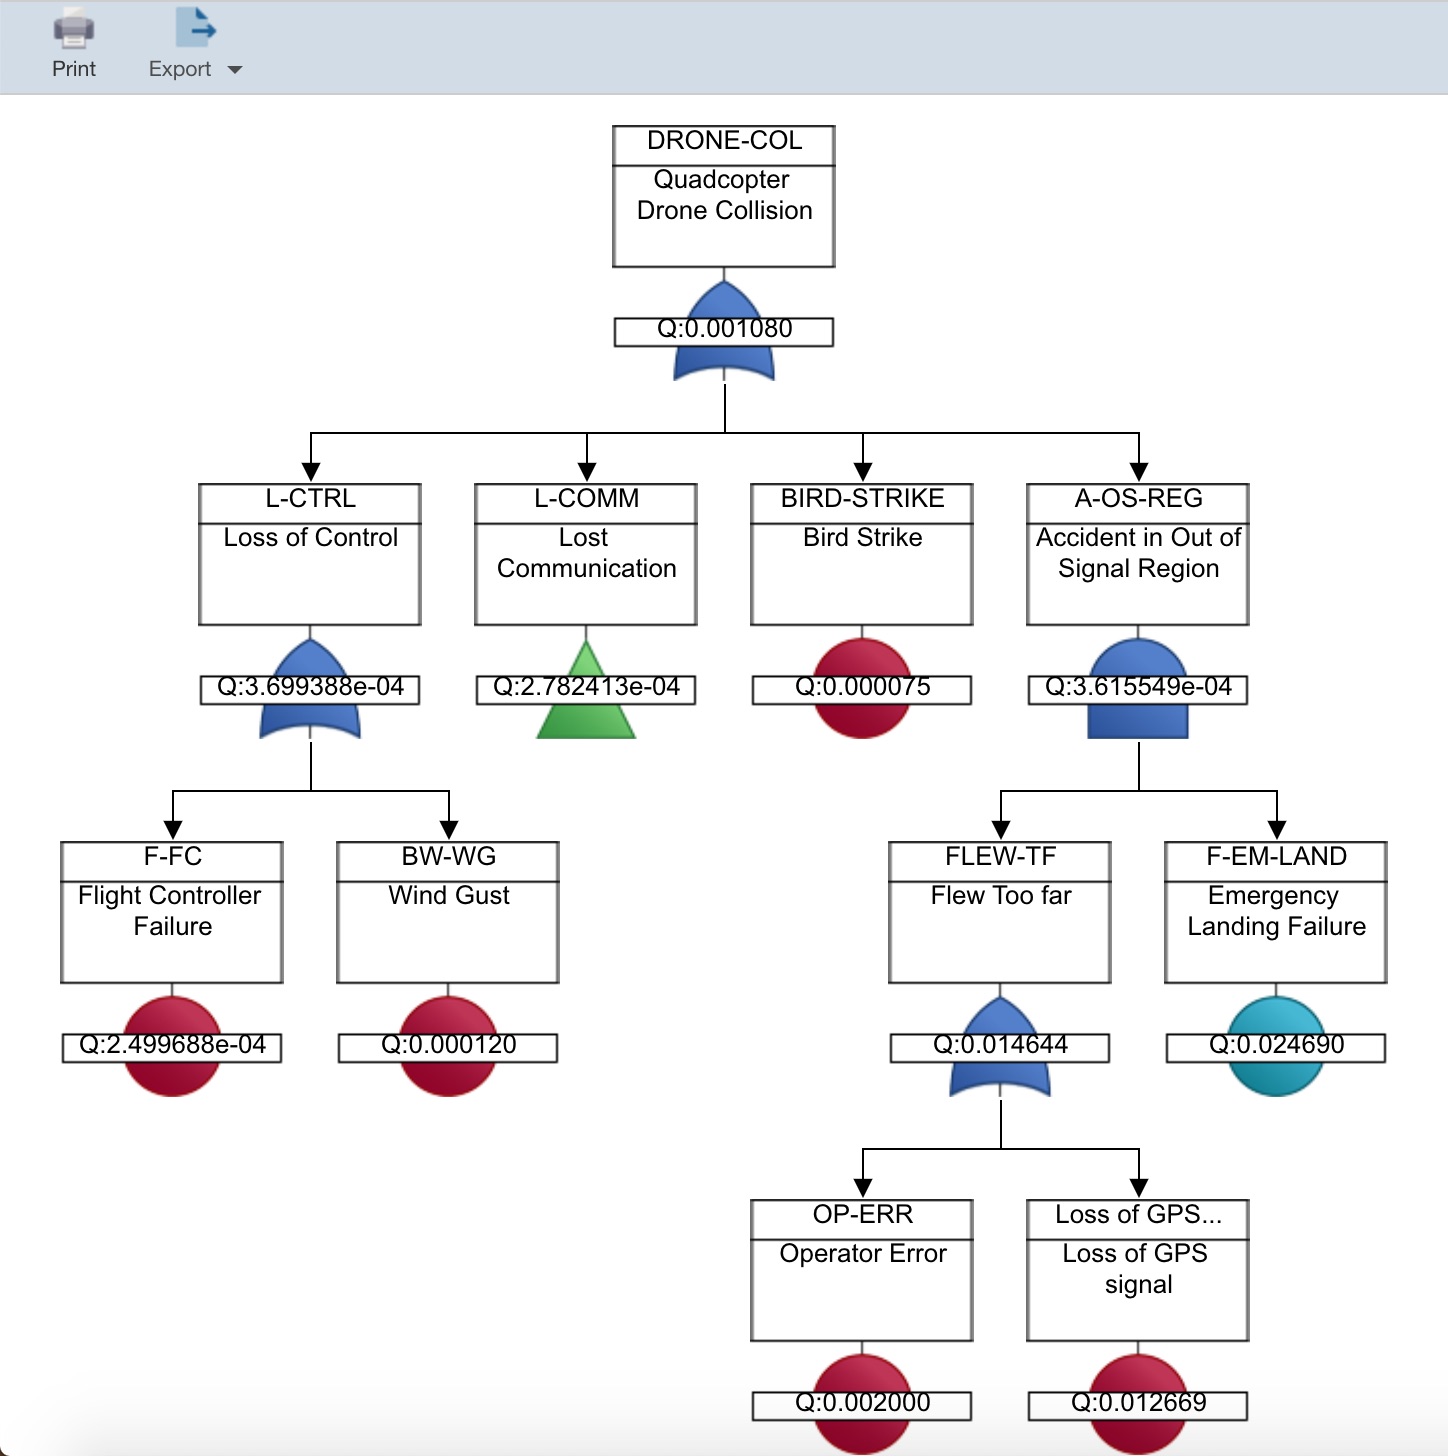
You can print your report by clicking the Print button in the toolbar. You can choose to export the report to a PDF, JPG, BMP, PNG, or SVG format if you would like. Select the appropriate graphical format from the Export dropdown in the toolbar.
Close the Report browser tab when you are done viewing the report.
Or, if you generate a Tabular Report, Relyence generates the report to an Excel (.xlsx) file to your default downloads directory.

Generating Fault Tree Table Reports
To generate a report of your fault tree details, from the Fault Tree Table pane, click Report from the Sidebar. The Report Options dialog appears.
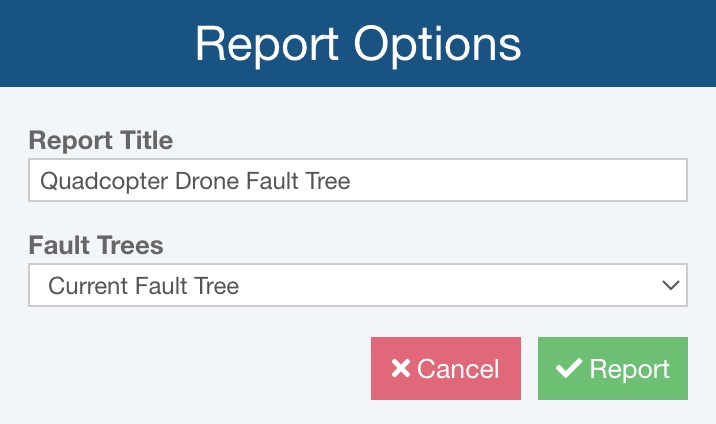
Enter a Report Title , which will appear at the top of the report.
For Fault Trees, select which fault trees to include in the report. You can select from Current Fault Tree, Current Fault Tree and Subtrees, or All Fault Trees and Subtrees.
Click Report to generate the report.
A tabular report is generated to an Excel format (.xlsx) downloaded to your default downloads directory, where a worksheet is created for each Gate in the fault tree; Names of Transfer Gates will appear as links and when clicked navigate to the worksheet for the Transfer gate.

Generating Fault Tree Calculation Results Table Reports
You can also generate a report on the calculation results. Click View Results from the Sidebar, and then click the Report button.
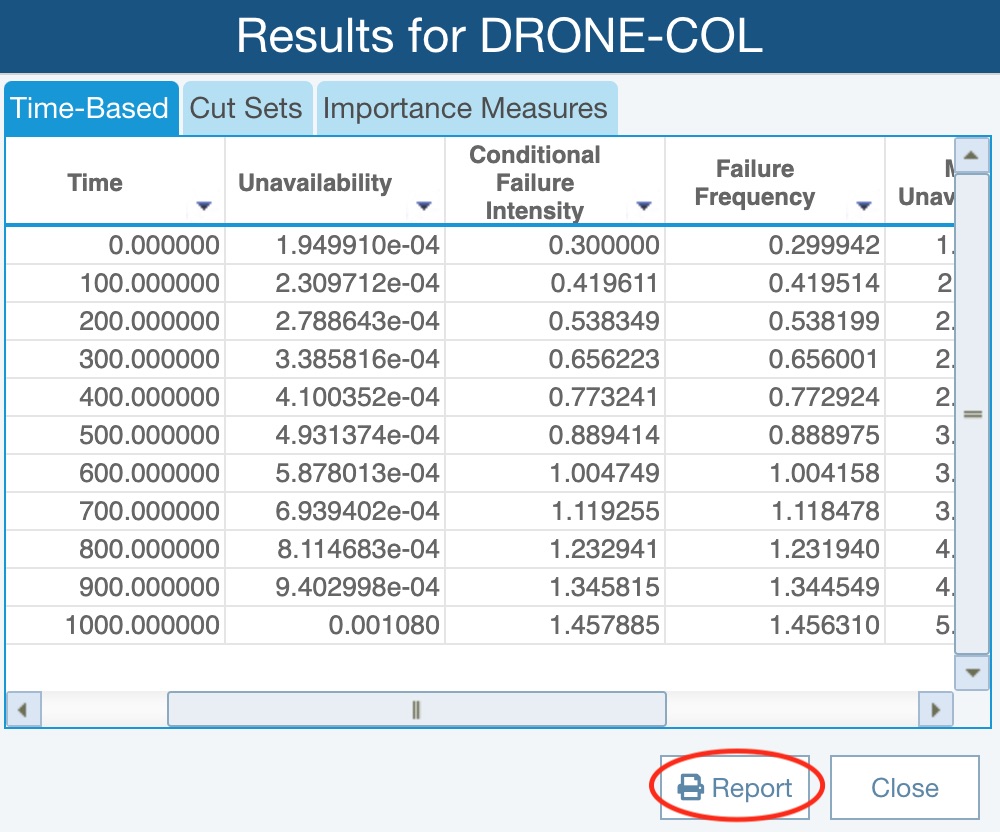
The Report Options dialog appears.
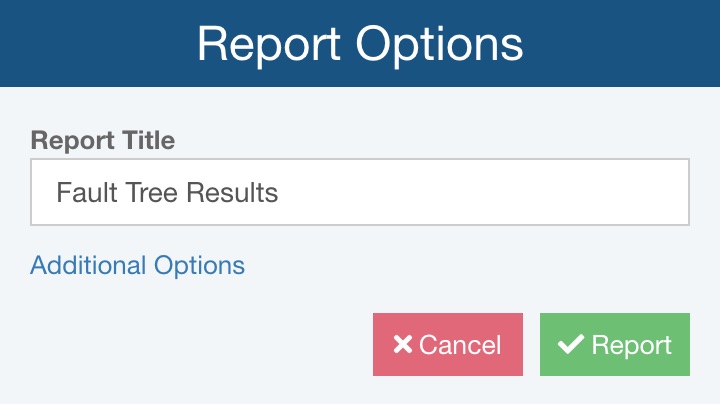
You can enter the Report Title for your report.
If needed, click the Additional Options link to set additional reporting options, including which results to include (Time-based results, Cut sets, Importance measures).
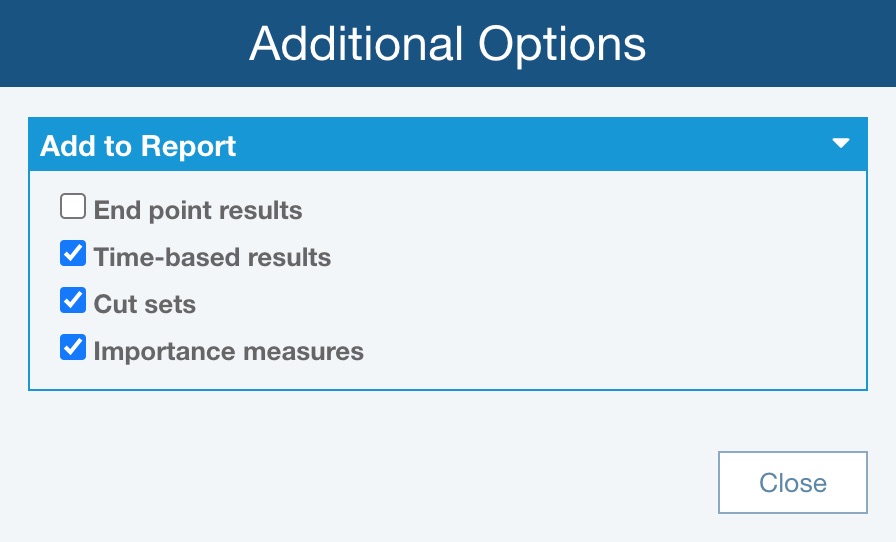
Note that the End point results option would add one more section to the report to show all the calculated results at the End time specified in the calculation settings.
Click Close to return to the Report Options dialog.
Click Report to generate a text-based report of your fault tree calculation results. This sample fault tree results report includes Time-based results, Cut sets, and Importance measures.
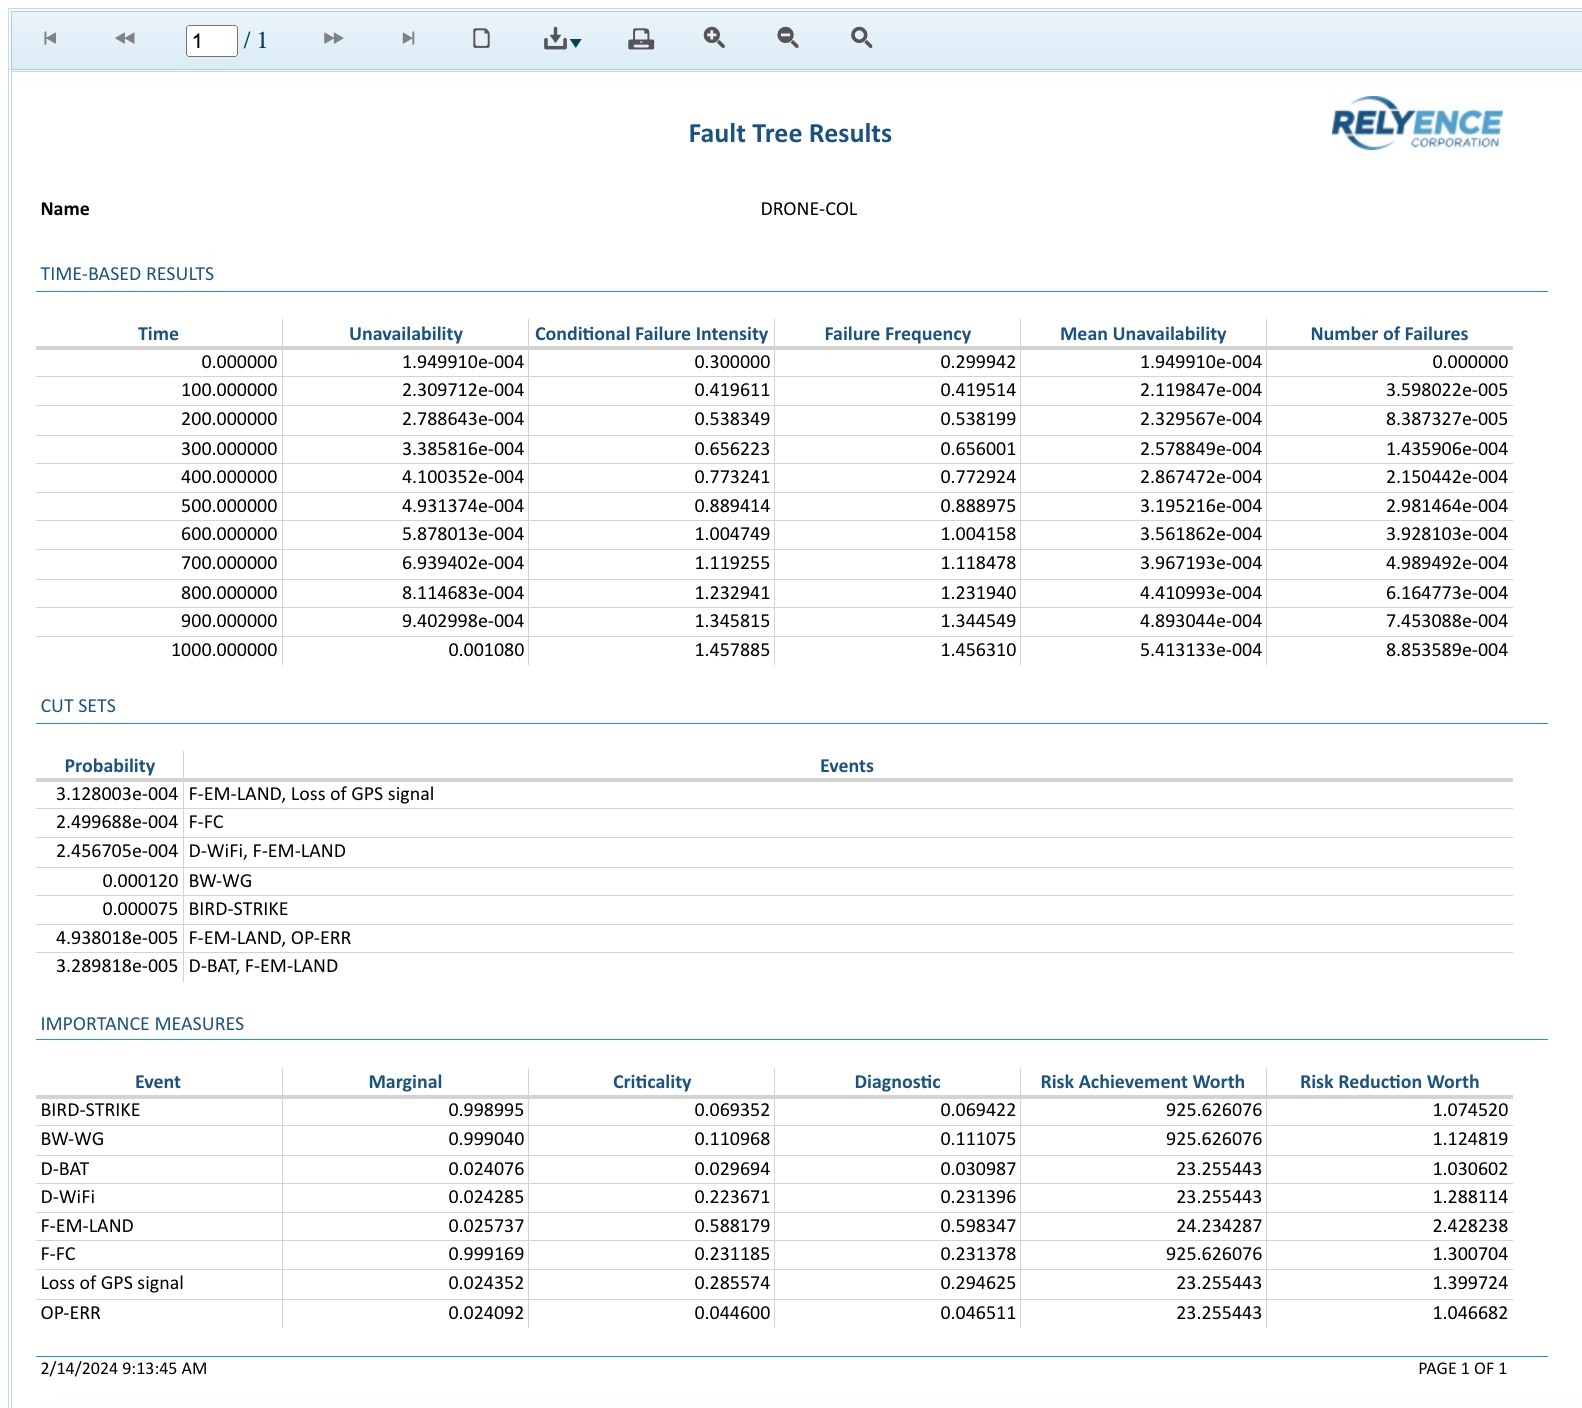
Close the report browser tab when you are done viewing the report.
Click Close to close the Results dialog.