Generating RBD Reports
You can create reports of your diagrams and RBD results tables.
Generating an RBD Report
To generate a report of your RBD, from the RBD pane, click Report from the Sidebar. The Report Options dialog appears.
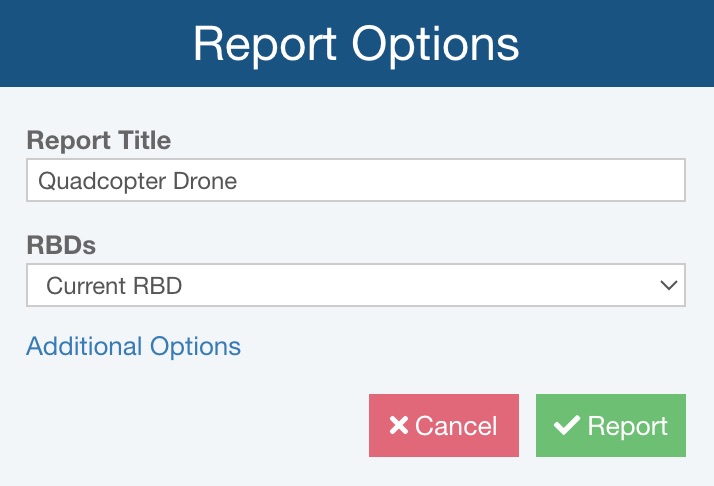
You can enter the Report Title for your report.
Select which RBDs to include in the report. Choose from:
- Current RBD
- Current RBD and Subdiagrams
- All RBDs and Subdiagrams
If needed, click Additional Options to see additional reporting options.
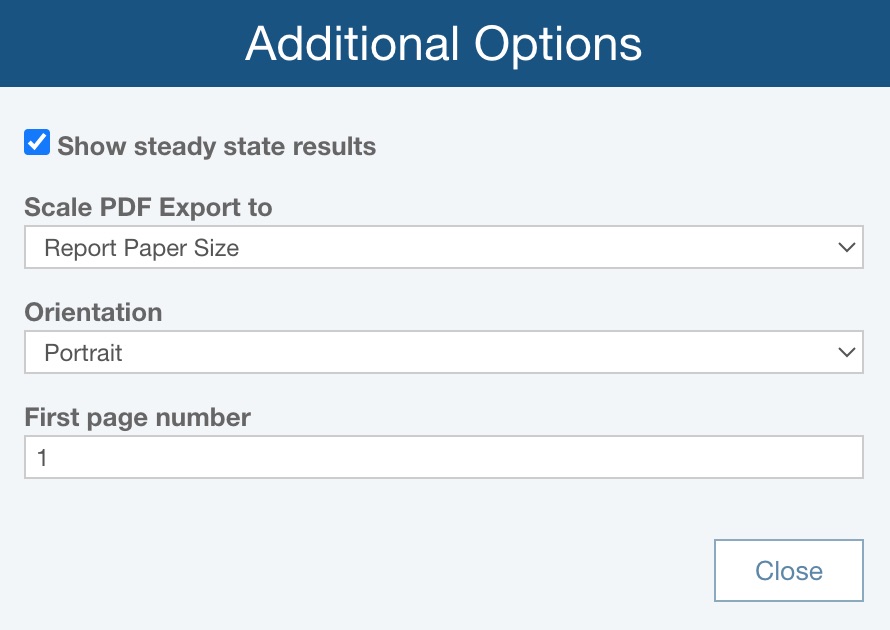
Select whether you want to Show steady state results on the report; they will appear at the top of the report with the Report Title.
For Scale PDF Export to, choose:
- Report Paper Size - if the RBD is exported to PDF, it will be scaled based on the Report Paper Size, set via Settings
- Diagram Size - if the RBD is exported to PDF, it will be scaled based on the size of the RBD
For Orientation, choose:
- Portrait - the report page will be set so it is taller than it is wider
- Landscape - the report page will be set so it is wider than it is tall
For First page number, enter the desired first page number for the RBD report; this can be helpful if the report will be a specific set of page numbers in a larger deliverable.
Click Close to return to the Report Options dialog.
Click Report to generate the report. The report appears in a new browser tab.
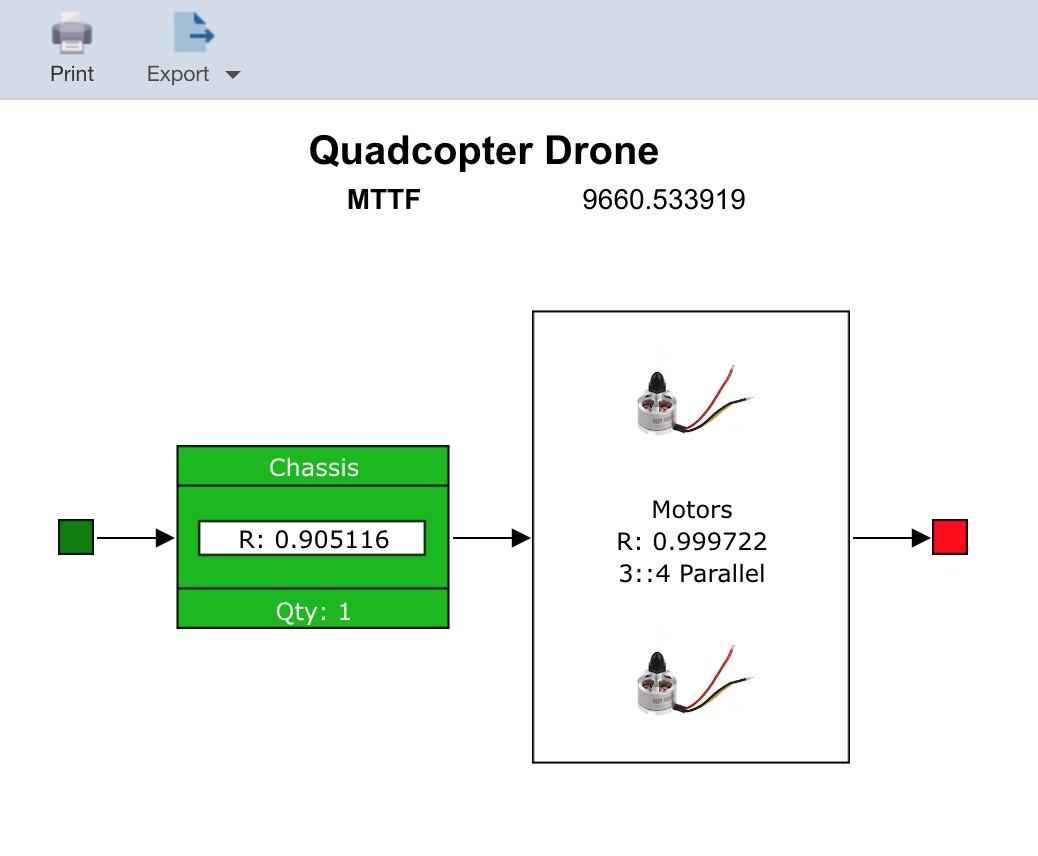
You can print your report by clicking the Print button in the toolbar. You can choose to export the report to a PDF, JPG, BMP, PNG, or SVG format if you would like. Select the appropriate graphical format from the Export dropdown in the toolbar.
Close the Report browser tab when you are done viewing the report.
Generating an RBD Results Report
You can also generate a report on the calculation results. Click View Results from the Sidebar, and then click the Report button.
The Report Options dialog appears.
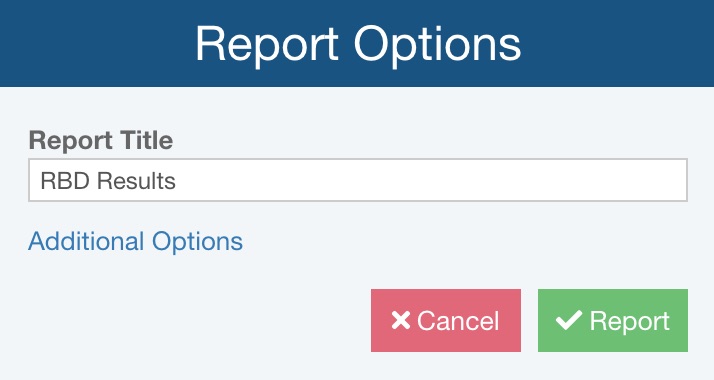
You can enter the Report Title for your report.
If needed, click Additional Options to see additional reporting options.
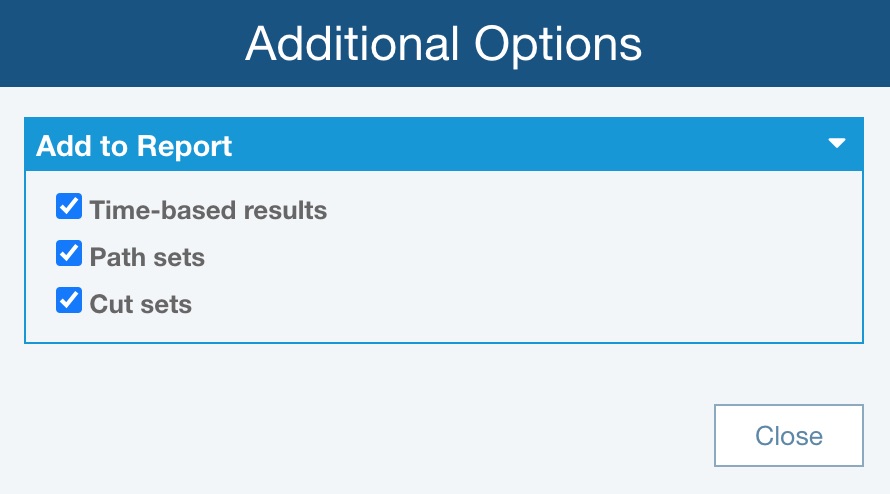
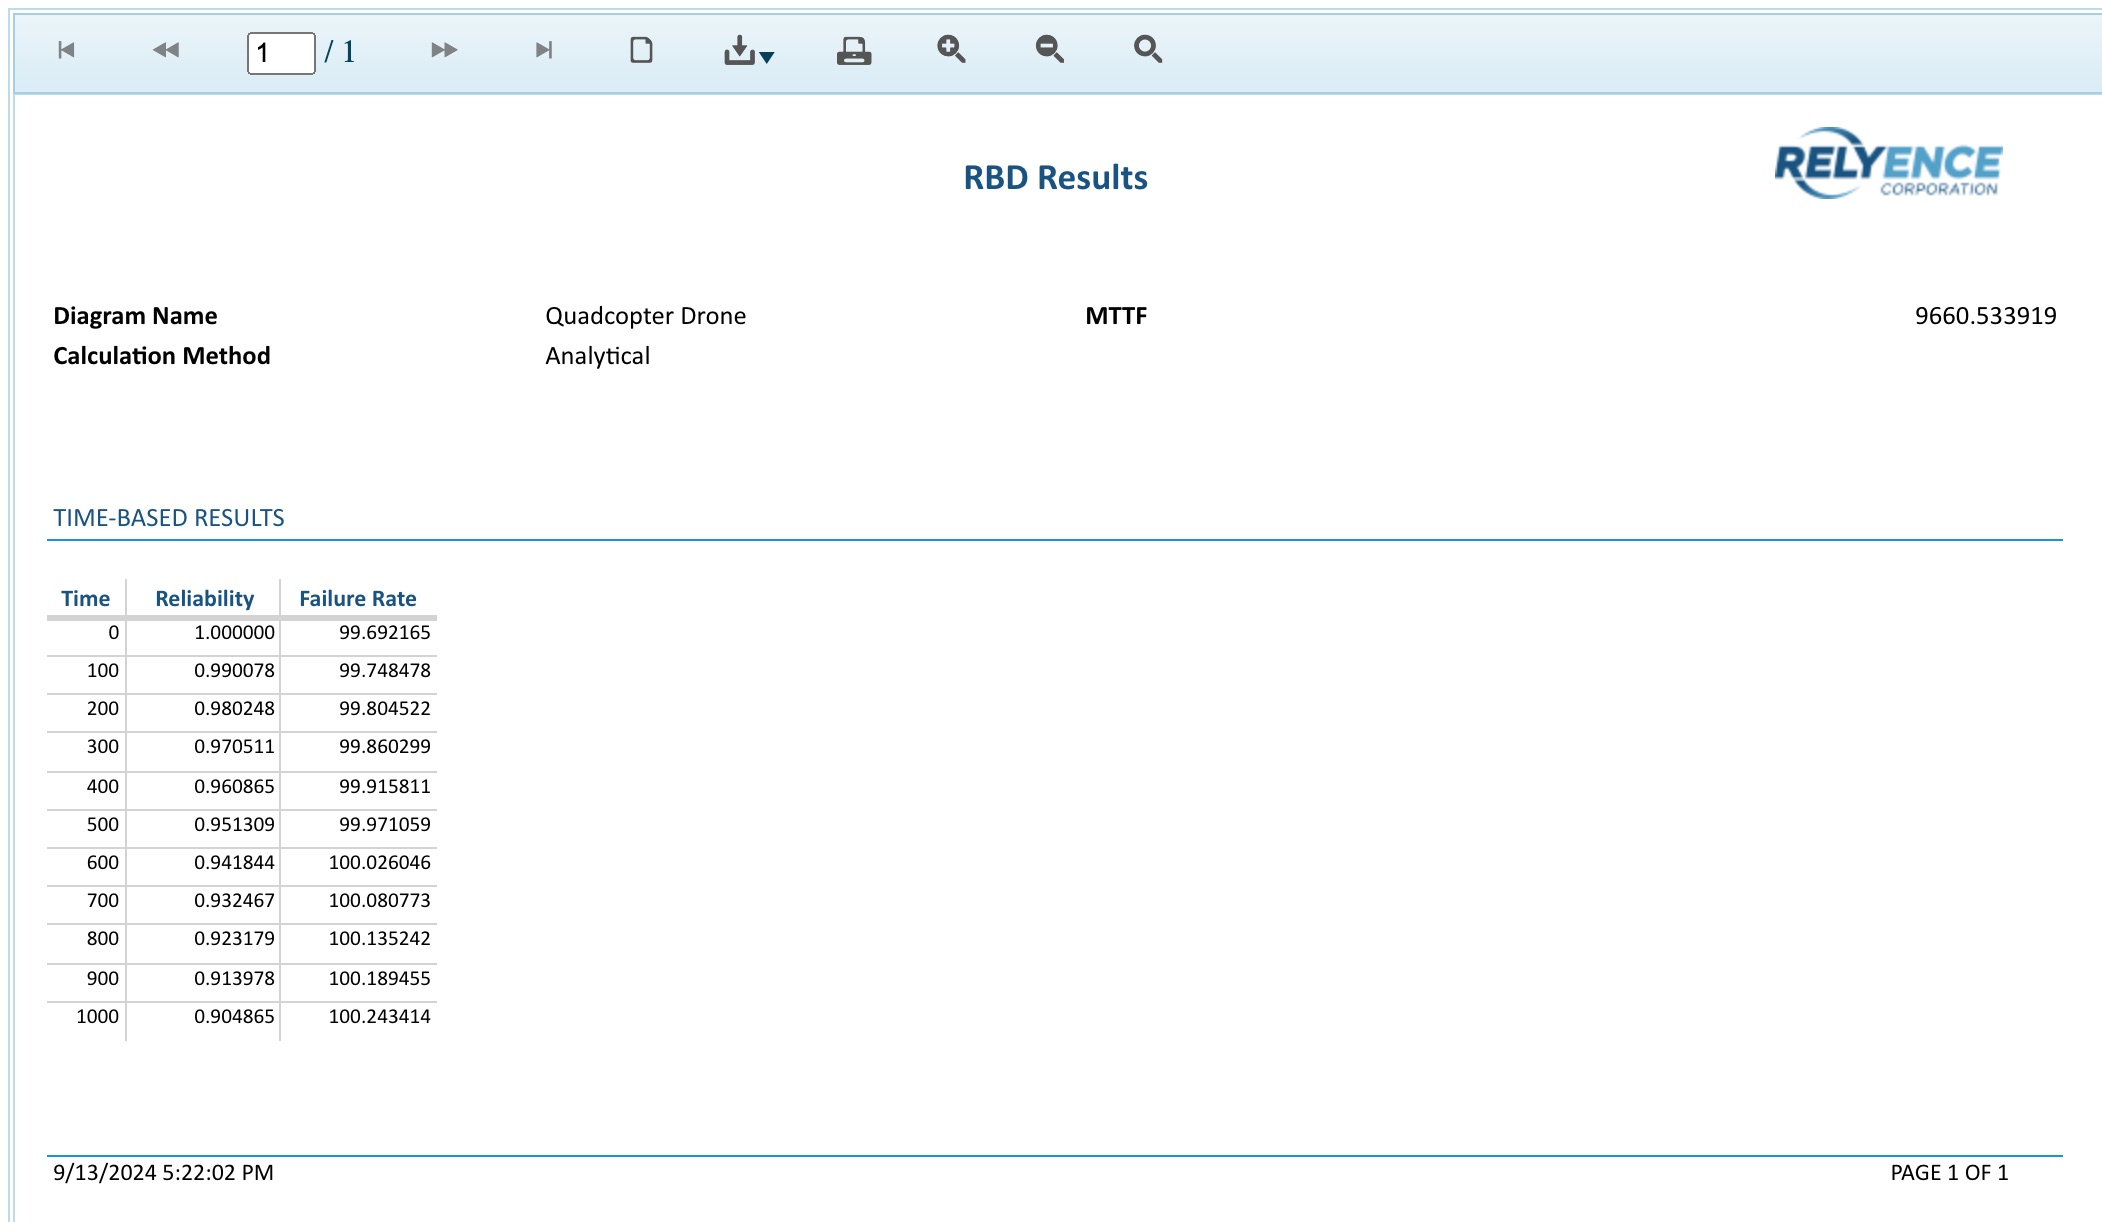
You can choose to include Time-based results, Path sets, and Cut sets. The example report below includes only Time-based results.
Click Close to return to the Report Options dialog.
Click Report to generate a text-based report of your RBD results.
Close the report browser tab when you are done viewing the report.
Click Close to close the Results dialog.