Life Data Analysis Group Plots
If you need to review multiple Data Sets on a single plot for analysis, you can create a Group Plot and add the Data Sets to it. A Group Plot can show up to five Life Data Sets.
Creating and Configuring a Group Plot
Open your Analysis with multiple Weibull Life Data Sets.
To create a new Group Plot, from the Data Sets pane, click Insert>Group Plot.
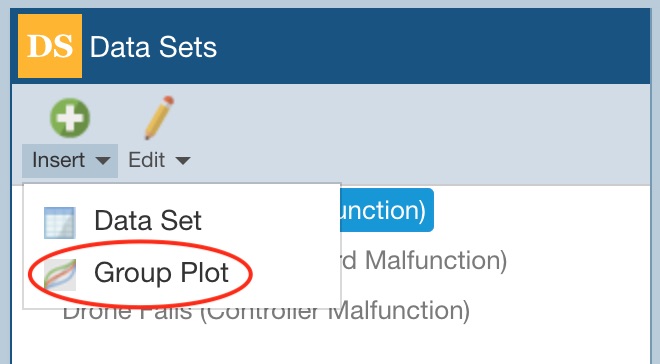
Note that you can also Insert a Data Set (Entering Life Data Set). Also note that if you click the top part of the Insert button (the green/white plus sign), it will add a new Data Set or Group Plot, depending on which type is currently selected.
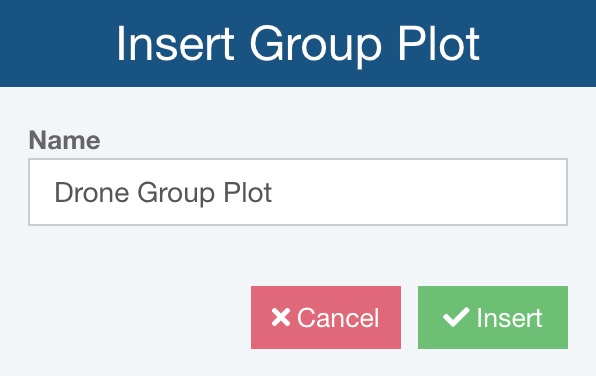
The Insert Group Plot dialog appears.
Assign a Name to your Group Plot and click Insert.
The Group Plot Data Sets dialog appears.
Identify the Data Sets you want to include on the Group Plot. Use the Find function, if needed.
Select the Data Sets you want to show together on the Group Plot.
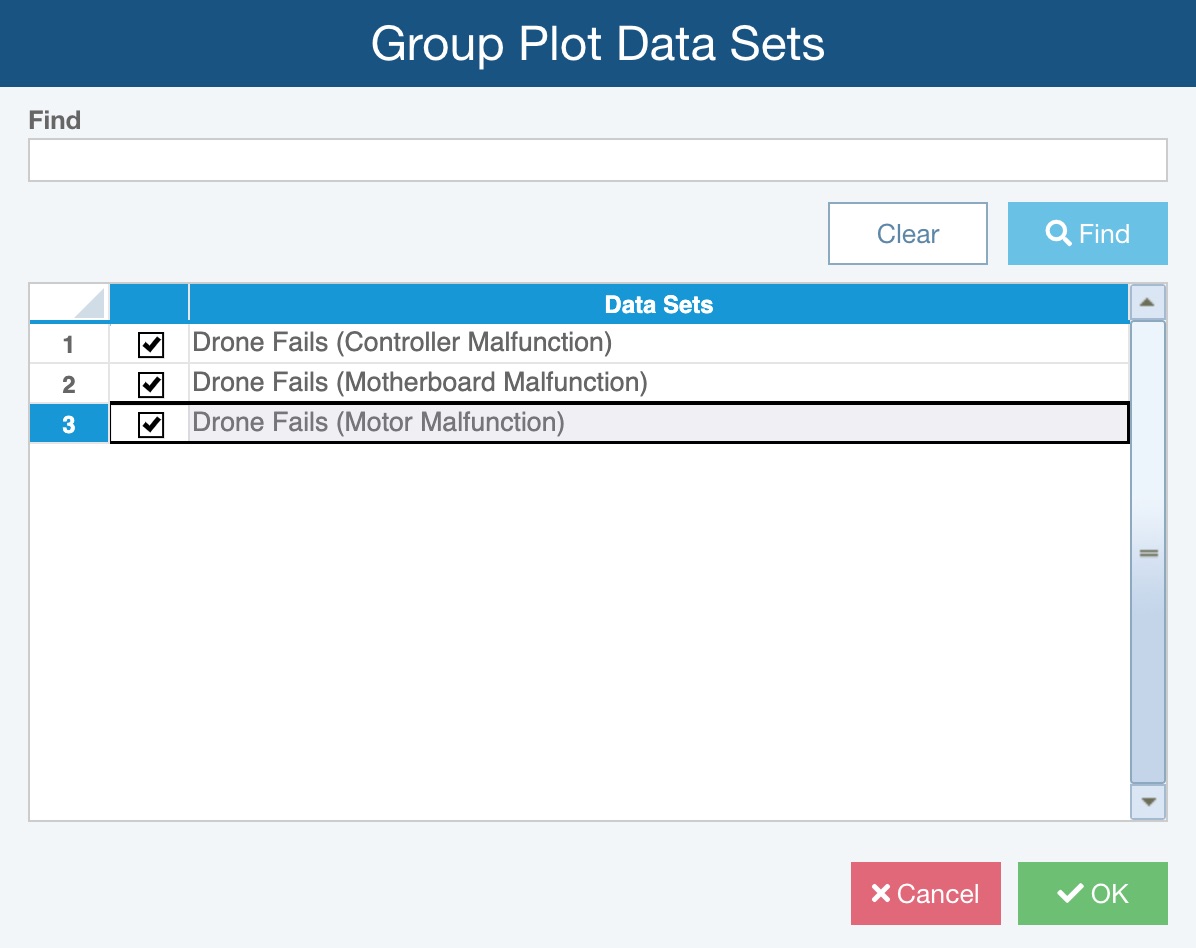
Click OK.
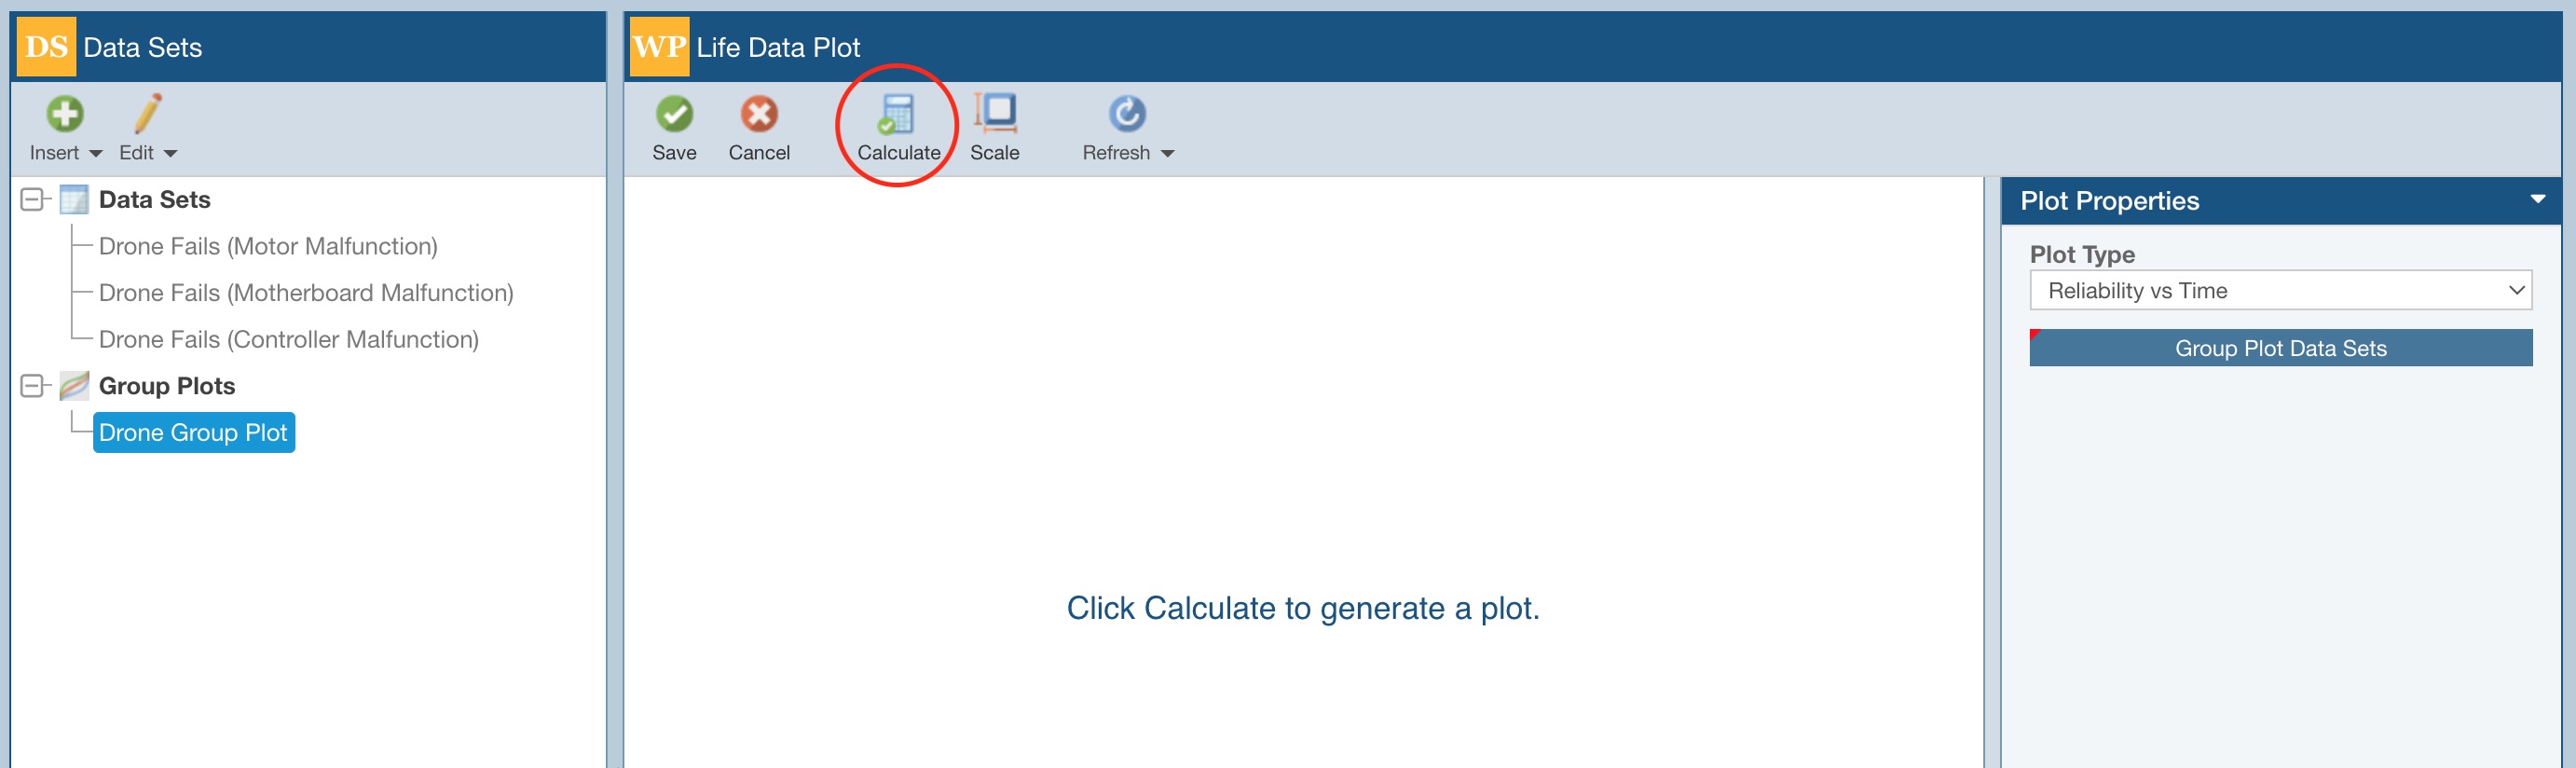
The Group Plot is added to the Data Sets pane and you are reminded to Click Calculate to generate a plot.
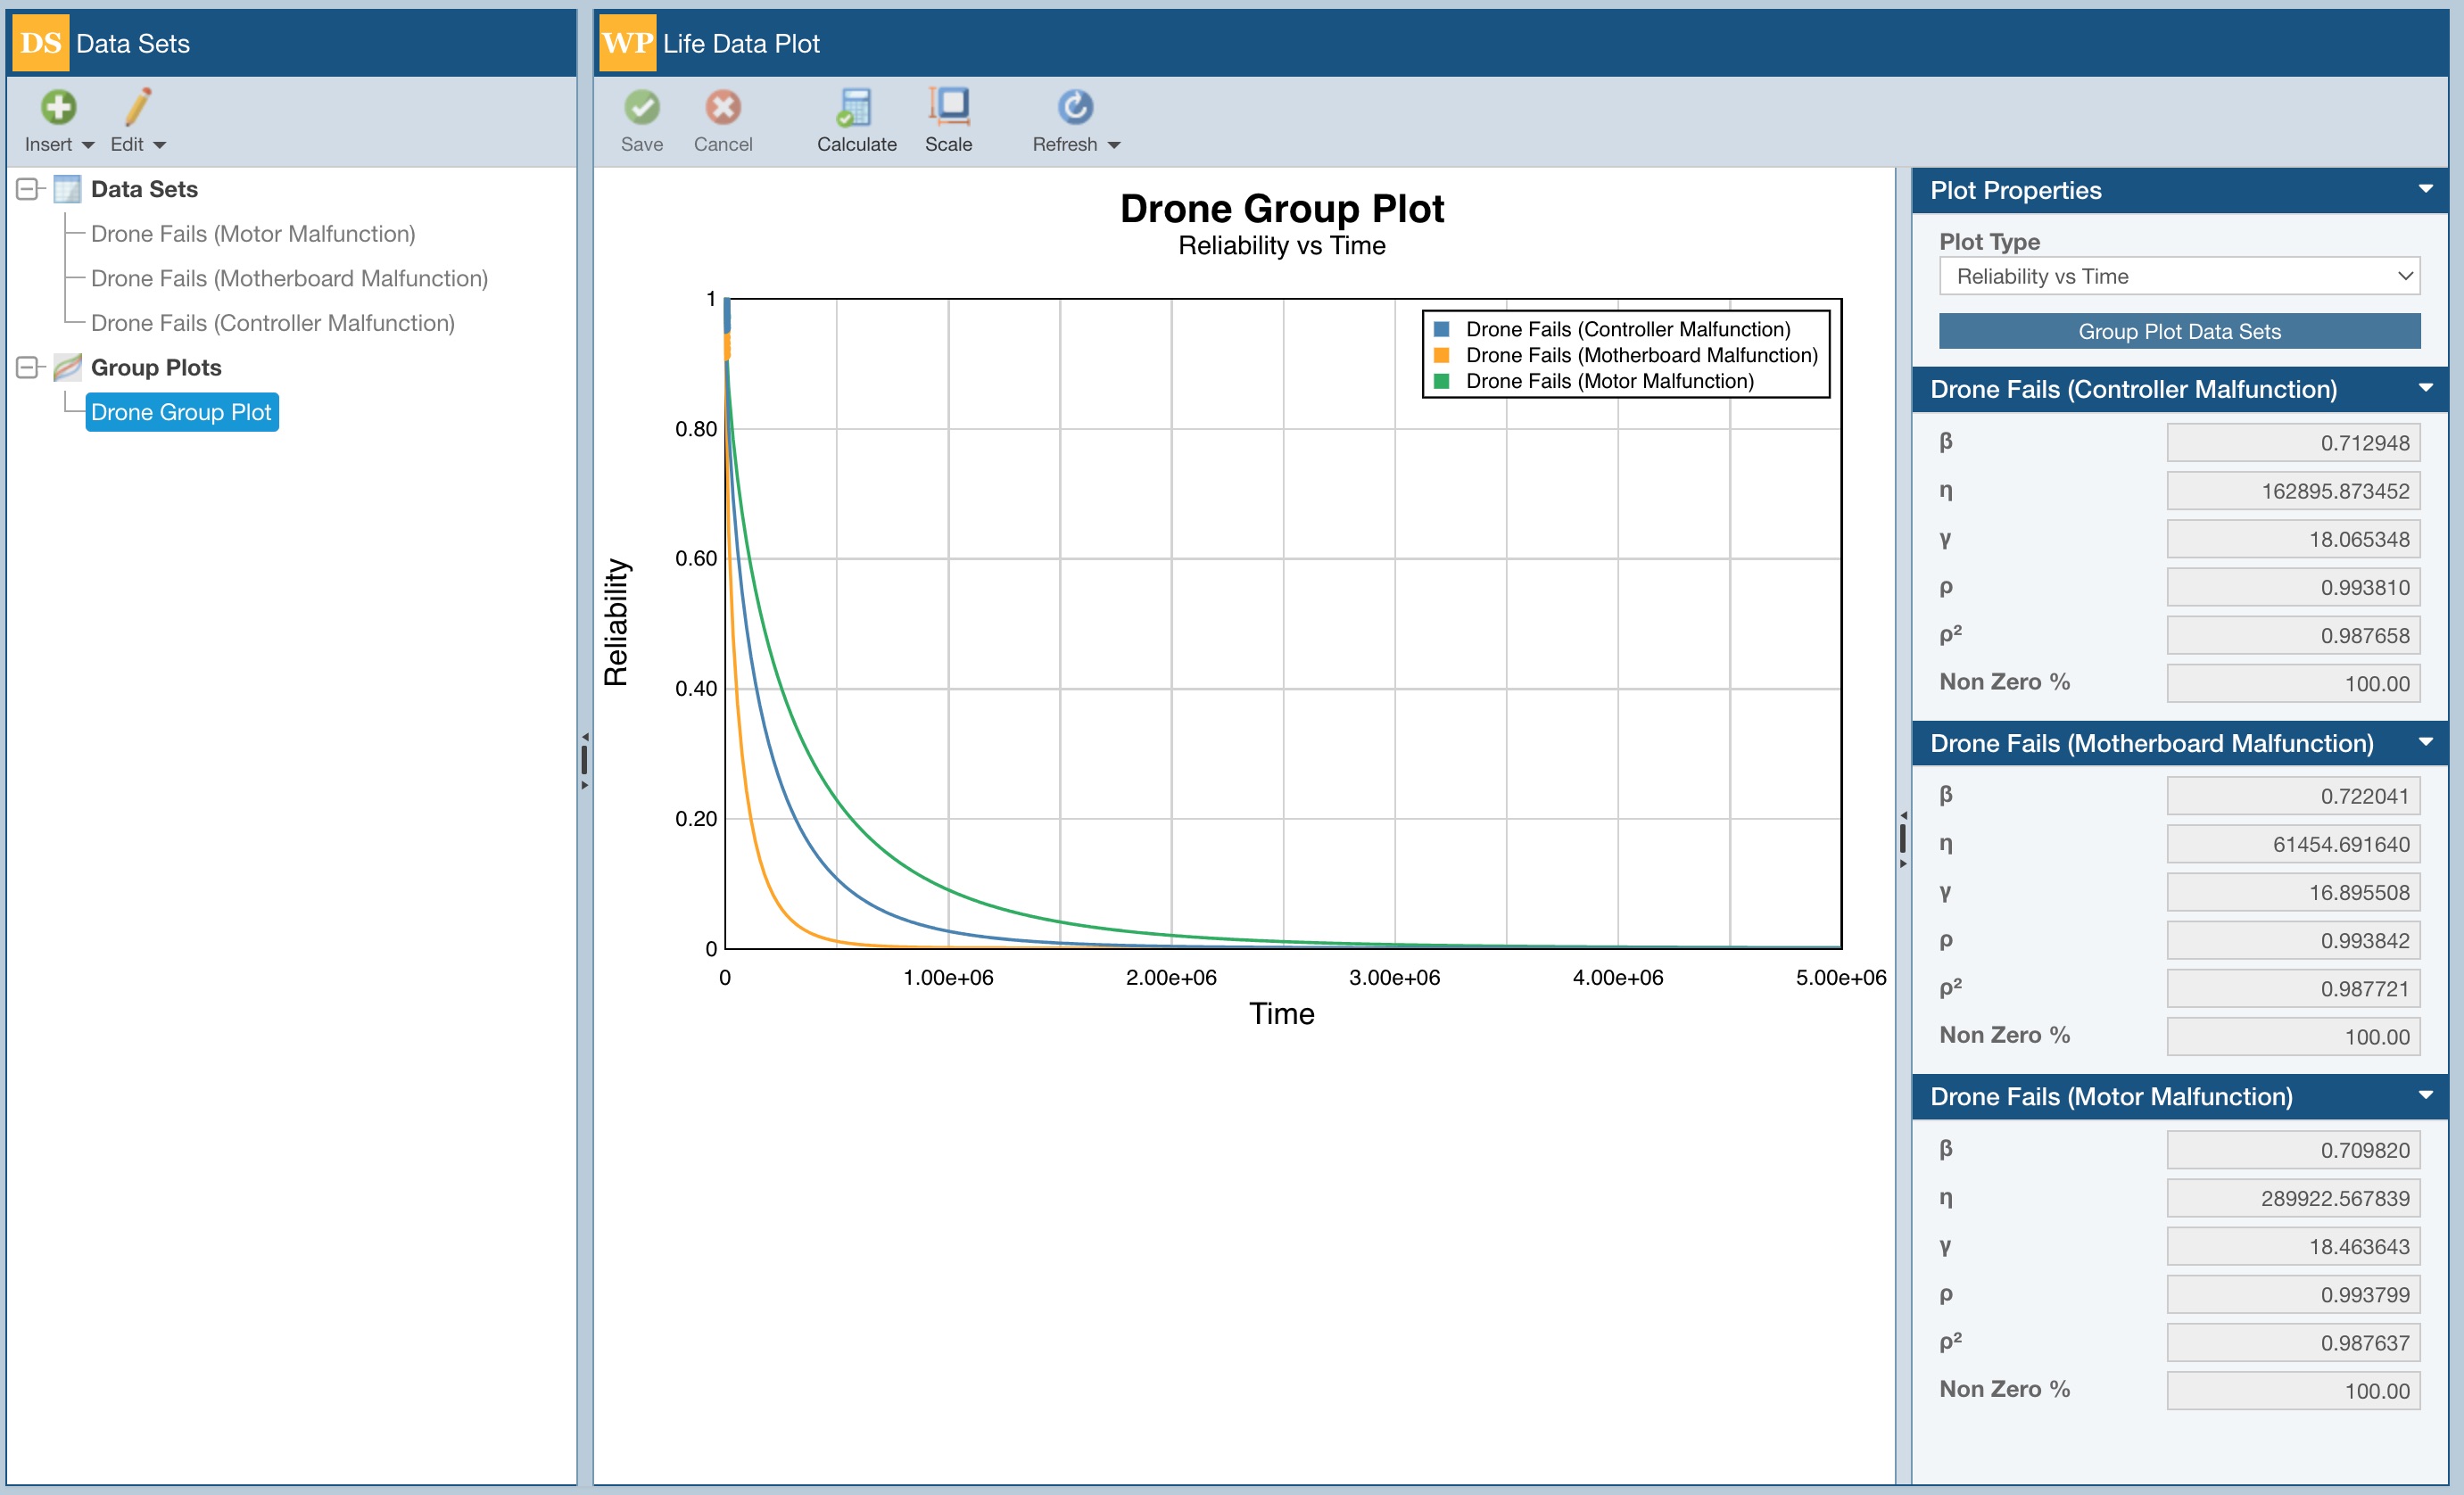
In the Life Data Plot pane, click Calculate.
The calculations are performed and the Group Plot is updated to show all selected Data Sets.
In the Life Data Plot pane toolbar, note that you can use the Scale button to configure the plot scaling, if needed.
Click Scale.
The Plot Scaling dialog appears.
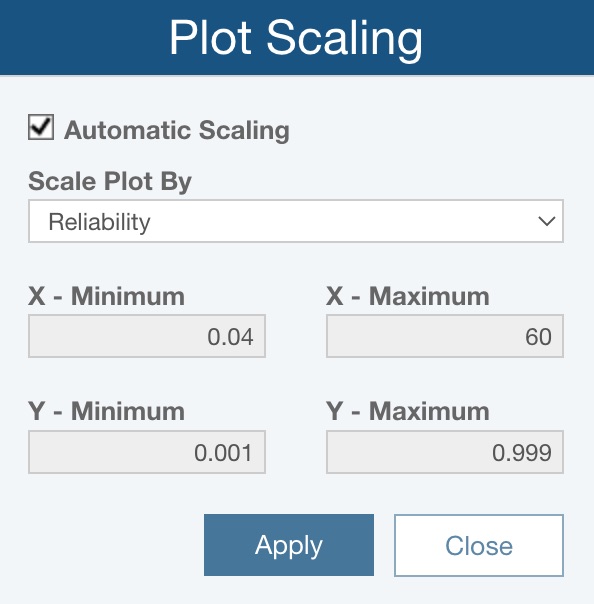
When Automatic Scaling is checked, for Scale Plot By. you can choose:
- Reliability - automatically scale based on the data points and resulting plot
- Failure and Interval Data - centers the plot around the actual failures in the data set
If you would like to scale the Plot, clear the Automatic Scaling checkbox, and enter your desired values for the X and Y axes minimum and maximum values.
Click Apply and/or Close as needed.
Note that in the right-most pane, you can assign Plot Properties, including the Plot Type.
If the Plot Type is set to Probability, you can also select the Distribution, which applies to all Life Data Sets on the Group Plot and impacts plot scaling.
You can also click the Group Plot Data Sets button to display the Group Plot Data Sets dialog and make changes to the selected Data Sets, if needed.
Note that the right-most pane also displays the calculated results for the Data Sets included on the Group Plot.
Editing and Deleting a Group Plot
In the Data Sets pane, you can select any Group Plot and use the option on the Edit button to Rename, Cut/Copy/Paste, or Delete the selected Group Plot.