Using the ALT Test Plan Feature
Accelerated life testing can be complex and expensive, so it is important to design a test strategy that helps to deliver useful results with efficiency and accuracy, while minimizing time and cost. The Relyence ALT Test Plan utility helps you to determine the appropriate accelerated testing to perform.
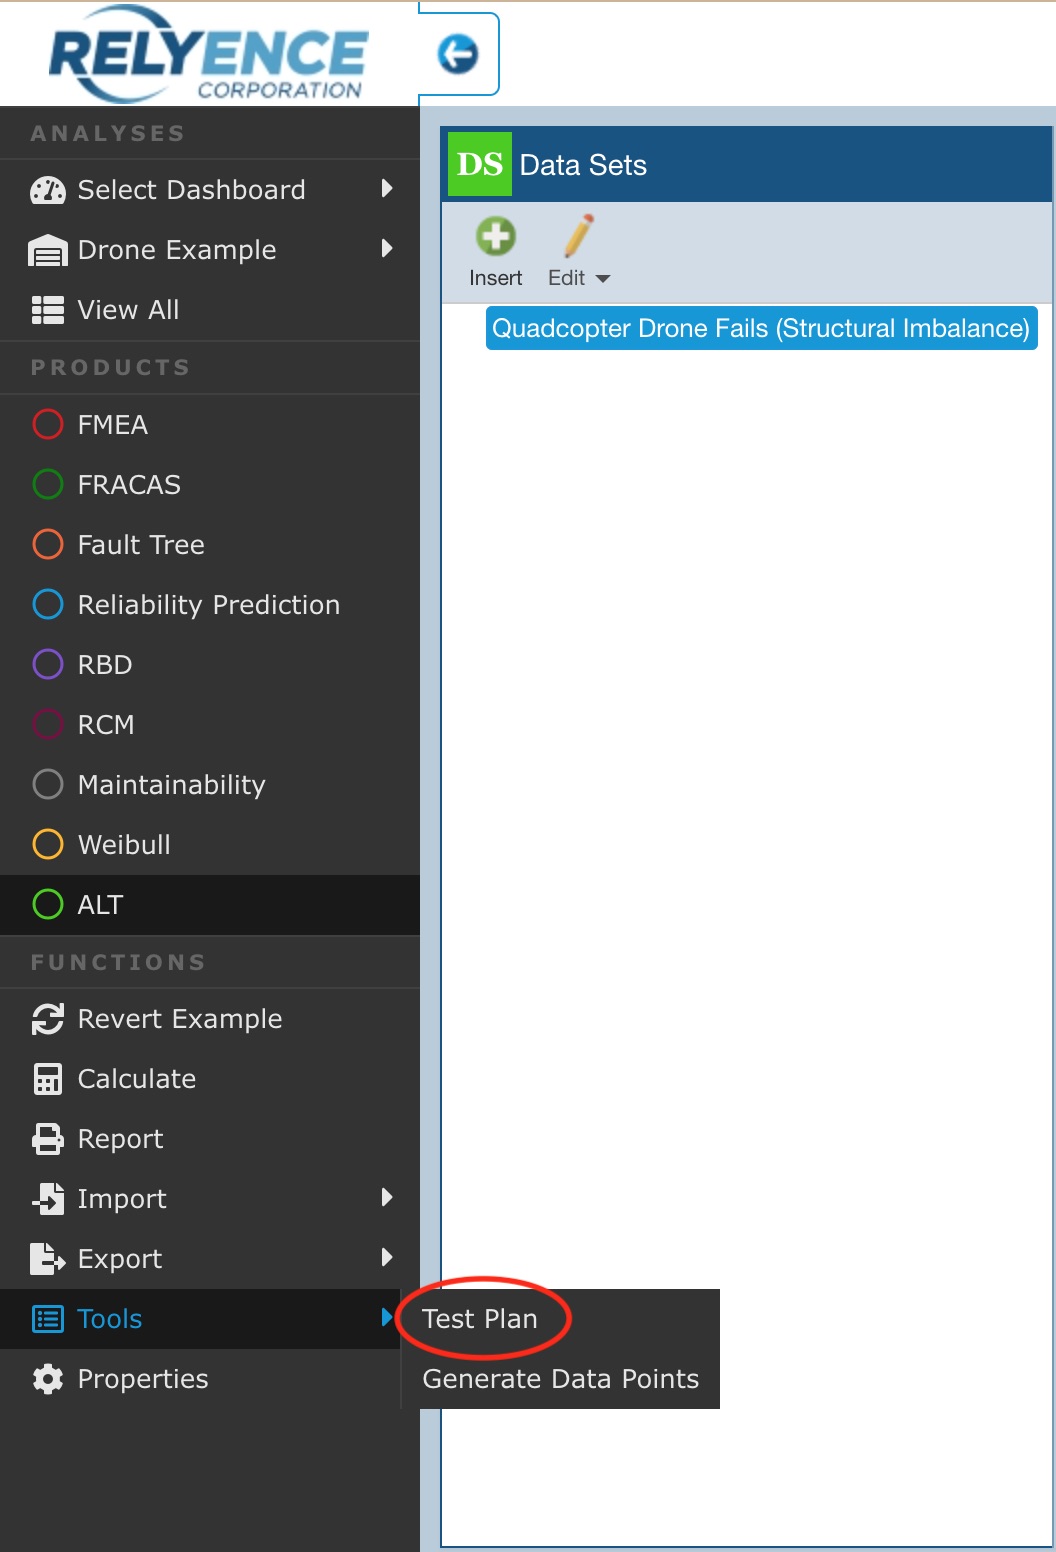
To access the ALT Test Plan feature, from the Sidebar, click Tools>Test Plan.
The Generate Test Plan dialog appears.
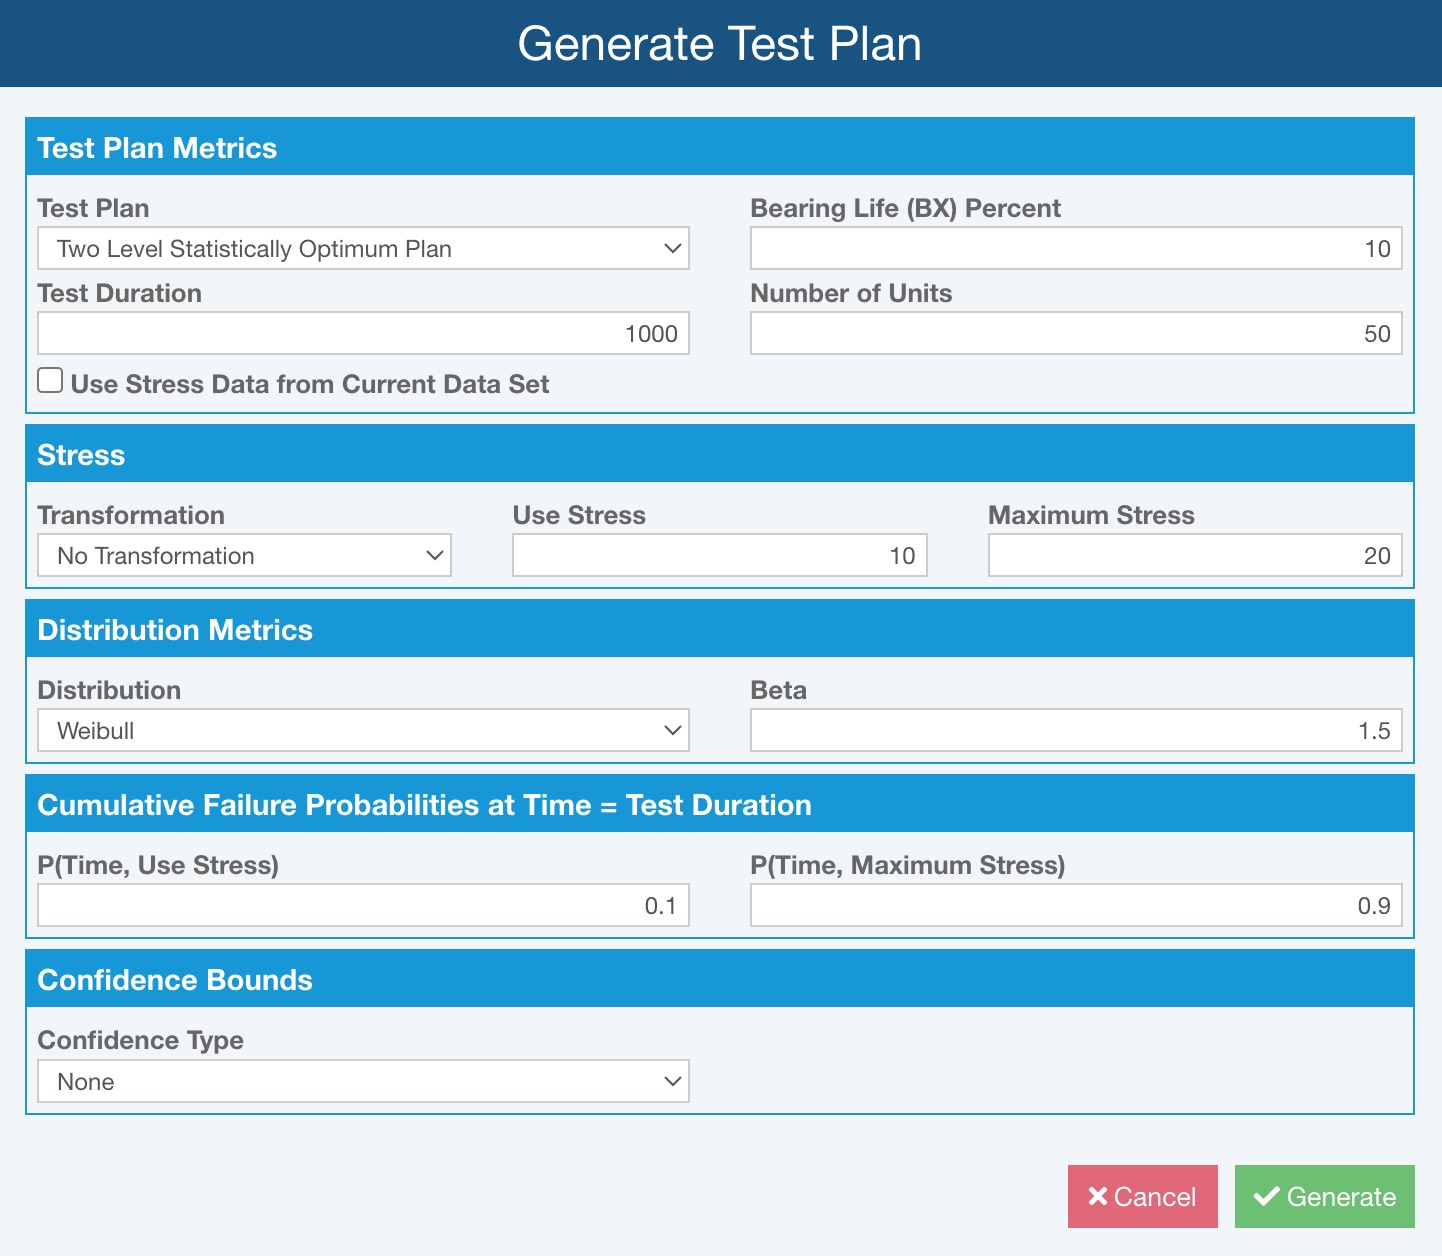
To generate a test plan, define important details in the Test Plan Metrics, Stress, Distribution Metrics, Cumulative Failure Probabilities at Time = Test Duration, and Confidence Bounds sections.
Test Plan Metrics Inputs
Test Plan
Test Plan options to determine ideal plan results.
The following options assume testing with one Stress:
- Two Level Statistically Optimum Plan - one Stress level is the Maximum Stress and the other Stress level, and the proportions (Allocation) at each level, will be calculated
- Three Level options - the highest level is the Maximum Stress, the middle level is the midpoint of the standardized low and high values, the lowest level will be calculated
- Three Level Best Standard Plan - calculates the best three stress levels given that an equal number of Units are tested at each level
- Three Level Best Compromise Plan - calculates the best three stress levels where the user determines how many Units should be tested at the middle stress level
- Three Level Best Equal Expected Number Failing Plan - calculates the best three stress levels, such that an equal number of failures is expected at each level
- Three Level 4:2:1 Allocation Plan - calculates the best three stress levels such that 4/7 of the Units are tested at the lowest stress level, 2/7 of the Units are tested at the middle level, and 1/7 of the Units are tested at the highest stress level
The following options assume testing with two Stresses:
- Three Level Optimum Plan - results are obtained by taking a degenerate Two Level Optimum solution and splitting the lowest stress level into two separate levels
- Five Level Best Compromise Plan - results are obtained by taking a degenerate Three Level Compromise with 0.2 set as the proportion of units at the middle stress level; then the low and middle stress levels are each split into two separate levels
Bearing Life (BX) Percent
Percent value represents the time at which X% of the population will have failed.
Test Duration
Duration of the test in hours.
Number of Units
Number of units available for accelerated life testing.
Unit Proportion at Middle Stress Level (Three Level Best Compromise Plan only)
The unit proportion for the middle stress level.
A proportion less than or equal to 0.2 is recommended.
Low Stress Reduction Factor (Three Level 4:2:1 Allocation Plan only)
The low stress reduction factor.
This is a value between 0 and 1; 0 indicates the low stress level is reduced to the Use Stress; 1 indicates that no reduction of the low stress level is done.
Use Stress Data from Current Data Set
When checked, the Stress inputs and Distribution Metrics inputs for the currently selected Data Set are used.
Stress Inputs
Transformation
The Transformation field allows you to define the model used to transform the stress data. Choices are: No Transformation, Logarithmic, and Reciprocal.
Use Stress
The typical stress under normal usage conditions.
Maximum Stress
The maximum stress during accelerated testing.
Note: If using Test Plan Three Level Optimum Plan or Five Level Best Compromise Plan, you can enter two sets of Stress values via Stress 1 and Stress 2.
Distribution Metrics Inputs
Distribution
Presumed failure distribution for the test data.
Additional input varies with Distribution selection. For Weibull, enter Beta. For Lognormal, enter Sigma. No additional input is required for Exponential and Rayleigh.
Cumulative Failure Probabilities at Time = Test Duration Inputs
P(Time, Use Stress) and P(Time, Maximum Stress) define the cumulative failure probability when the Time = the Test Duration, assuming the Use Stress value and Maximum Stress value.
Confidence Bounds Inputs
In the Confidence Bounds section, choose the desired Confidence Type of None, Lower Confidence, Upper Confidence, Double Confidence or Upper and Lower Confidence and then enter the requested Confidence Level.
If a Confidence Type other than None is selected, the confidence bounds results will be included on the Test Plan Results dialog.
Click Generate.
Note that the Test Plan Results are calculated given the Bearing Life (BX) Percent and the constraints of the specific Test Plan to determine optimal stress levels and proportions at each stress level by minimizing the variance of the Bearing Life.
The Test Plan Results dialog appears.
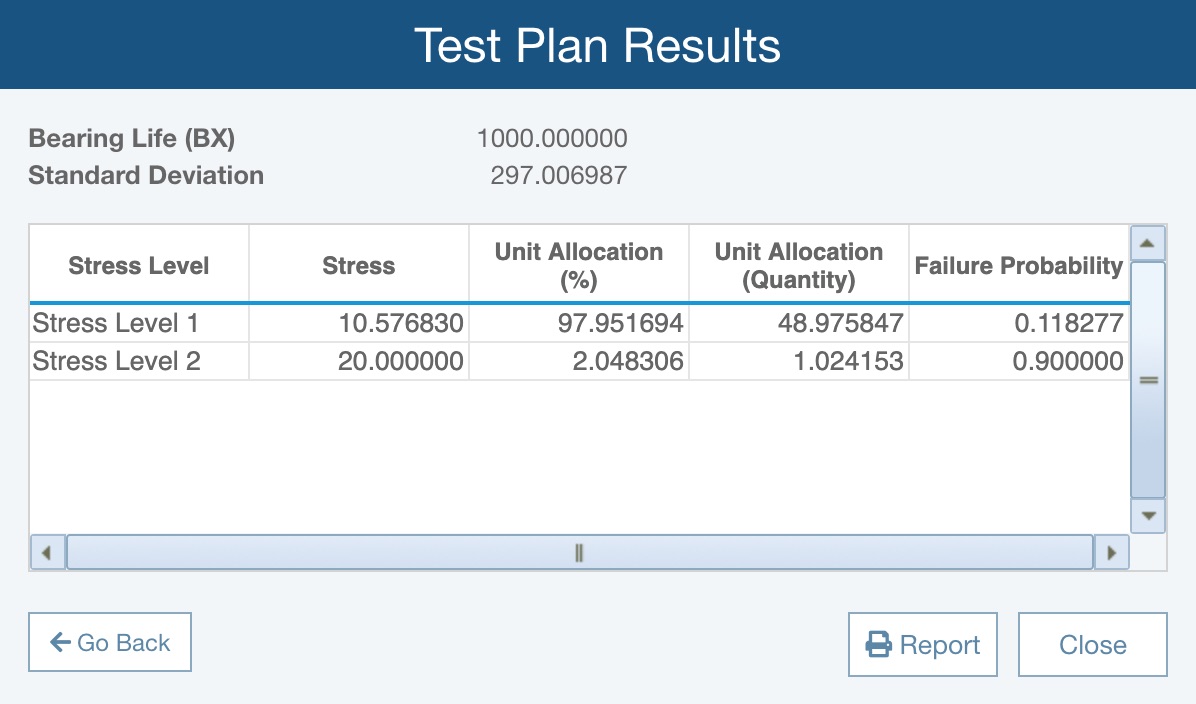
The Test Plan Results dialog reports the Bearing Life (BX) and Standard Deviation results, along with a table confirming test planning details such as the number of units (Unit Allocation (Quantity)) per stress level.
On the Test Plan Results dialog, you can also use the following buttons:
Go Back - to return to the Generate Test Plan dialog.
Report - to display the Report Options dialog, define a Report Title, and view the ALT Test Plan report on a separate browser tab
Close - to close the dialog and return to the open Analysis.