Using the Fault Tree Table
By default, when an Analysis is opened with Fault Tree as the selected Product, the Fault Tree Diagram is displayed.
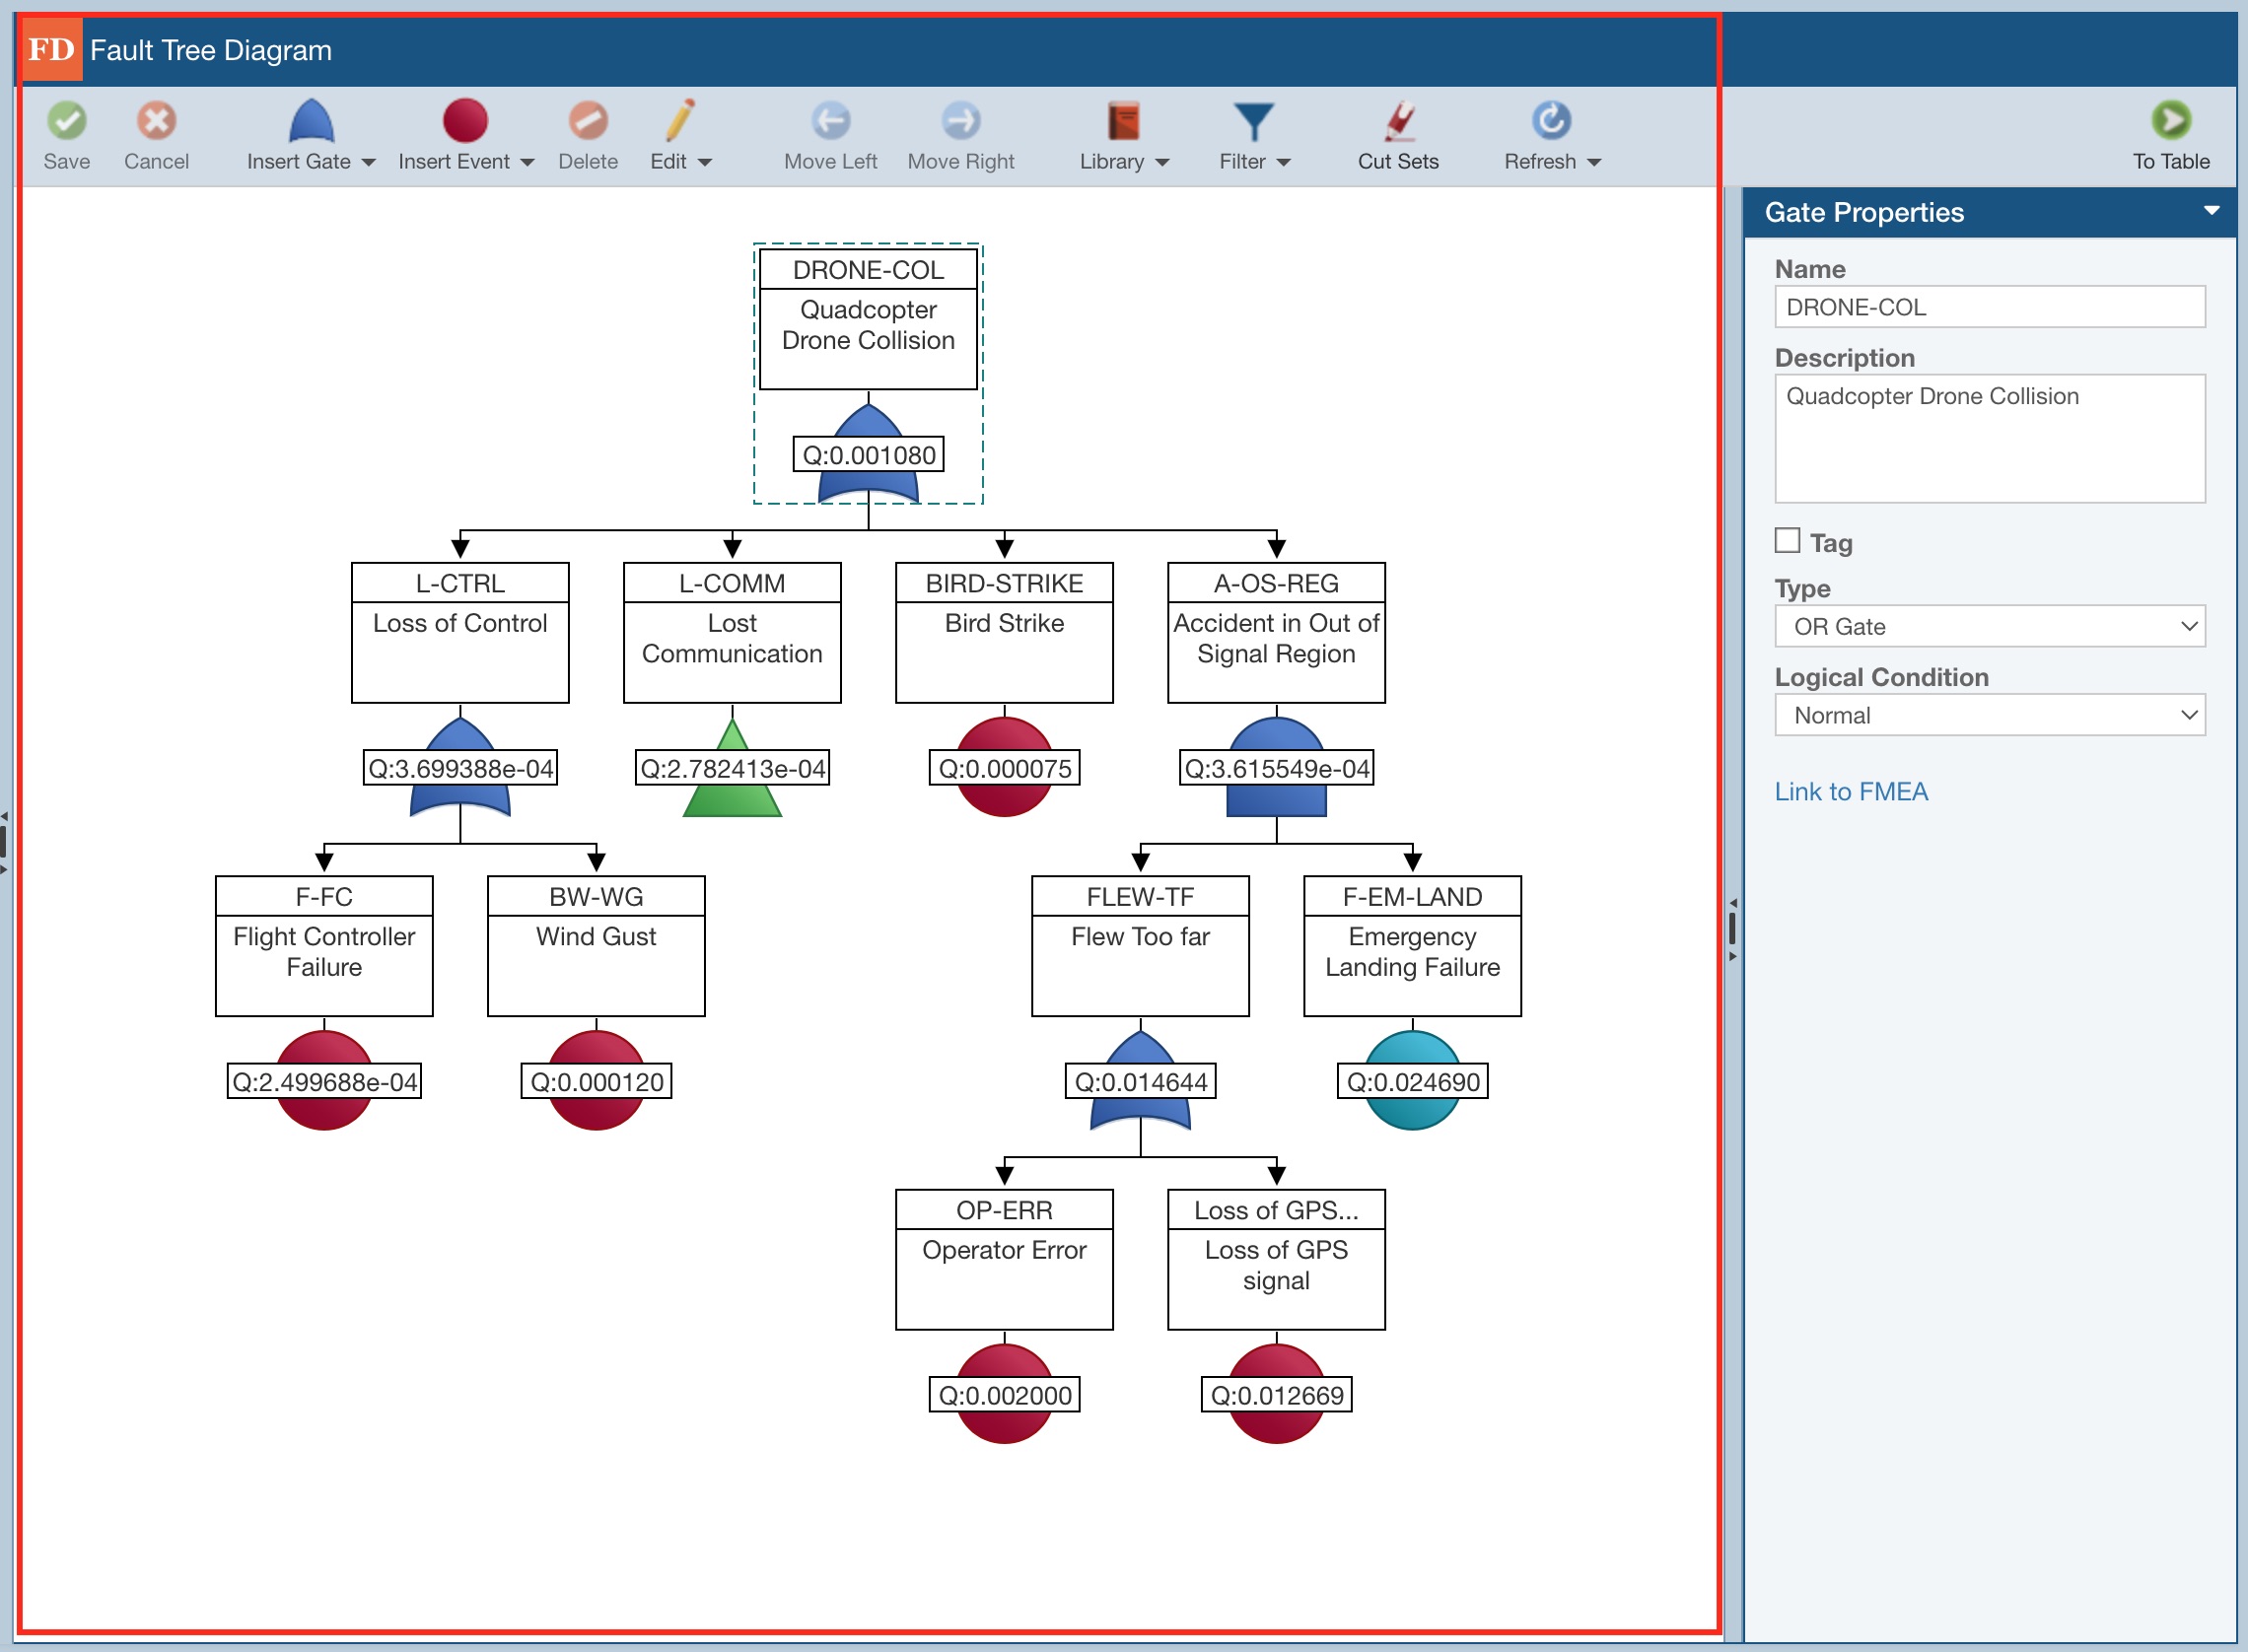
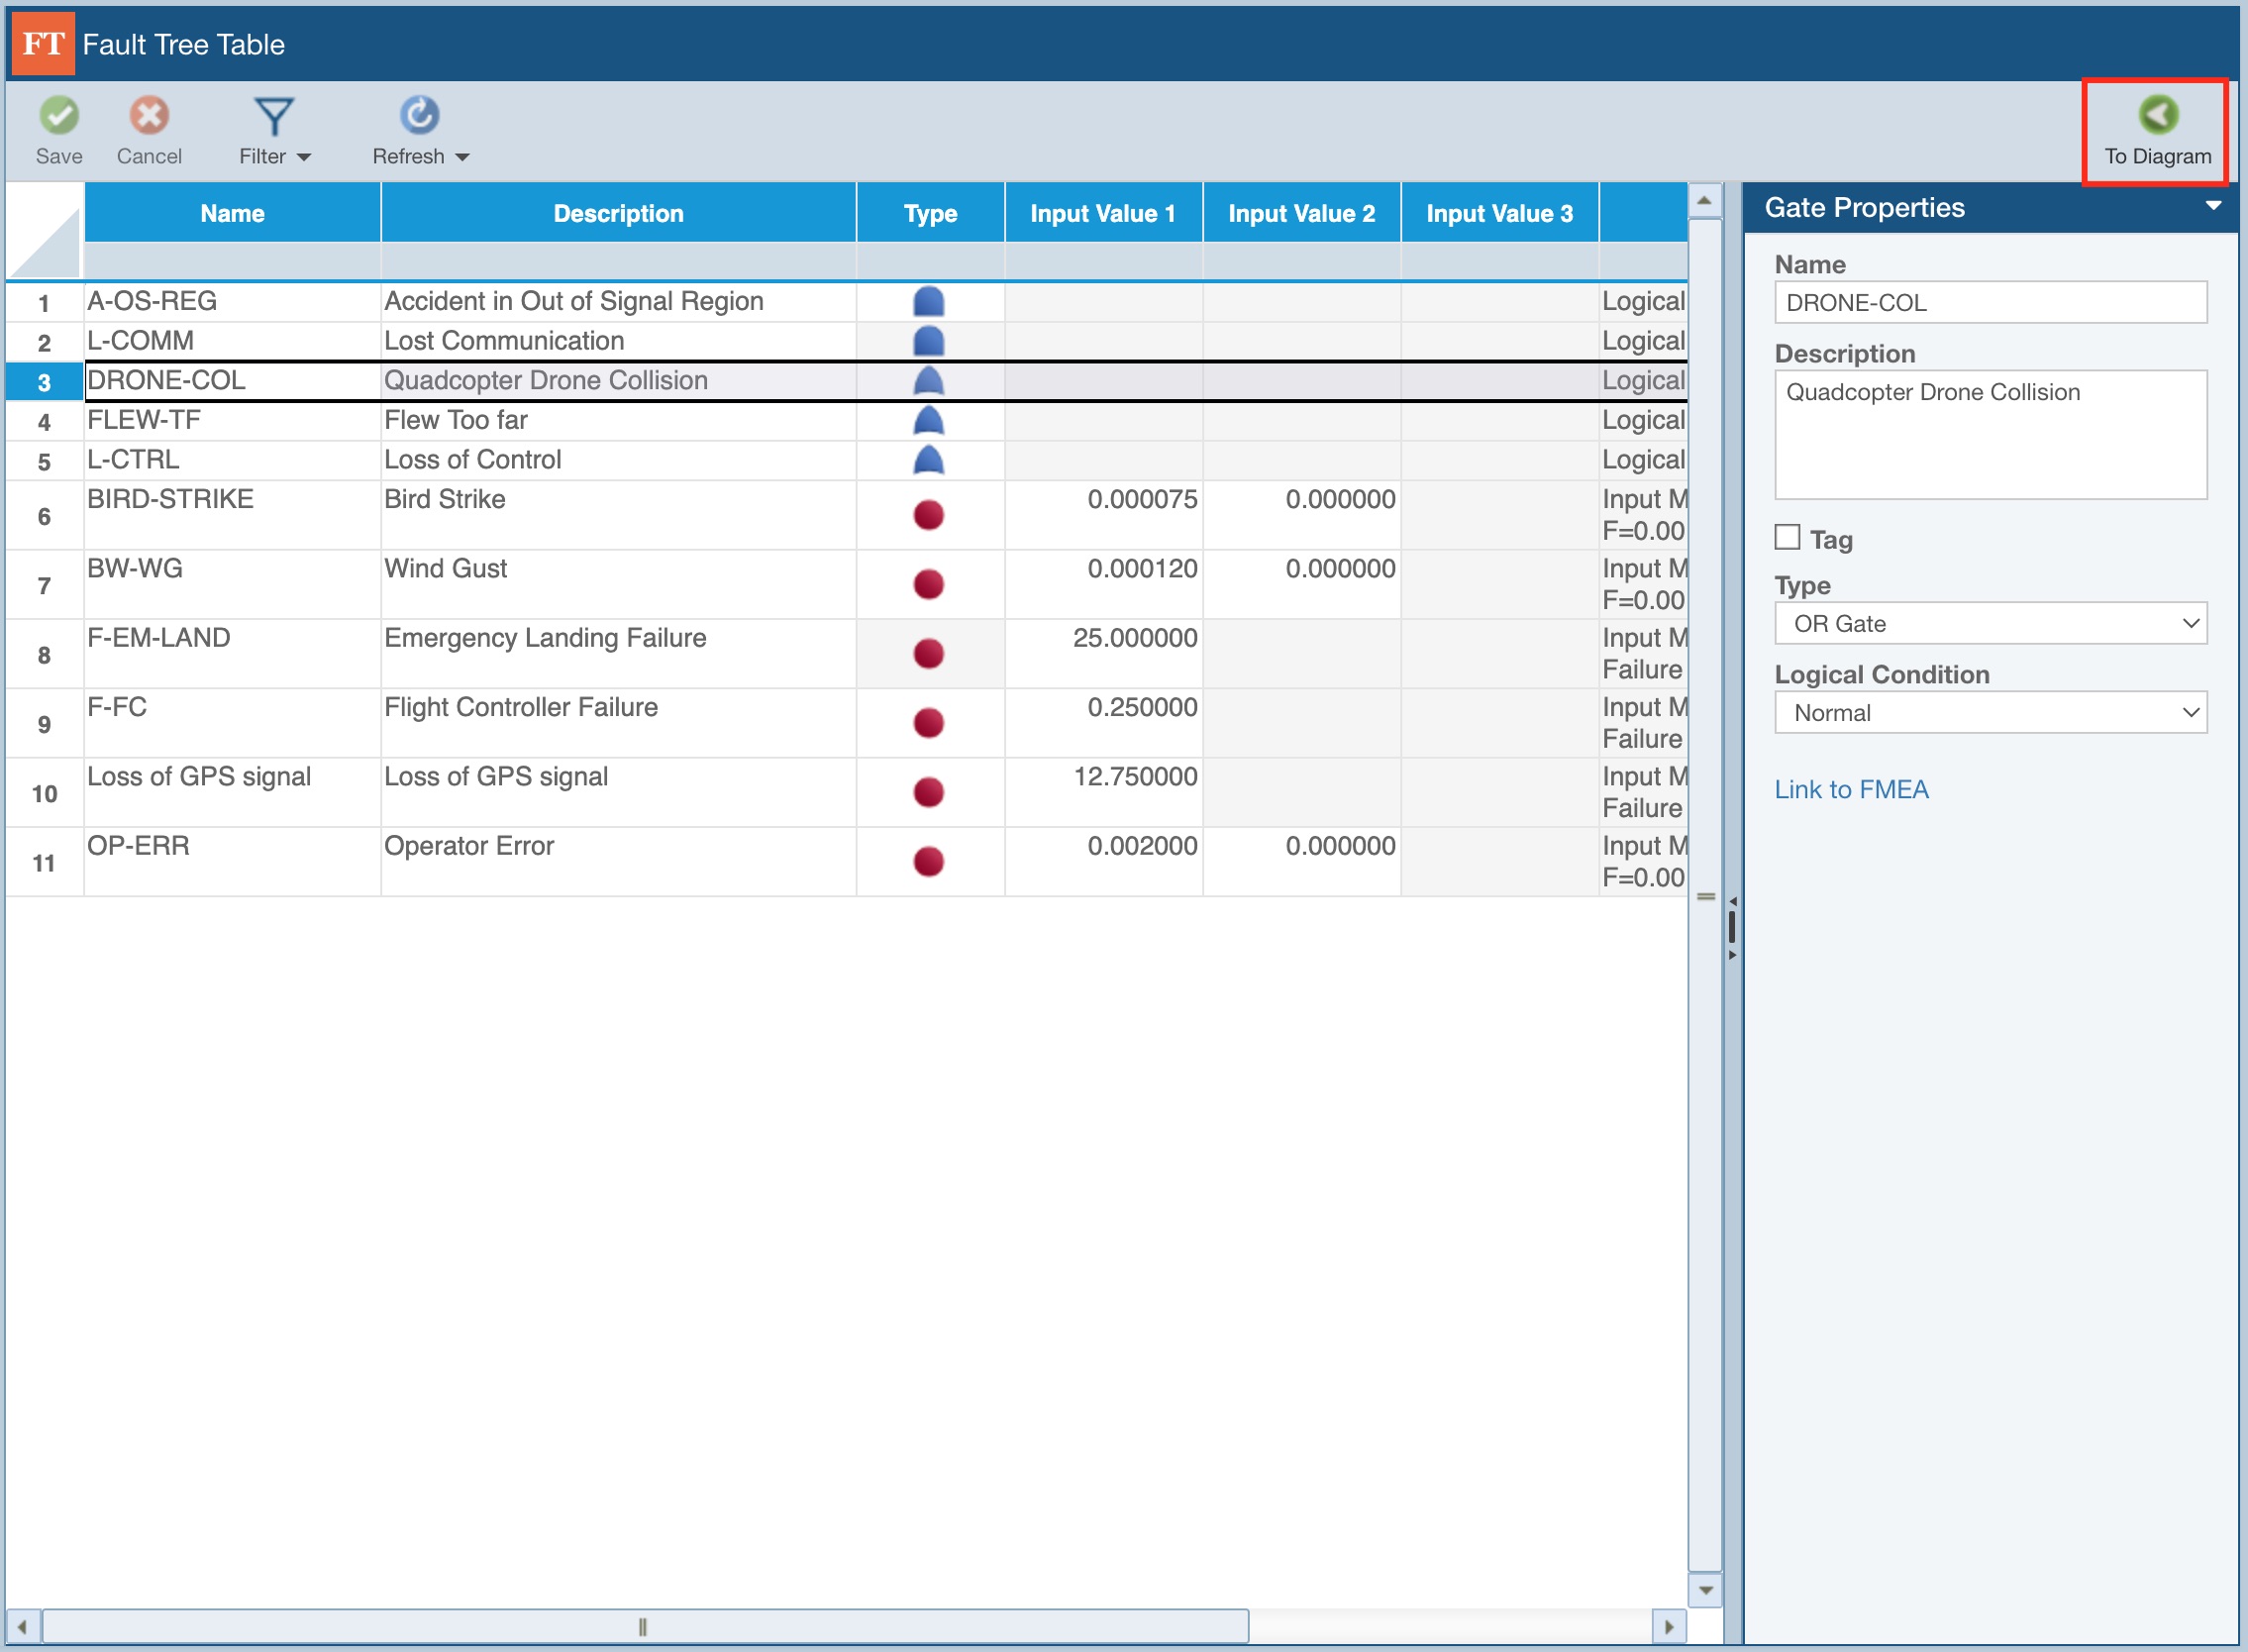
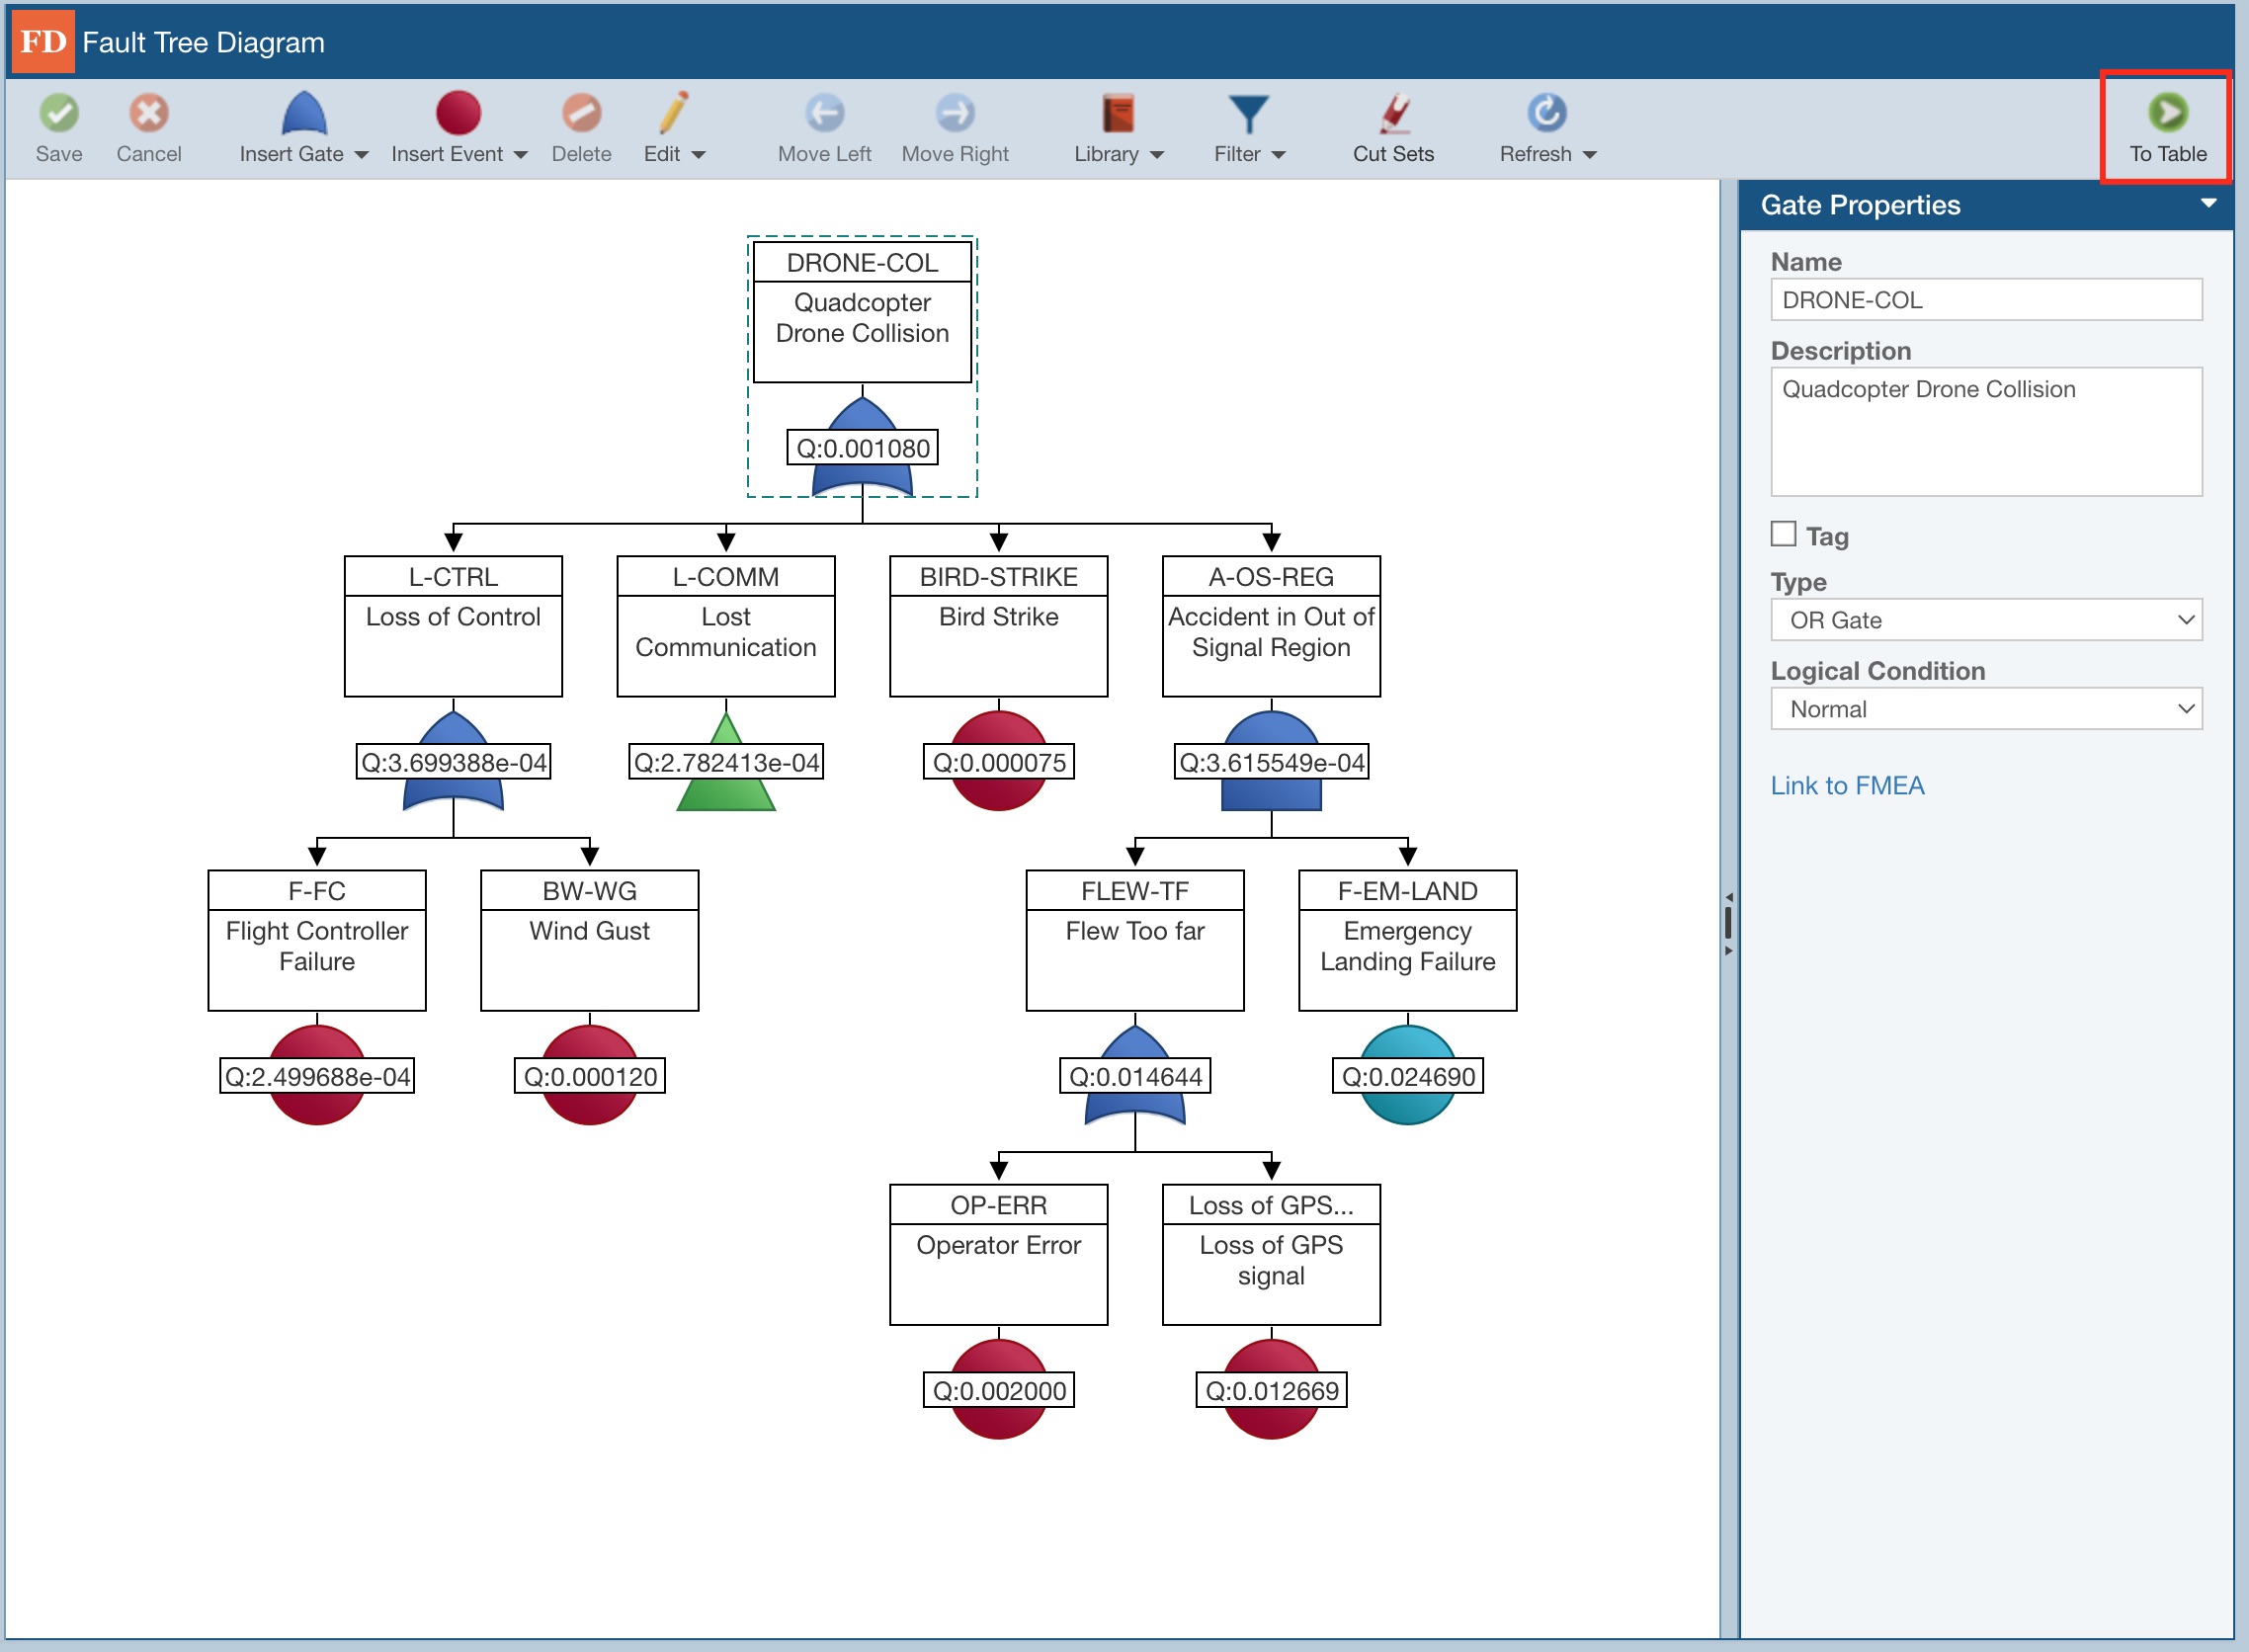
You can see the Fault Tree data for the selected Fault Tree in a table form by clicking To Table.
The term "Table" is used to designate views where the data appears in a Table, or spreadsheet-like, format.

A predefined set of fields, including Name, Description, Type and others, are displayed for each Fault Tree Gate and Event. Note that this can include up to 5 user text fields configurable in the Fault Tree Properties.
You can also select any Gate or Event in the Fault Tree Table and review the Properties pane on the right.
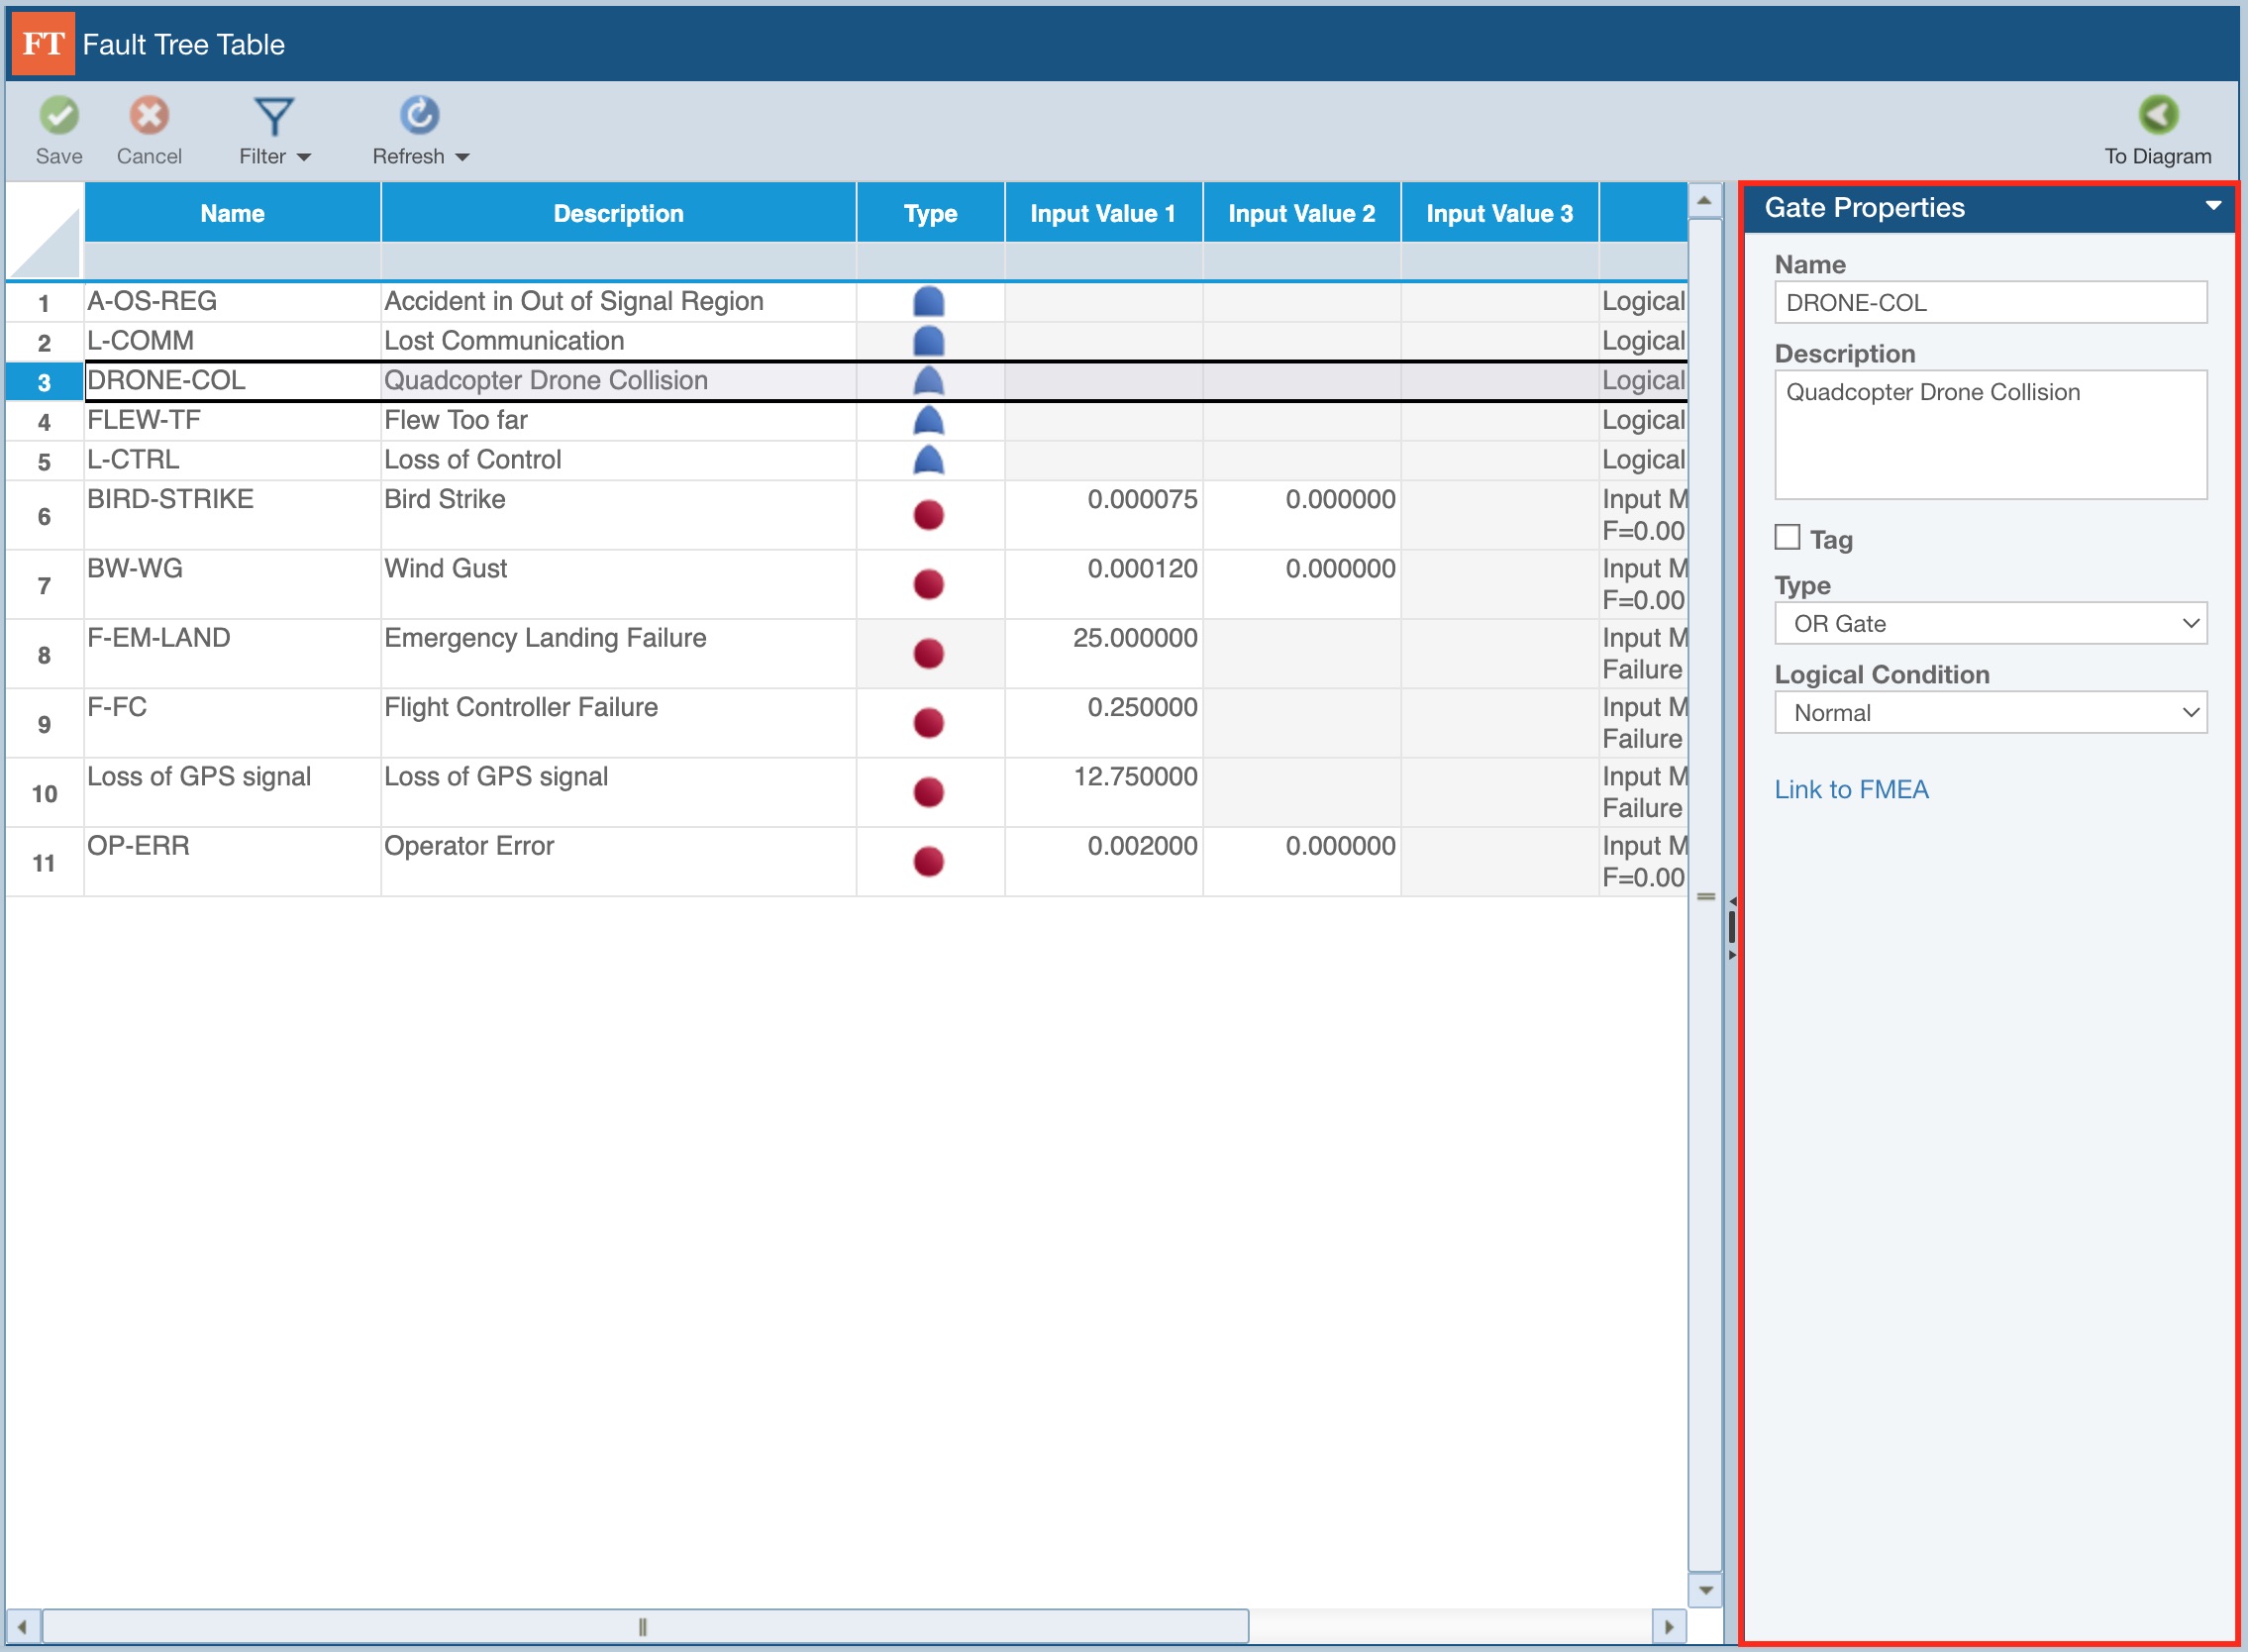
Changes made in the Fault Tree Table can be saved using the Save button in the toolbar.
You can also search for Gates and Events of interest using the Filter button in the toolbar.
You can use the Refresh button to update the Fault Tree Table.
If you wish to generate a report of the data displayed on the Fault Tree Table, from the Sidebar, click Report. The Report Options dialog appears. Define the Report title, which Fault Trees to include and click Report. A tabular report is generated to an Excel format (.xlsx) downloaded to your default downloads directory, where a worksheet is created for each Gate in the fault tree; Names of Transfer Gates will appear as links and when clicked navigate to the worksheet for the Transfer gate.
To return to the Fault Tree Diagram graphical view, click To Diagram.