Generating RBD Plots
When working in Relyence RBD, on the RBD Plot tab, you can create plots for your RBD results and other details.
On the RBD Plot tab, for the RBD selected in the All RBDs pane, you can review various Plot Types, for which you set your preferred calculation settings, and also calculate additional metrics via the Analytics calculator.
.png)
The large pane on the left side of the RBD Plot tab will show the Plot Type selected in the properties pane on the right.
In addition to displaying the selected RBD Plot, you can also utilize various toolbar options, including:
- Save - save changes made to the RBD Plot pane and related properties
- Cancel - cancel any outstanding changes made to the RBD Plot and related properties
- Calculate - update the RBD Plot based on current properties settings
- Analytics - determine various results based on the selected RBD; see Using the RBD Analytics Calculator for details about the RBD Analytics calculator
- Scale - change the default scaling for the x and y axes on the RBD Plot
- Refresh - update the RBD Plot pane
In the smaller pane on the right side of the RBD Plot tab, you can set various parameters for the RBD Plot, including details related to:
- Plot Properties
- Time-Based Settings
- Simulation
- Results
In the Plot Properties section, supported Plot Types include:
- Availability vs Time - plots Availability vs Time where Availability is the probability that the system is operating when repairs are taken into account
- Failure Rate vs Time - plots Failure Rate vs Time where Failure Rate is the rate that the system fails, given that it is currently operating, when no repairs are made
- Hazard Rate vs Time - plots Hazard Rate vs Time where Hazard Rate is the rate that the system fails, given that it is currently operating, when repairs are taken into account
- Number of Failures vs Time - plots Number of Failures vs Time where Number of Failures is the expected number of failures within the time interval from 0 to End time.; the number of failures is calculated based on the Failure Frequency
- PDF Plot - Probability Density Function plot which plots f(t), or the Probability Density Function vs Time
- Reliability vs Time - plots Reliability vs Time where Reliability is the probability that the system has not failed when no repairs are made
- Simulation Convergence - the Convergence values shown on the Simulation Convergence plot are a rolling average of each iteration's calculated End Time Availability value. This plot can be used to estimate how many iterations should be run for a given RBD in order to achieve more accurate results. As the Simulation Convergence plot line approaches the zero axis, the given number of iterations at that point indicates results stability. A high simulation iteration ensures result stability, but can lead to a lengthy calculation time, especially for complex RBD models. Therefore, this plot is useful to enable you to determine an optimal iteration count for your RBD calculations.
- Total Downtime vs Time - plots Total Downtime vs Time where Total Downtime is the cumulative total of the time the system has been in a failed state
- Unavailability vs Time - plots Unavailability vs Time where Unavailability is the probability that the system is not operating when repairs are taken into account
- Unreliability vs Time - plots Unreliability vs Time where Unreliability is the probability that the system has failed when no repairs are made
For Plot Types Availability vs. Time, Reliability vs Time, Unavailability vs. Time, and Unreliability vs. Time, the Plot Properties section will also include options for confidence bounds, including:
- Confidence Type - this allows you to add confidence bound lines to your select RBD Plots; you can select from None, Lower Confidence, Upper Confidence, Double Confidence, or Upper and Lower Confidence; the Relyence default setting is None.
- Confidence Level - this allows you to set the percentage you want to use when calculating confidence bounds; you can enter a value from 1-100; the Relyence default setting is 90.
In the Time-Based Settings section, you can specify:
- End time
- Number of display steps
Note that the Time-Based Settings are used when the RBD Plots results are calculated by Simulation.
In the Simulation section, you can specify:
- Always use simulation - if possible, Relyence will use an analytical (non-simulated) calculation method to obtain exact results; if you prefer to always use the simulator engine for your RBD Plot calculations, select this checkbox
- Number of iterations - the number of iterations for the simulator to run. Increasing the number of simulations increases the accuracy of the results, up to a point, but also increases computational time
- Number of failures to reach steady state - sets the number of failures components can experience before considered to have reached steady state; by default, this is set to 1
- Set random number seed - select this checkbox and enter the random number seed if you wish to specify the random number seed for the simulator engine; by specifying the random number seed, Relyence RBD will return the same calculated results from simulation from one calculation run to another, provided no input values have changed, otherwise, Relyence will obtain a random number seed
- Use plot smoothing - (Plot Types Failure Rate vs Time, Hazard Rate, PDF Plot only) - select this checkbox to see a smoother plot line for plots that show more volatile results from simulation; applies Savitzky-Golay method
Note that the Simulation fields will be the same as those set on the Calculate RBD dialog for the selected RBD.
In the Results section, you can see details such as the resulting Value, End time, and Calculation Method.
Generating an RBD Plot Report
To generate a report of the selected RBD Plot, from the RBD Plot pane, click Report from the Sidebar.
The Report Options dialog appears.
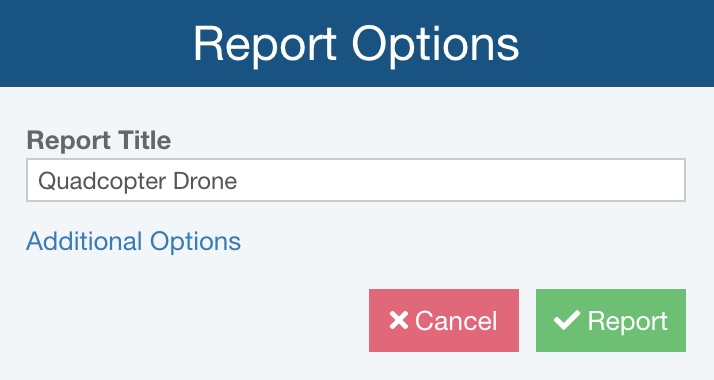
You can enter the Report Title for your report.
If needed, click Additional Options to see additional reporting options.
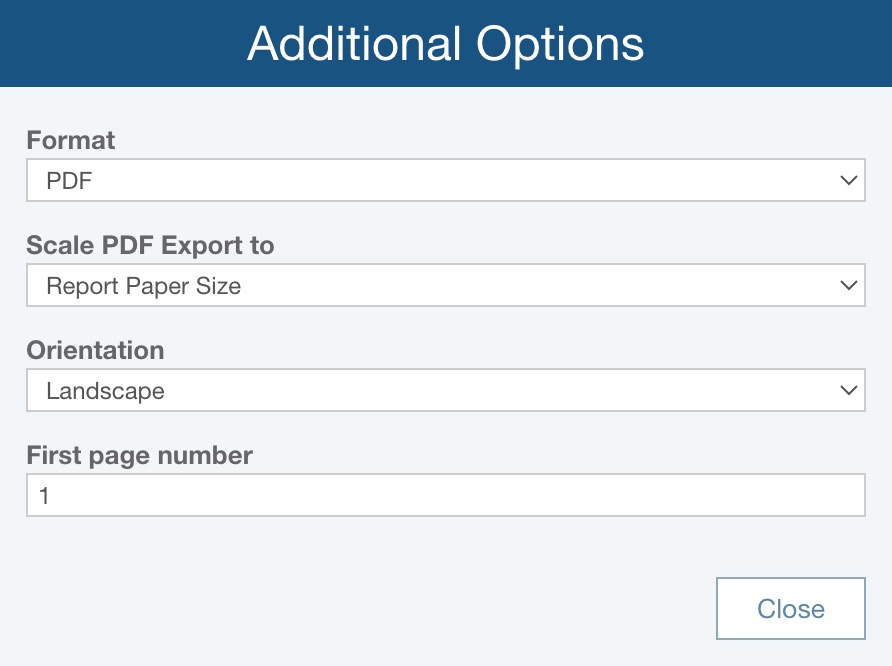
For Format, select from PDF, BMP, JPG, PNG, SVG.
If Format = PDF, for Scale PDF Export to, choose:
- Report Paper Size - if the RBD Plot is exported to PDF, it will be scaled based on the Report Paper Size, set via Settings
- Diagram Size - if the RBD Plot is exported to PDF, it will be scaled based on the size of the RBD
If Format = PDF, for Orientation, choose:
- Portrait - the report page will be set so it is taller than it is wider
- Landscape - the report page will be set so it is wider than it is tall
If Format = PDF, for First page number, enter the desired first page number for the RBD plot report; this can be helpful if the report will be a specific set of page numbers in a larger deliverable.
Click Close to return to the Report Options dialog.
Click Report to generate the report. It will be saved to the default downloads location in the selected format. A sample PDF report is shown below.
%20-%20Report.png)