Relyence Data Entry Elements
Various data entry elements are used throughout this guide, so it is good to become familiar with the terminology used in Relyence. The data entry elements include:
- Tables
- Forms
- Trees
- Diagrams
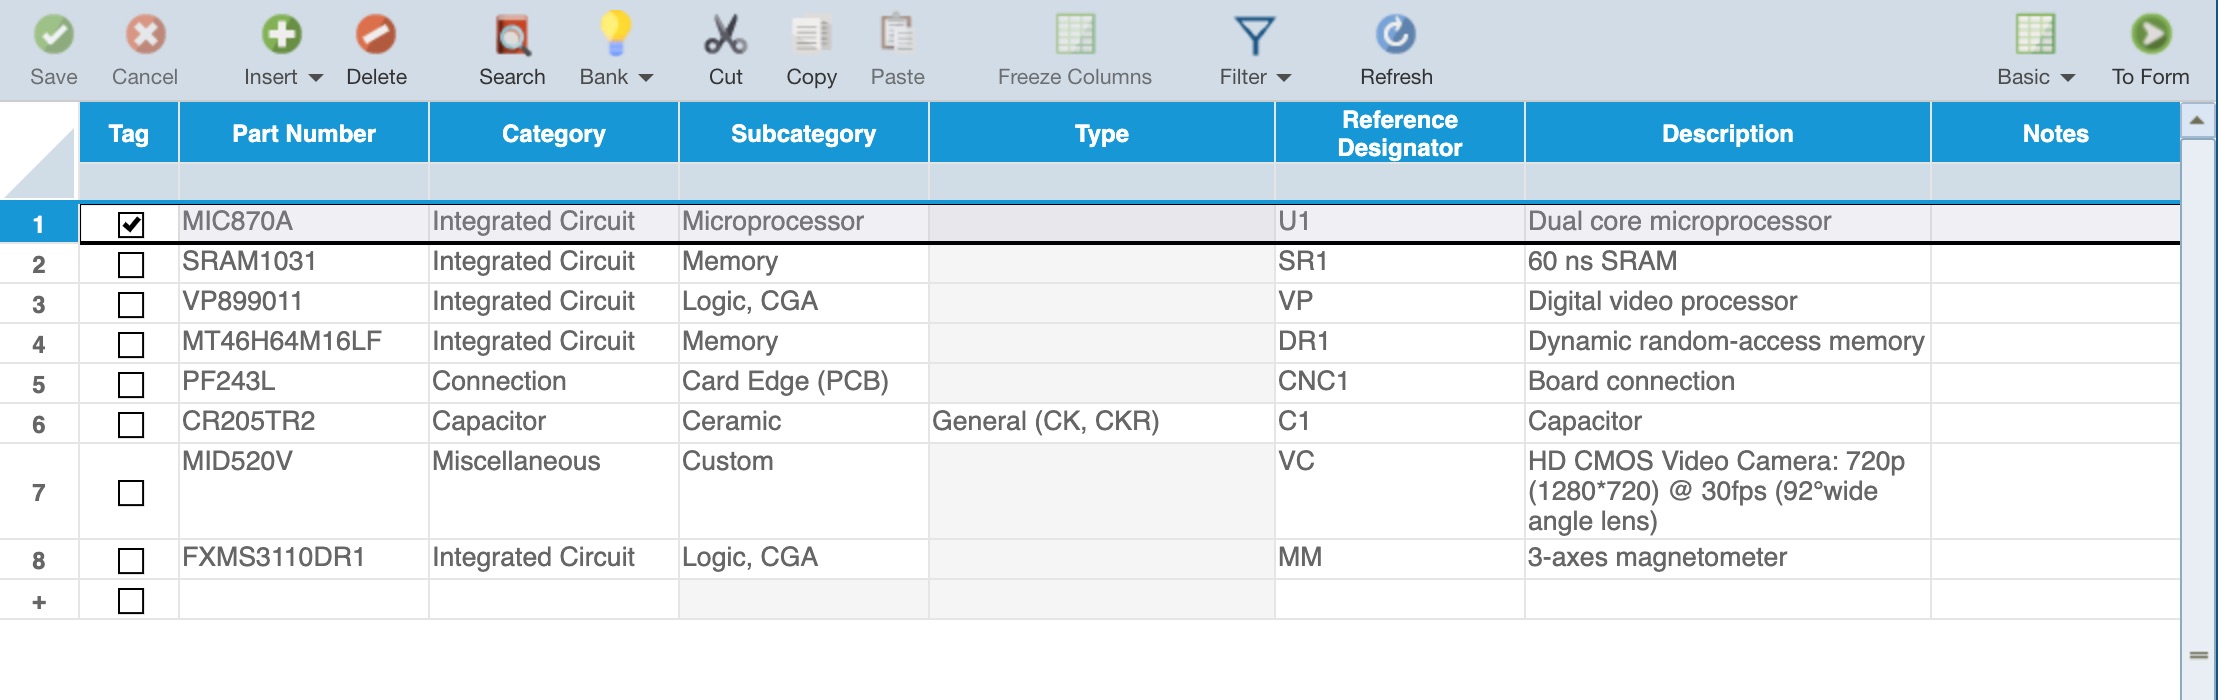
Tables
The term "Table" is used to designate views where the data appears in a Table, or spreadsheet-like, format.
The View Manager can assist with managing Table Views.
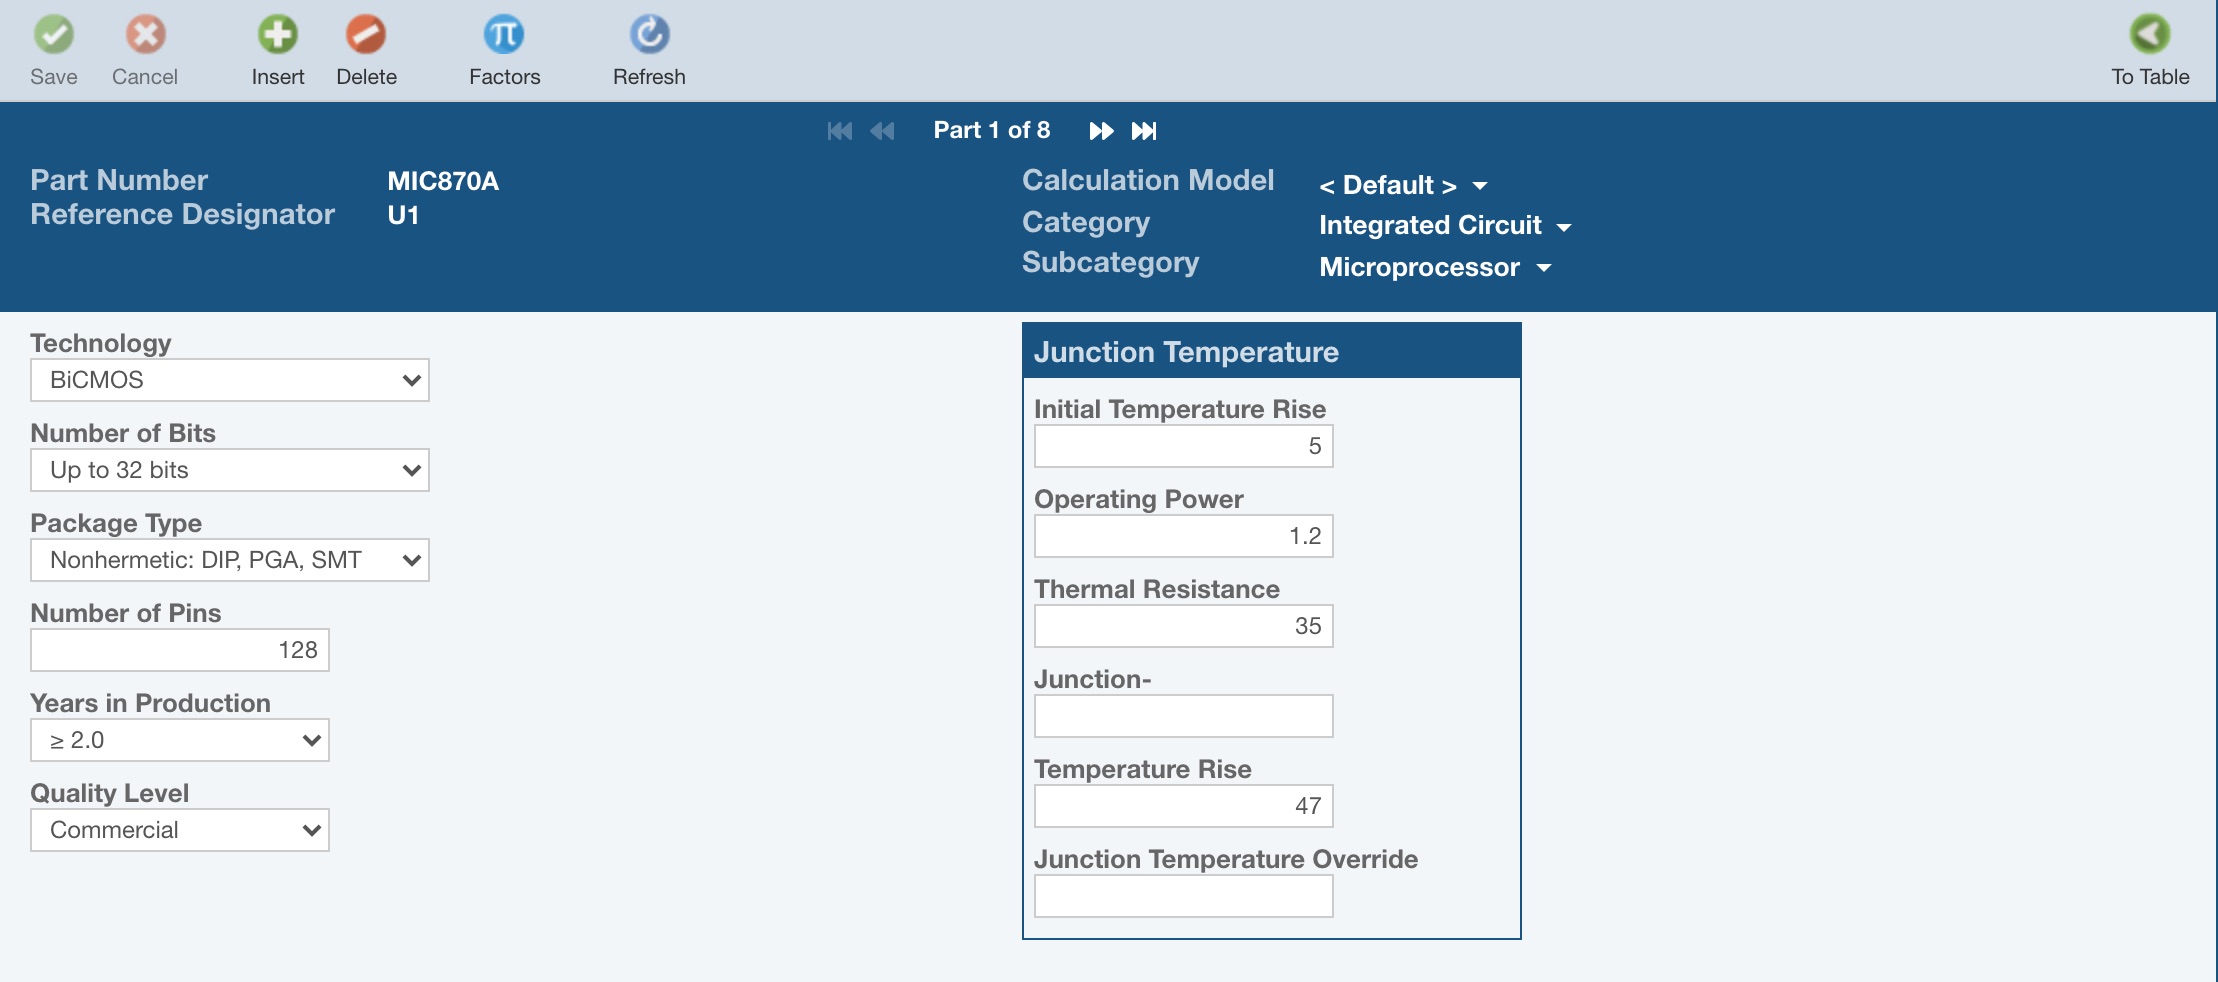
Forms
The term "Form" is used to designate data that appears as groups of fields for data entry.
Switching between Table and Form data views
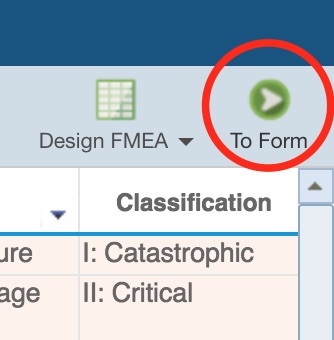
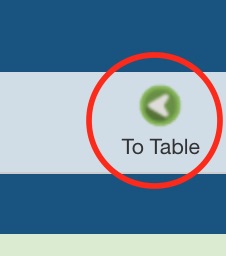
The To Form and To Table buttons appear in the right side of the toolbars on tables and forms to allow you to switch between table and forms views.
When on a Table, you can move to the corresponding Form view of the data by clicking the To Form button.
Similarly, to go to the Table view from a Form view, click on the To Table button.
Trees
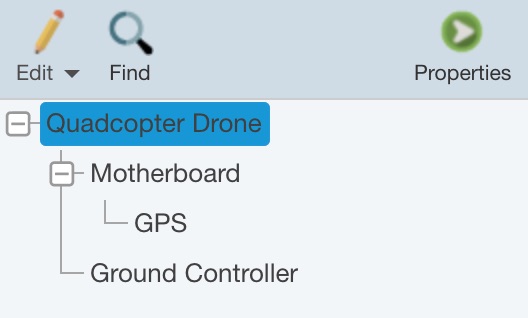
Trees are used to describe a hierarchical relationship of data. The terms parent, child, and sibling are used to describe the relationship between elements of Trees.
For example, the Analysis Tree is used to describe the relationship of the components of the product or system you are analyzing.
In the example below, the Quadcopter Drone is the product we are analyzing. The drone contains a Motherboard and a Ground Controller. The Motherboard and Ground Controller are described as children of the Quadcopter Drone, and siblings to each other. The GPS is a child of the Motherboard.
Diagrams
Diagrams are used to show a graphical representation of a system, product, or process. Diagrams are made up of symbols, connectors, and labels, offering flexibility to create a visual representation of information. You can use the diagram editor to select symbols, set colors, fonts, edit the layout, create connections between symbols, and add text labels.
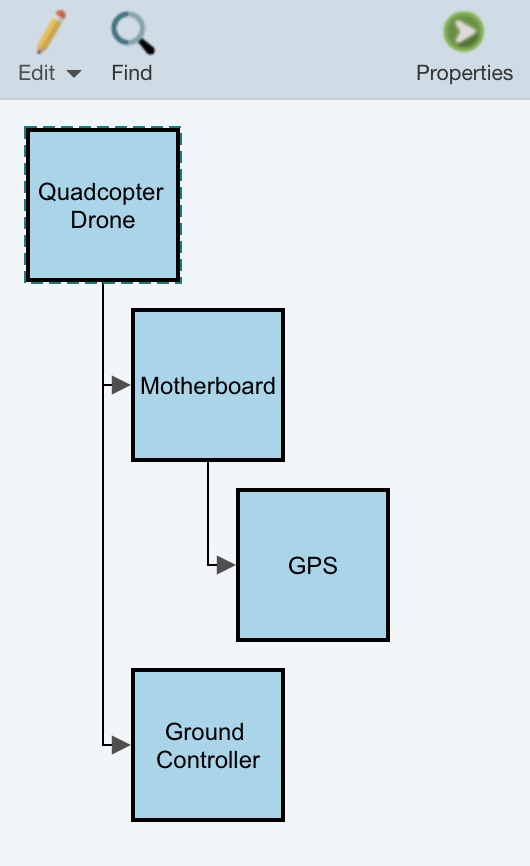
Analysis Diagram
For example, in Relyence you can create a graphical view of your Analysis Tree, called the Analysis Diagram. Relyence will automatically generate an initial Analysis Diagram for you based on your Analysis Tree, but you are welcome to modify the diagram, as you desire. The example below shows a diagram of the Quadcopter Drone.
Switching between Tree and Diagram Views
To switch between a Tree and Diagram, click the Edit>Show Diagram and Edit>Show Tree commands on the Analysis Tree toolbar.
To edit the Analysis Tree, click Edit>Edit Tree in the Analysis Tree toolbar when the Analysis Tree is displayed. To edit the Analysis Diagram, click Edit>Edit Diagram in the Analysis Tree toolbar when the Analysis Diagram is displayed.
To view or edit the properties of each item in your Analysis Tree or block in your Analysis Diagram, click the Properties button in the Analysis Tree toolbar.
For more details on the Analysis Diagram, see the Relyence Analysis Diagram section of this guide.