The Analysis Diagram Editor
The Analysis Diagram Editor is used to create and edit block diagrams used to model your product or system in Relyence FMEA, Relyence FRACAS, Relyence Reliability Prediction, and Relyence Maintainability Prediction and to create and edit Process Flow Diagrams (PFD) used in Relyence Process FMEA to model your process flow.
For an overview of using block diagrams in Relyence, review the Getting Started with Relyence Analysis Diagram.
Elements of the Analysis Diagram Editor
The main user interface for building an Analysis Diagram is the Analysis Diagram Editor. The Editor enables you to create a visual representation using functions you commonly use in drawing applications.
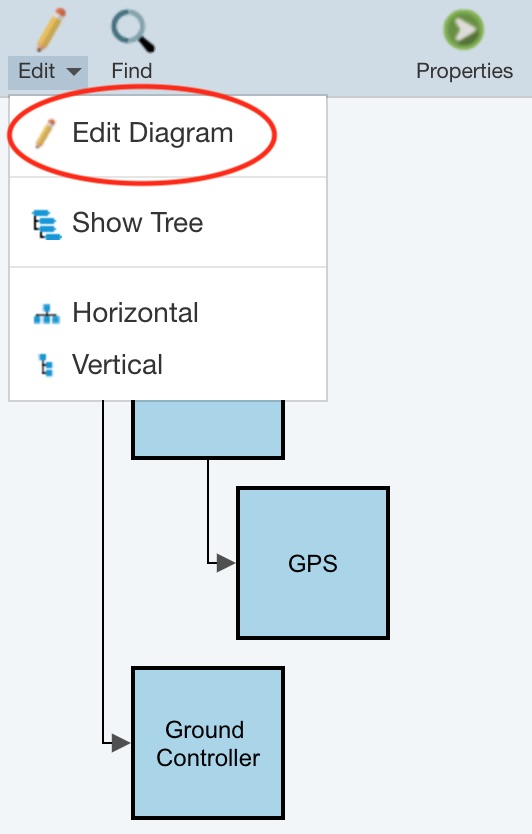
To access the Analysis Diagram Editor in Relyence FMEA, Relyence FRACAS, Relyence Reliability Prediction, or Relyence Maintainability Prediction make sure the diagram is displayed in the Analysis Tree pane, and click Edit>Edit Diagram in the Analysis Tree pane toolbar.
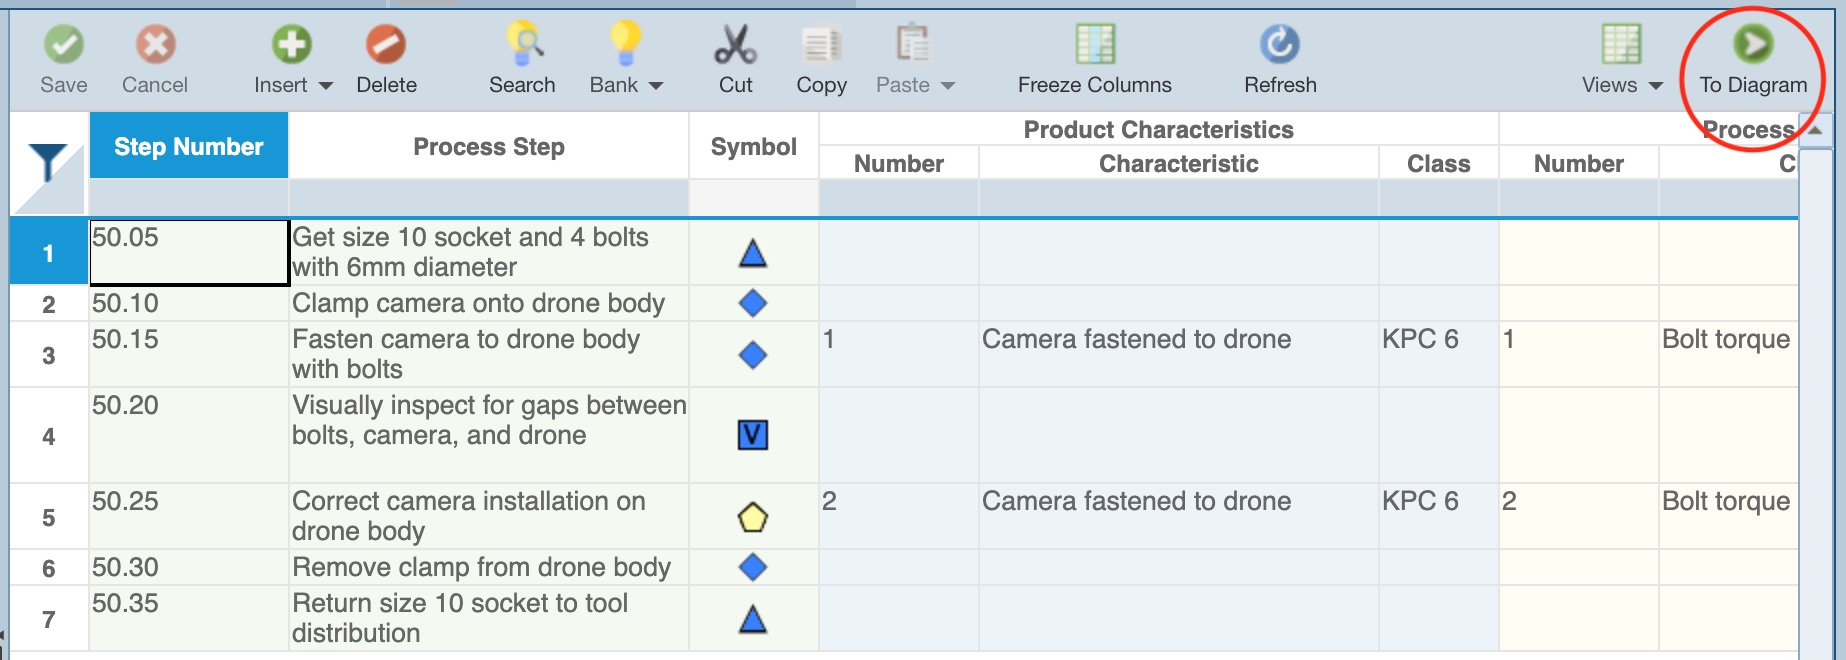
To access the Process Flow Diagram Editor in Relyence Process FMEA, make sure the Process FMEA is selected in the Sidebar menu under FMEA, make sure the Process Flow Table tab is active. If the Process Flow Worksheet is in view, click To Diagram in the FMEA toolbar to display the Process Flow Diagram.
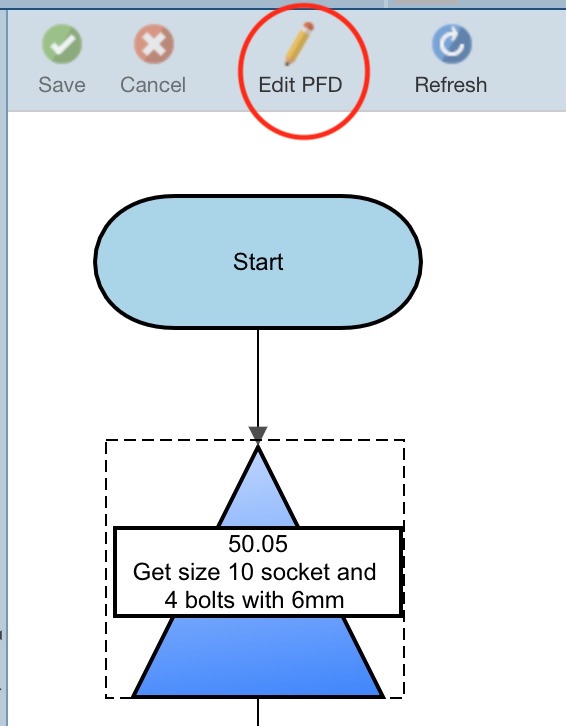
Then click Edit PFD in the FMEA toolbar.
1. Diagram Window
The main area of the Analysis Diagram Editor is the Diagram Window. This is the graphical layout area that you use to create your diagram.
2. Toolbar
The topmost section of the Editor is the Toolbar.
.jpg)
The functions of the toolbar include:
- Save and Close: Any modifications to your diagram will be saved and the Analysis Diagram Editor will be closed. You will return to the Analysis view you were in prior to editing.
- Save: Any modifications to your diagram will be saved. You will remain in the Analysis Diagram Editor.
- Close: The Analysis Diagram Editor will be closed, and you will return to the Analysis view you were in prior to editing. If you have made modifications and have not saved, you will be asked if you want to discard your changes.
- Delete: Deletes all selected items in your diagram. If you wish to undo your delete, use the Undo function.
- Pan: Allows you to hold the mouse down to move the Analysis Diagram main window around on your display so you can view different portions of your diagram. This is useful when your entire diagram cannot be seen on your display.
- Select: Allows selecting one or multiple items in your diagram. To select multiple items, hold the Shift key while clicking with your mouse and a selection box will appear around all selected items.
- Label: Allows you to add a text label anywhere on your diagram.
- Straight/Orthogonal/Bezier: Used to draw connections between items in your diagram. The type of connector currently in use is shown.
- Copy/Paste: Copies and subsequently pastes the selected items in your diagram. (Note: These functions are not available in the Trial version.)
- Align: Aligns or spaces all selected items in your diagram according to the alignment setting selected from the dropdown list.
- Order: Sets the z-order of items in your diagram. This allows you to move items behind and in front of other items.
- Resize: Sets the size of the selected items to the same size as the first item selected based on the resize setting chosen from the dropdown.
- Undo/Redo: Undoes modifications you have made. You can go back through the list of previous edits by continually clicking Undo. Redo reverses this action.
- Zoom: Zooms the diagram in or out or to 100%.
3. Symbols Pane
The leftmost section of the Analysis Diagram Editor is the Symbols Pane. The palettes contain different symbols that you can use in your diagram.
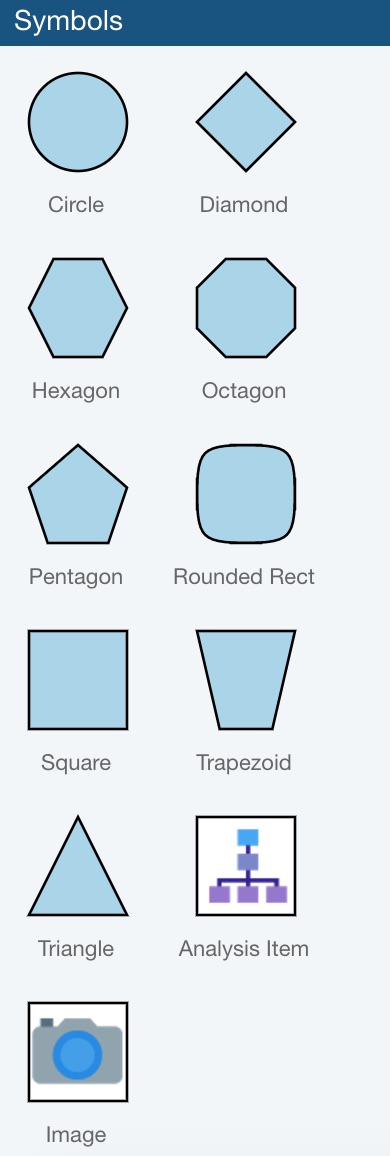
The Analysis Item block enables you to link a block in your diagram to data in your Analysis. The Image block allows you to upload any image you would like into your diagram.
4. Properties Pane
The rightmost section of the Analysis Diagram Editor is the Properties Pane. The Properties Pane will display the appropriate properties available for the item that is selected in the Diagram Window.
If you have a block selected, the Block and Label Properties will be displayed.
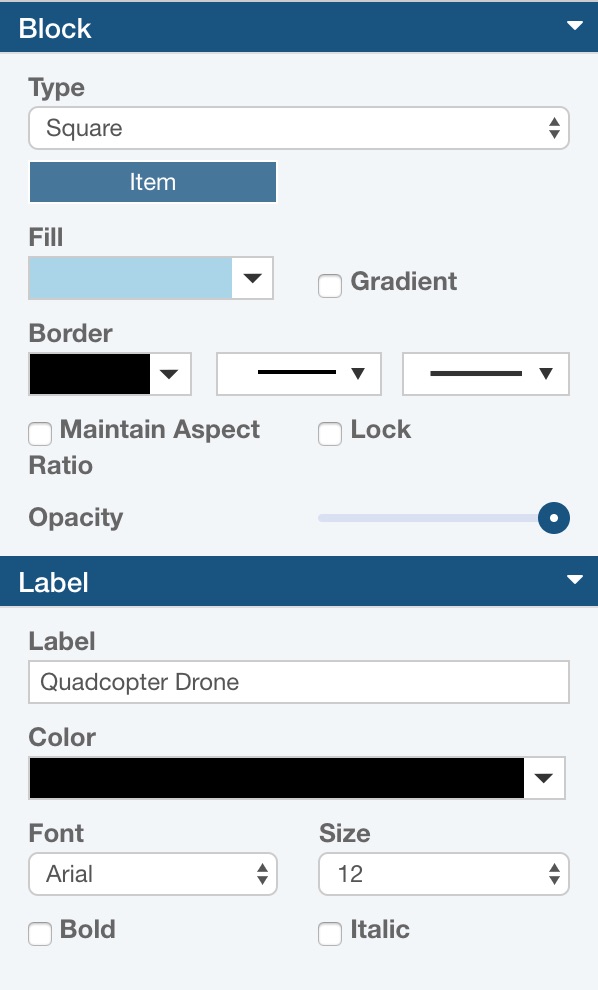
Block Properties:
- Type: Sets the symbol type based on the selection from the list.
- Item Button: Links a diagram item to an Analysis Tree item or another Analysis Diagram item.
- Image Button: Allows you to select an image for your Analysis Diagram item. (Note: Only visible when Type is set to Image.)
- Fill: Color allows you to select the item color.
- Gradient sets the Fill Color to a gradual coloring from light to dark.
- Border: Color allows you to set the border color, Thickness allows you to set the border thickness, and Style allows you to set the type of border you want.
- Maintain Aspect Ratio: When resizing an item in the diagram, ensures that the horizontal and vertical sizes maintain the same size ratio as the original.
- Lock: Disables the ability to resize the item in the diagram.
- Opacity: Changes the lightness/darkness of the item's color.
Label Properties:
- Label: Sets the text to display.
- Color: Sets the color of the text.
- Font: Sets the font of the text.
- Size: Sets the font size of the text.
- Bold: Sets the font to bold.
- Italic: Sets the font to italic.
If you have a connector selected, the Connector and Label Properties will be displayed.
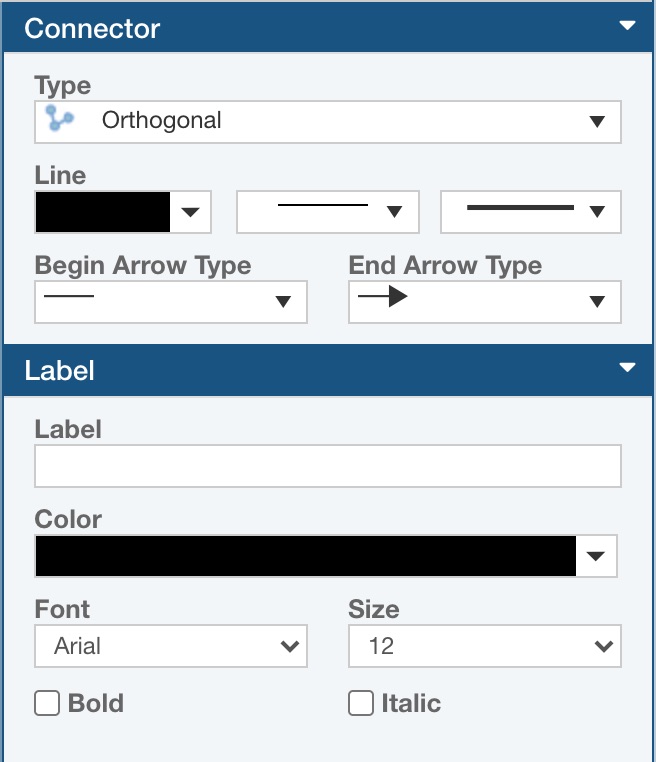
Connector Properties:
- Type: Sets the type of connector - straight, orthogonal, or Bezier.
- Line: Color allows you to set the line color, Thickness allows you to set the line thickness, and Style allows you to set the type of line you want.
- Begin Arrow Type: Sets the style of the connector start point.
- End Arrow Type: Sets the style of the connector end point.
Label Properties:
- Label: Sets the text to display.
- Color: Sets the color of the text.
- Font: Sets the font of the text.
- Size: Sets the font size of the text.
- Bold: Sets the font to bold.
- Italic: Sets the font to italic.
If you have no item selected, the Diagram Properties will display.
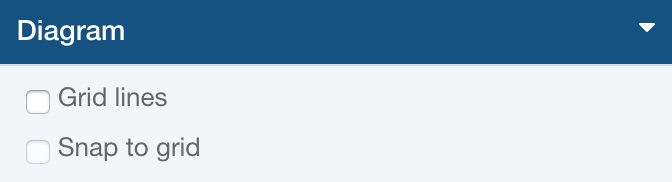
- Grid lines: Shows grid lines on the main diagram window.
- Snap to grid: Forces all items to locations on grid lines when moving items in the diagram.