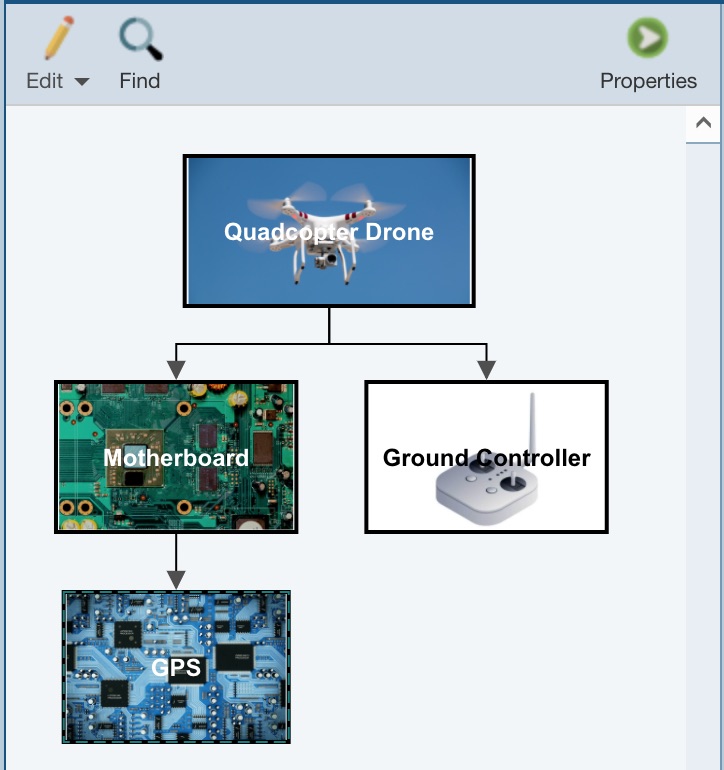
Getting Started with Relyence Analysis Diagram
1. Sign in to Relyence
To begin, make sure you are signed in to Relyence. For details on signing in, see Signing in and Signing Out.
You must have a Relyence account to sign in to Relyence. If you do not yet have a Relyence account, you can register for one for free.
You may possibly see the Announcements dialog when first signing into Relyence. The Announcements automatically scroll, or you can review them using the previous and next arrow keys. For any Announcements you do not wish to see again, select the Don't show me this again checkbox. Once you have reviewed all the Announcements, click the 'x' (Close) button in the upper right corner of the Announcements dialog.
2. Open the Example Analysis
For this tutorial, we will use the Relyence Reliability Prediction module and the Drone Example Analysis supplied with it.
First, let's make sure Relyence Reliability Prediction is active.
After you have signed in, you may see a Welcome dialog. If a Welcome dialog does not appear, click Welcome to Relyence from the Help dropdown menu in the upper right of the Relyence header bar.
If you were previously working on an Analysis, you will see the Continue Where I Left Off option at the top of this dialog, otherwise it will not appear. If you are using a Trial version, the Show this page when Relyence opens option will not appear. This option is only available using a licensed version of Relyence.
Click the Reliability Prediction tab on the left to activate Relyence Reliability Prediction. Then click Open Example Analysis.
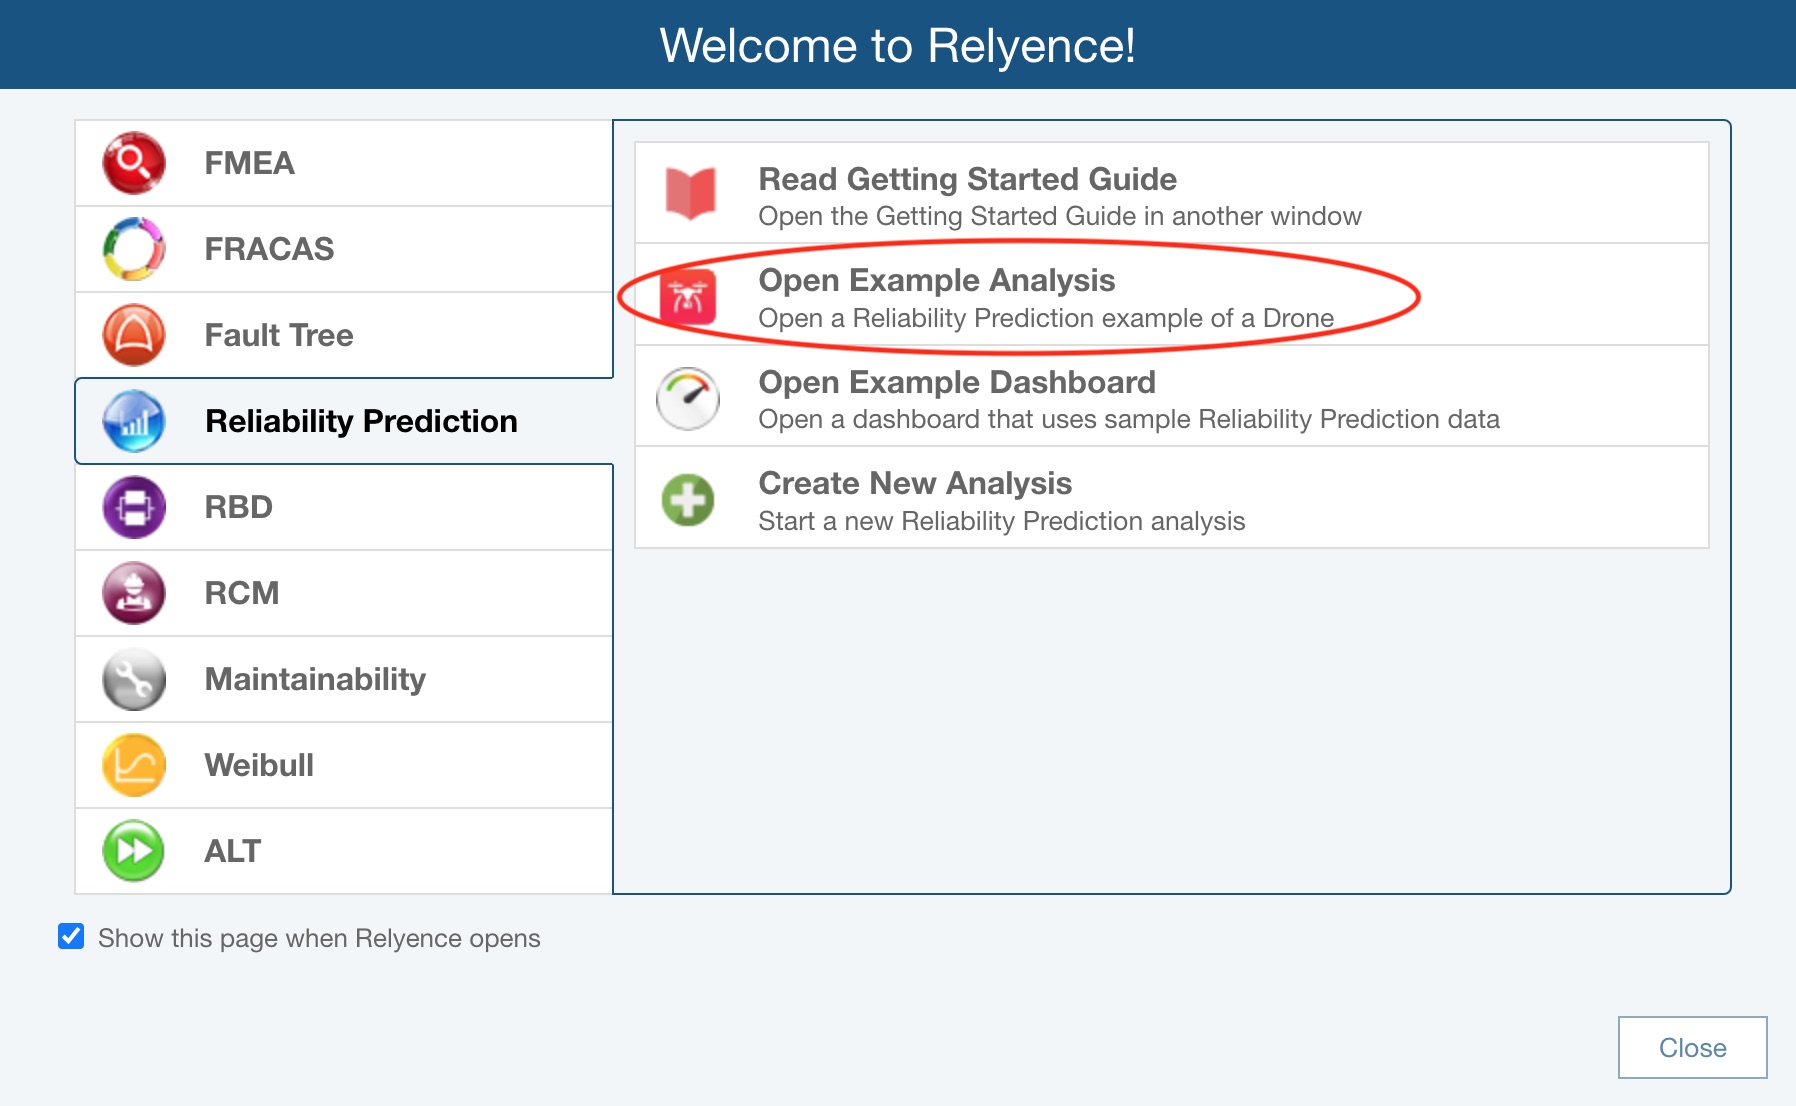
When you open an Example, you will see the Revert Example pop up appear. You are free to make changes and save your changes to the Example Analyses. If you want to revert to the original Example at any time, click Revert Example. You will get a message asking if you are sure before your changes are discarded. Click Got it! to dismiss the pop up.
For this tutorial, we assume an unmodified original Example is being used. If you are not sure if you are using an unmodified version of the Example, click Revert Example from the Sidebar. You will be asked if you want to lose your changes and reopen the Example in its original version. Click Yes. If needed, click Got it! to dismiss the pop up.
If you continue with a modified version, just be aware that screen shots or other functions may not operate exactly as described in this tutorial.
When complete, your Drone Example with its data will appear in the main window.
3. Viewing the Analysis Diagram
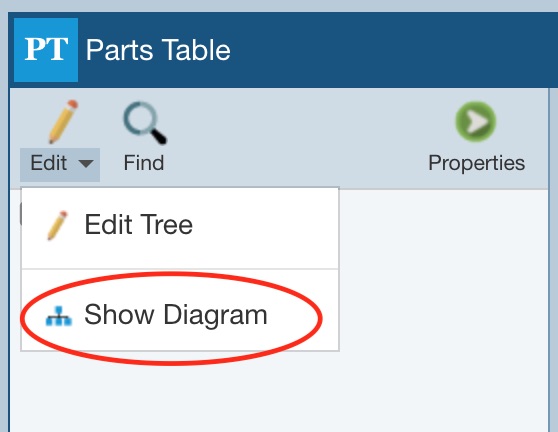
In the Analysis Tree pane, click the Edit>Show Diagram command in the Analysis Tree toolbar.
Relyence Reliability Prediction auto-generates an Analysis Diagram from your Analysis Tree.
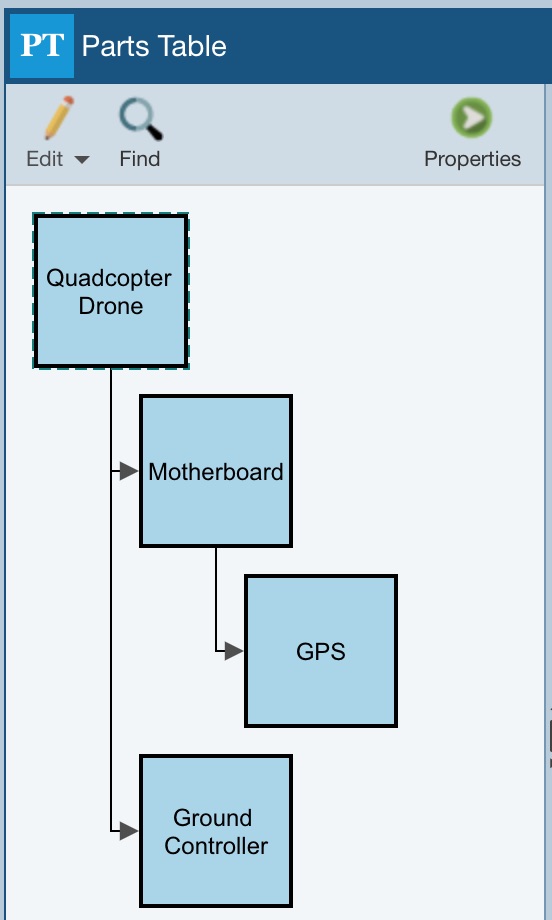
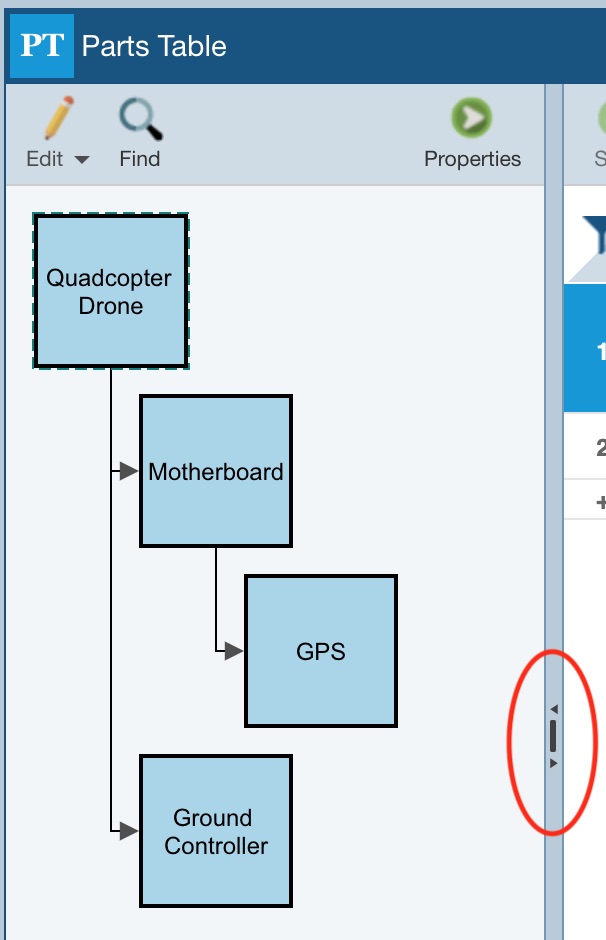
You can resize the Analysis Diagram pane at any time by using the splitter control.
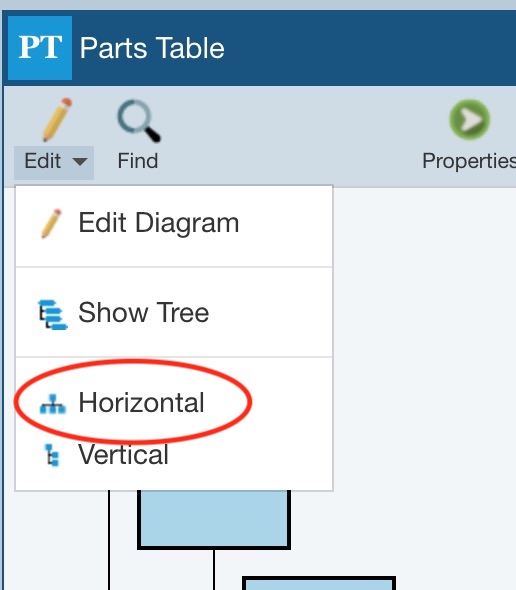
In the Analysis Diagram pane toolbar, click the dropdown arrow on the Edit button. Now that the Analysis Diagram is displayed in your Analysis Tree pane, the diagram layout options allow you to select either a vertical (the default) or a horizontal layout for your initial auto-generated Analysis Diagram. Click Horizontal.
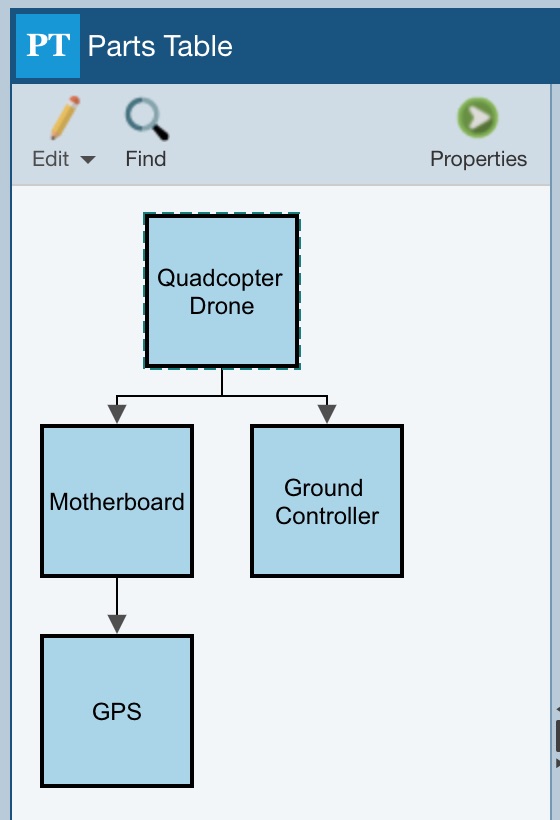
The diagram changes to a horizontal layout.
4. Editing the Analysis Diagram
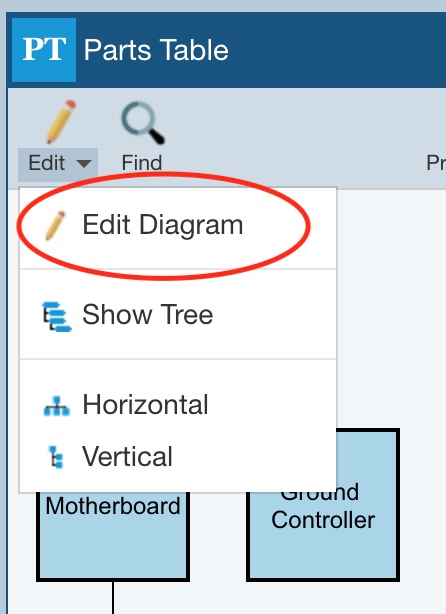
To make changes to the Analysis Diagram, you need to go into Edit mode. Click Edit>Edit Diagram from the Analysis Diagram toolbar. Note that because Edit Diagram is the first item in the Edit submenu, you could also just click the Edit icon and it will perform the Edit Diagram action because it is the first item in the list.
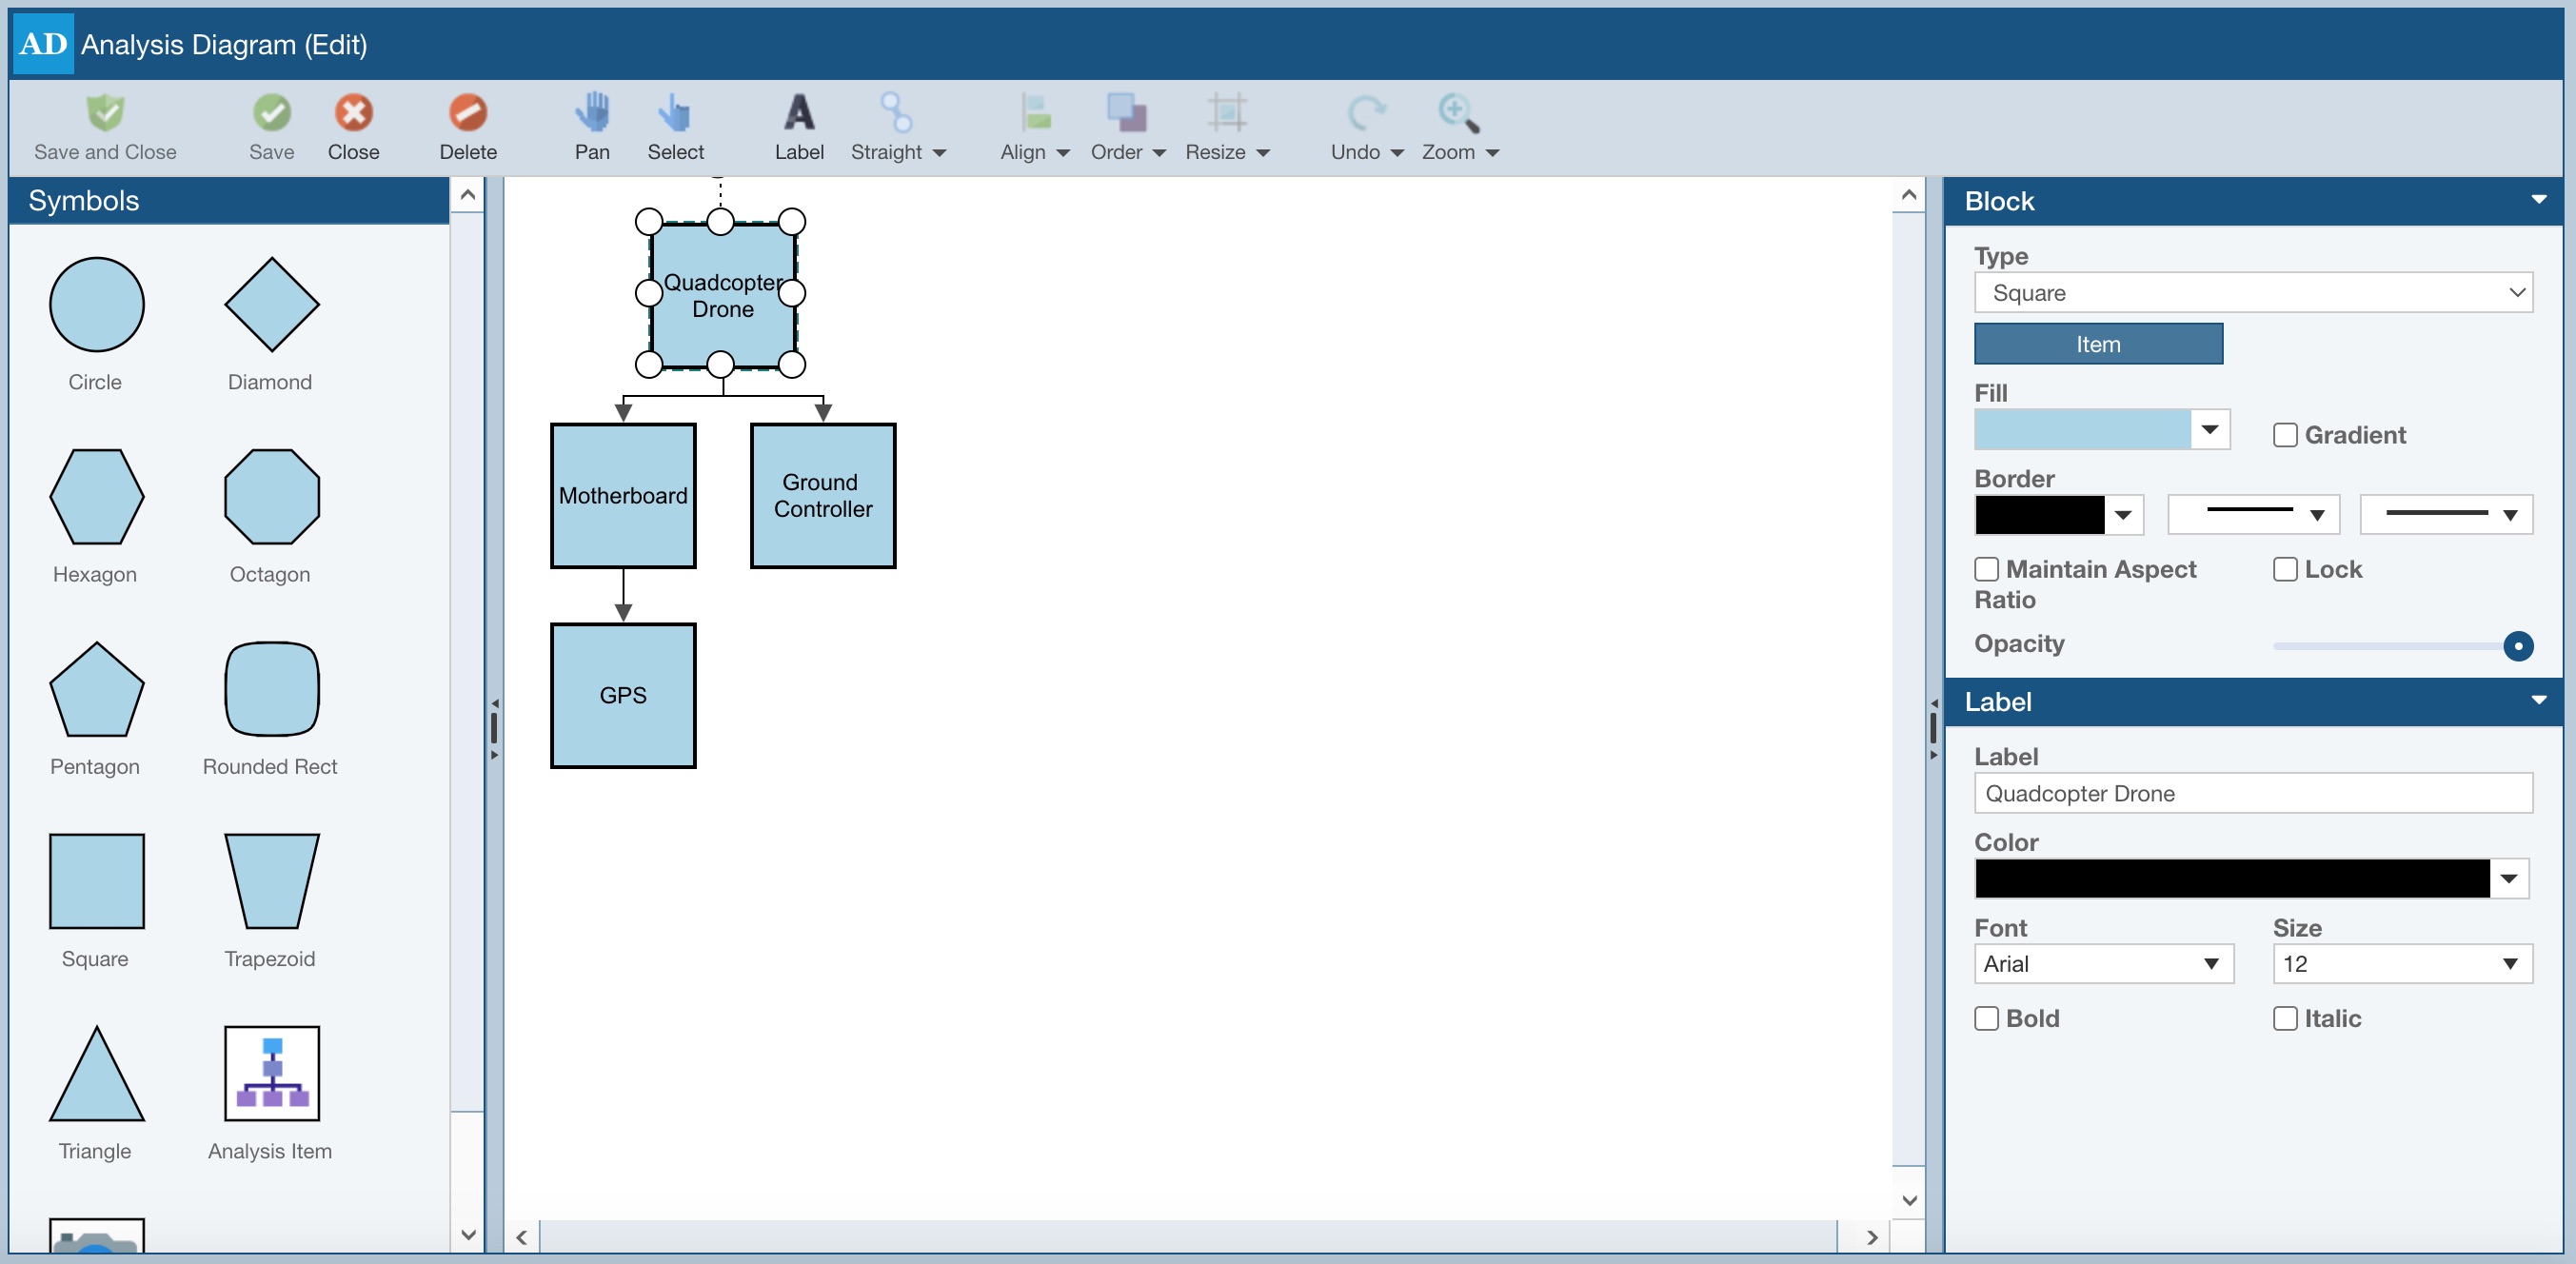
The Analysis Diagram Editor opens.
5. Adding an Item to your Analysis Diagram
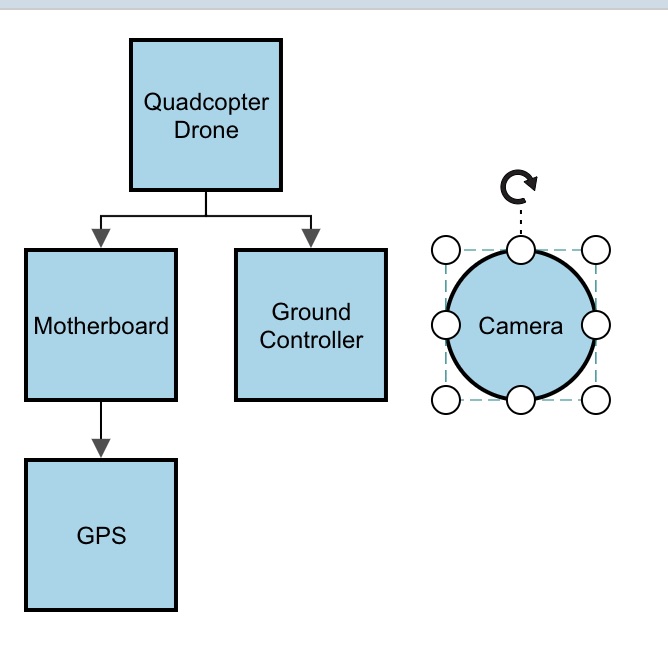
Dragging and dropping items from the Symbols palette onto the main diagram pane adds elements to your Analysis Diagram. Select and drag the Circle to a location next to the Ground Controller on your diagram. When you release the mouse, the label for your newly added item will be highlighted for you to enter the name of your new item. Type "Camera" and press Tab.
6. Changing the Appearance of your Analysis Diagram Items
To change the appearance of the items in your diagram, you can select from the various options that appear in the Properties pane. With the newly added "Camera" item still selected, click the dropdown of the Fill field in the Block section of the Properties pane. The color picker dialog appears.
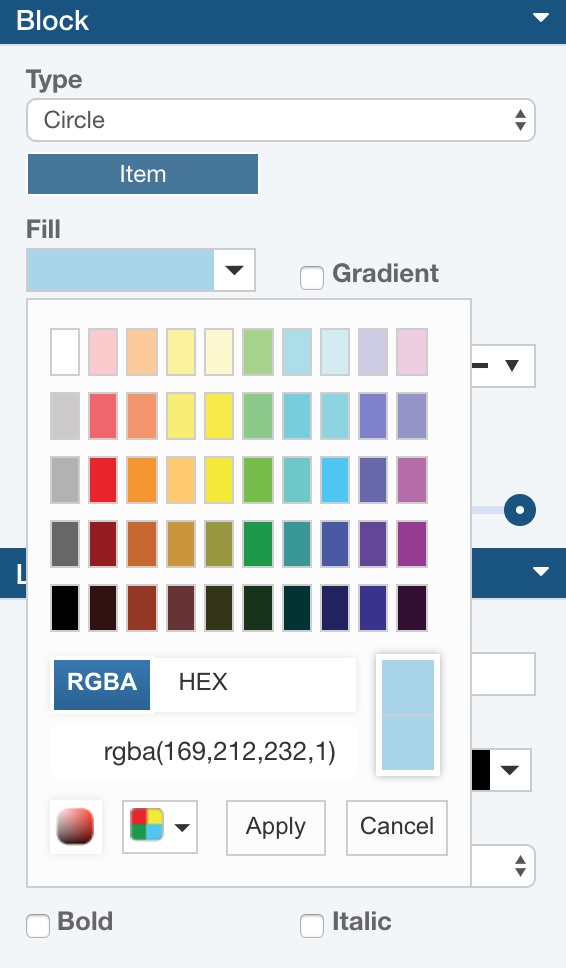
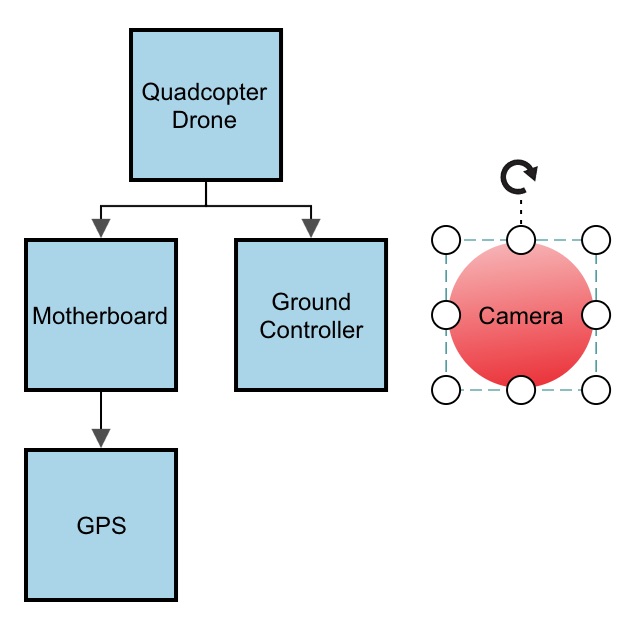
Click on a red block and then click Apply to change the color of the item to red. Select the Gradient checkbox to show a gradient red coloring in the Camera item. Change the border color to white by clicking the dropdown of the Border field, selecting white from the color picker, and then clicking Apply. Also note that you can change the thickness and style of the border using the dropdowns under the Border heading.
7. Connecting Items in your Analysis Diagram
Now, we need to connect the Camera to the Quadcopter Drone to show its relationship to the other components of the drone. In this case, we want the connector to be drawn an orthogonal line (with bends in the line) rather than just a straight line. This way, we can more easily align it to fit in well with the current diagram layout.
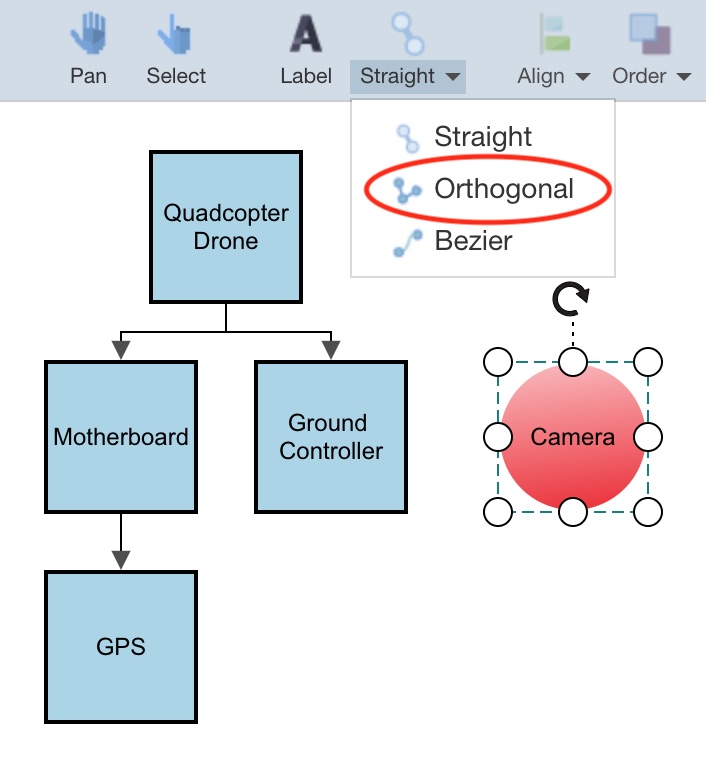
In the toolbar, the Connector button shows the currently selected Connector type: Straight, Orthogonal, or Bezier. By default, the Connector type is set to Straight. Click arrow next to the Straight button to view the dropdown list and click Orthogonal to change the connector type.
You are now in Connection mode and all the connection points of your diagram items will be highlighted. The connection points are the location of where you can start and end your connections. When you are on a valid connection point, it will change to a green color.
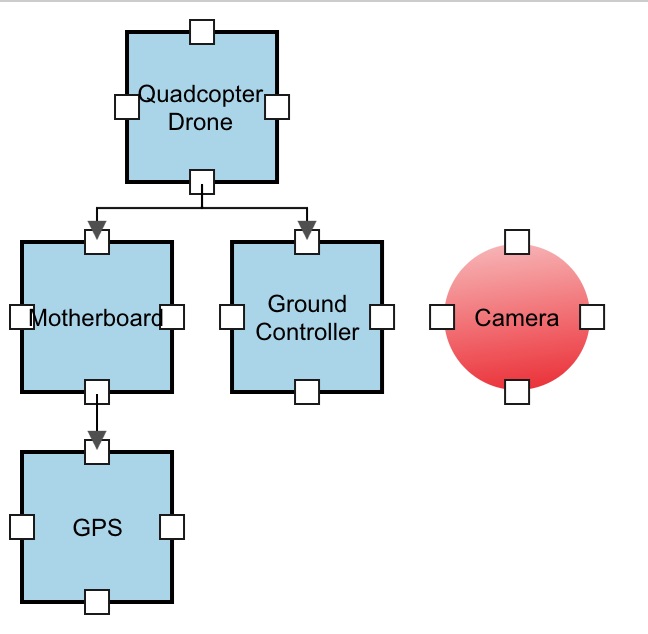
Place the cursor at the bottom connection point of the Quadcopter Drone item and when you see the green fill color, click and hold your mouse button and drag the connector to the top connection point of the Camera item. When you see the green fill color appear at the new connection point, release your mouse button.
8. Rearranging Items in your Analysis Diagram
Now, we'd like to realign our diagram with the new configuration. From the toolbar, click Select.
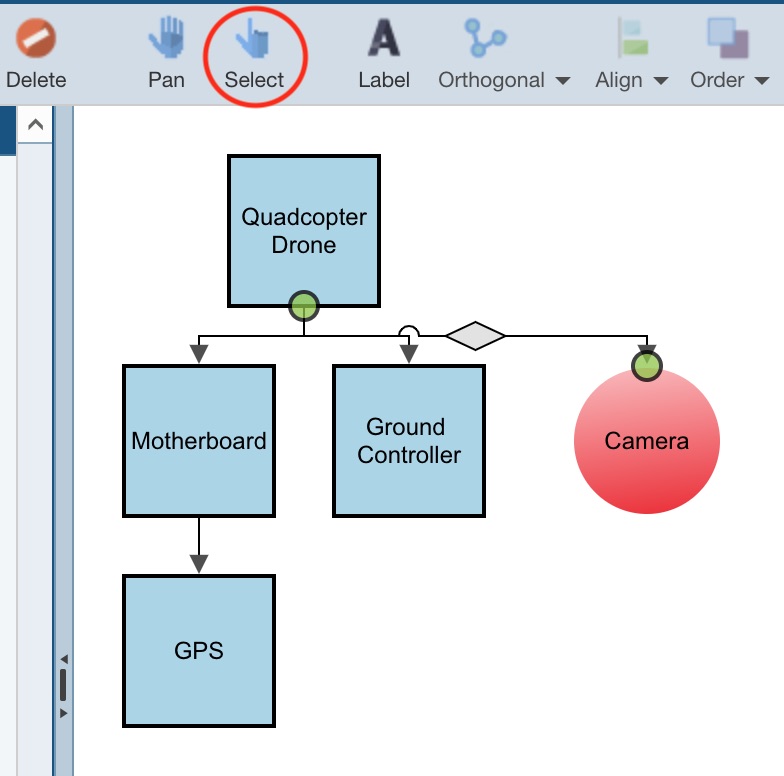
This will take the diagram out of Connection mode and allow you to select any item in the diagram. When in Select mode, use your mouse to select whatever items you want to move or edit by clicking on them. Using Select mode, rearrange your diagram as you desire. You can realign all the items to look more centered if you prefer:
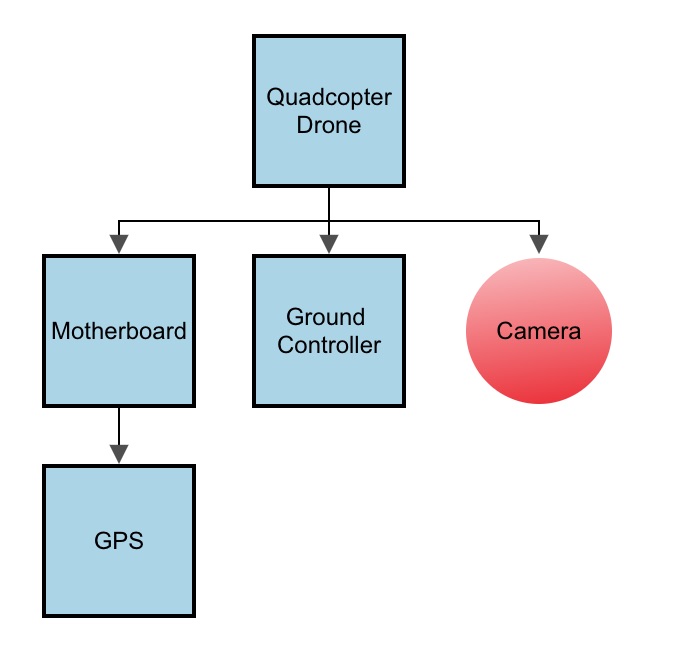
Also note that you can use the toolbar functions to modify your diagram: Align, Order, and Resize. See The Analysis Diagram Editor topic of this guide for more details on these features.
9. Using Images in your Analysis Diagram
You can add images in your Analysis Diagram. One way to add an image is to drag and drop the Image item from the Symbols pane onto your diagram. When you do this, the Select Image dialog appears for you to specify the image you want to use.
You can also change the Type of any item in your diagram by using the Type dropdown in the Block Properties. We can use this to change our Camera item to an image rather than a circle. Make sure you are in Select mode, click on the Camera item to select it, and select Image from the Type dropdown in Block Properties.
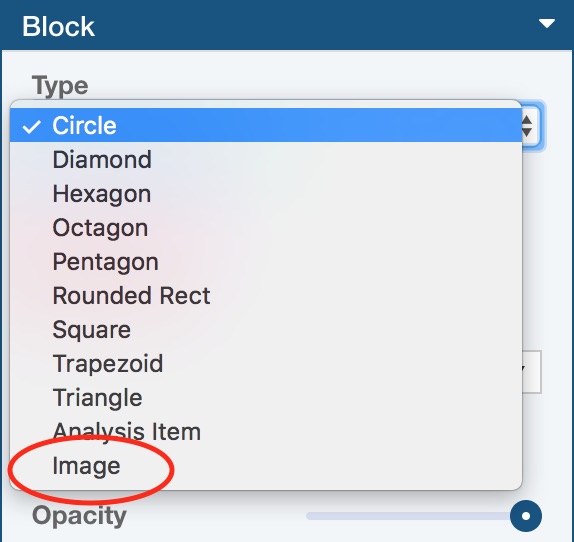
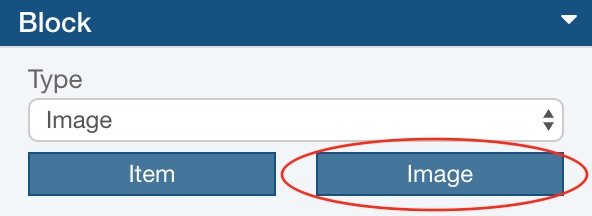
Select any image you would like from your available images. Note that images must be less than 0.5Mb in size. Depending on your browser, the image selection dialog may not appear. In this case, click the Image button to bring up the image selection dialog to select the image you would like to use.
Your new image will appear in your diagram. In our example below, we added an icon image for a camera.
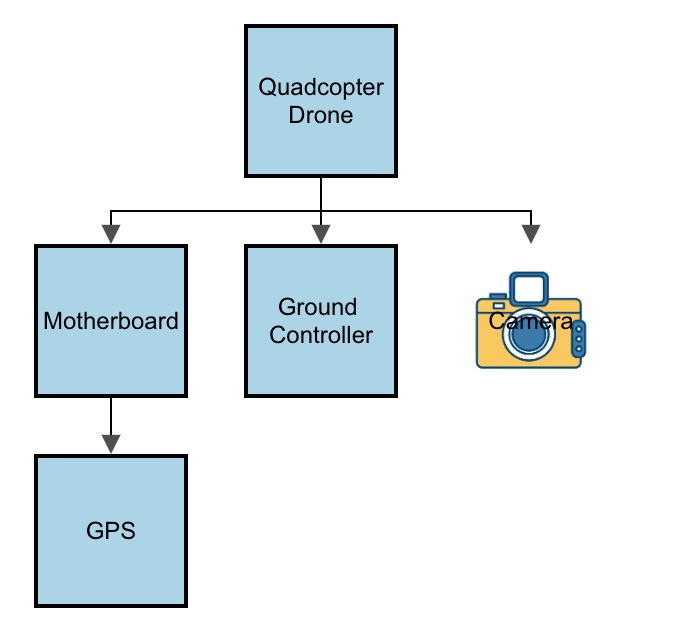
At this point, we are ready to save our changes. Modifying the Analysis Diagram has some unique properties. For details, read through the next section to help you choose whether to save your diagram modifications.
10. Understanding the Analysis Diagram and Analysis Tree Relationship
Click Save in the toolbar to save our Analysis Diagram modifications. The Save Analysis Diagram dialog appears.
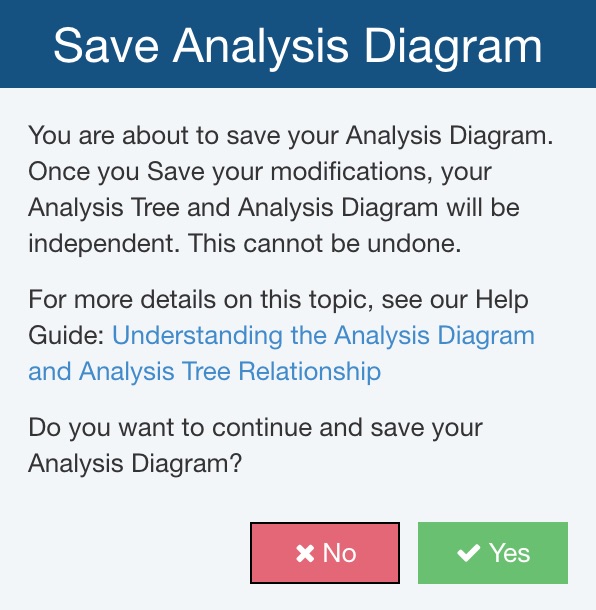
Relyence auto-generates your initial Analysis Diagram based on the configuration of your Analysis Tree. This one-time generation to get you started is done when you first click the Edit>Show Diagram command on the Analysis Tree toolbar. Once you make modifications to the auto-generated diagram and save your changes, the Analysis Diagram is from that point forward independent from the Analysis Tree. Changes you make to your Analysis Tree do not modify the Analysis Diagram, and vice versa. For example, once independent, if you add an item to your Analysis Tree it will not be added to your Analysis Diagram. Also, if you change the structure of your Analysis Tree, it will not impact the structure of your Analysis Diagram. Similarly, once independent, if you add an item to your Analysis Diagram, it will not appear in the Analysis Tree, and changes to the layout of your Analysis Diagram will not affect the Analysis Tree structure. This enables you to create a diagram in any form you desire. The structure of the Analysis Tree is used when calculating and reporting on your Analysis, whereas the Analysis Diagram layout does not affect these functions. (Note that you can generate a report on the diagram itself.)
If you want to keep your Analysis Tree and Analysis Diagram in sync so that they show the same representation, just in a different visual format, the best way to do this is to fully define your product, system, or process using the Analysis Tree. Then use the Edit>Show Diagram command and allow Relyence to auto-generate your Analysis Diagram in a layout that conforms to the Analysis Tree structure. Then you can use the Analysis Tree or Analysis Diagram as your selection mechanism for your Analysis data. If you click on an item in your Analysis Tree or in your Analysis Diagram, the data in the main window will display the FMEA, FRACAS, Reliability Prediction, or Maintainability Prediction data associated with that item.
Oftentimes, the Analysis Tree and Analysis Diagram are separate representations of your overall Analysis. The Analysis Tree is kept intact in order to define how calculated values "roll up" through your entire system. The Analysis Diagram is then used as an easy-to-view graphical layout of your system to help visualize your system at a quick glance.
Once your Analysis Tree and Analysis Diagram are independent, you can still link items in your Analysis Diagram to Analysis Tree items by using the Item button on the Block Properties.
If you enter Edit mode and make changes to your Analysis Diagram, but do not Save your modifications, the auto-generation feature will remain available.
Click Yes to save the modifications and uncouple our Analysis Tree and Analysis Diagram moving forward.
11. Linking Analysis Diagram Items to Analysis Tree Items
You can link any item in your diagram to an item in your Analysis Tree or to another Analysis Diagram item. This allows you to use the Analysis Diagram as the interface to access the appropriate Analysis data. For example, using our current Example Analysis, when you click on the Motherboard item in the Analysis Diagram (when not in diagram Edit mode), you will see the Parts associated with the Motherboard in the Parts Table, just as you would if you selected the Motherboard in the Analysis Tree view. In this case, the linkage was automatically done as part of the auto-generate feature.
You can also manually link items in your diagram at any time. To link a diagram item to an Analysis Tree item, click the Item button that appears below the Type field in the Block section of the Properties pane.
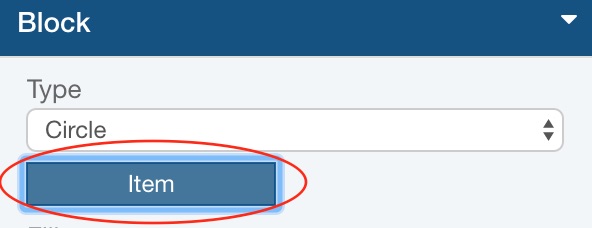
From the Select Item dialog, click the dropdown list and select the appropriate Analysis Tree item. Click OK to save the linkage.
12. Printing your Analysis Diagram
You can print your diagram or save it to various graphical formats from within the Analysis Diagram editor.
From the Sidebar, click Report.
The Report Options dialog appears.
Enter "Quadcopter Drone Analysis Diagram" for the Report Title.
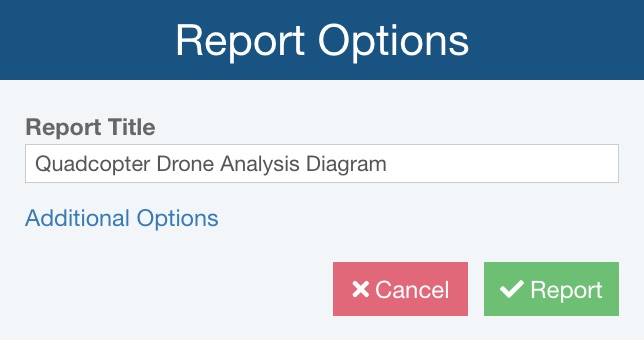
Click Additional Options to see additional reporting options. The Additional Options dialog appears.
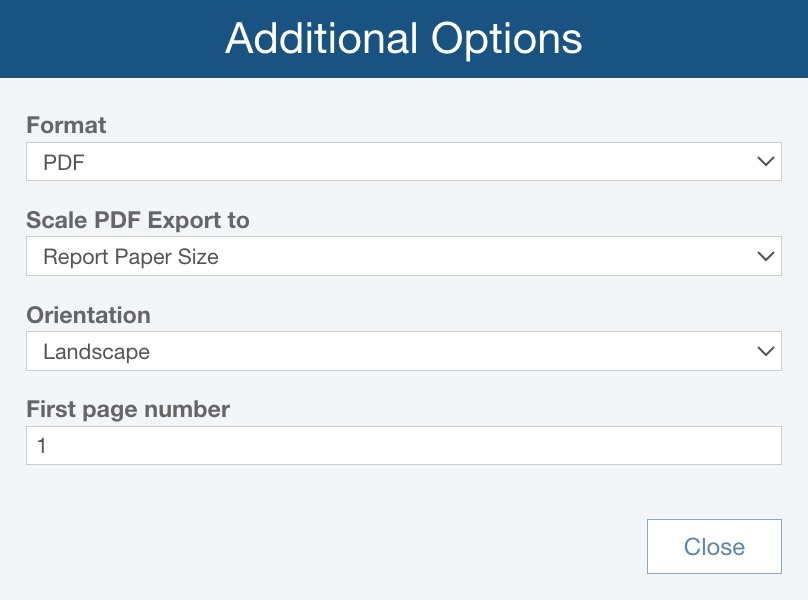
For Format, select PDF.
If Format = PDF, note that Scale PDF Export to lets you choose between:
- Report Paper Size - if the Analysis Diagram is exported to PDF, it will be scaled based on the Report Paper Size, set via Settings
- Diagram Size - if the Analysis Diagram is exported to PDF, it will be scaled based on the size of the diagram
If Format = PDF, note that Orientation lets you choose between:
- Portrait - the report page will be set so it is taller than it is wider
- Landscape - the report page will be set so it is wider than it is tall
If Format = PDF, note that First page number, lets you enter the desired first page number for the Analysis Diagram report; this can be helpful if the report will be a specific set of page numbers in a larger deliverable.
Click Close to return to the Report Options dialog.
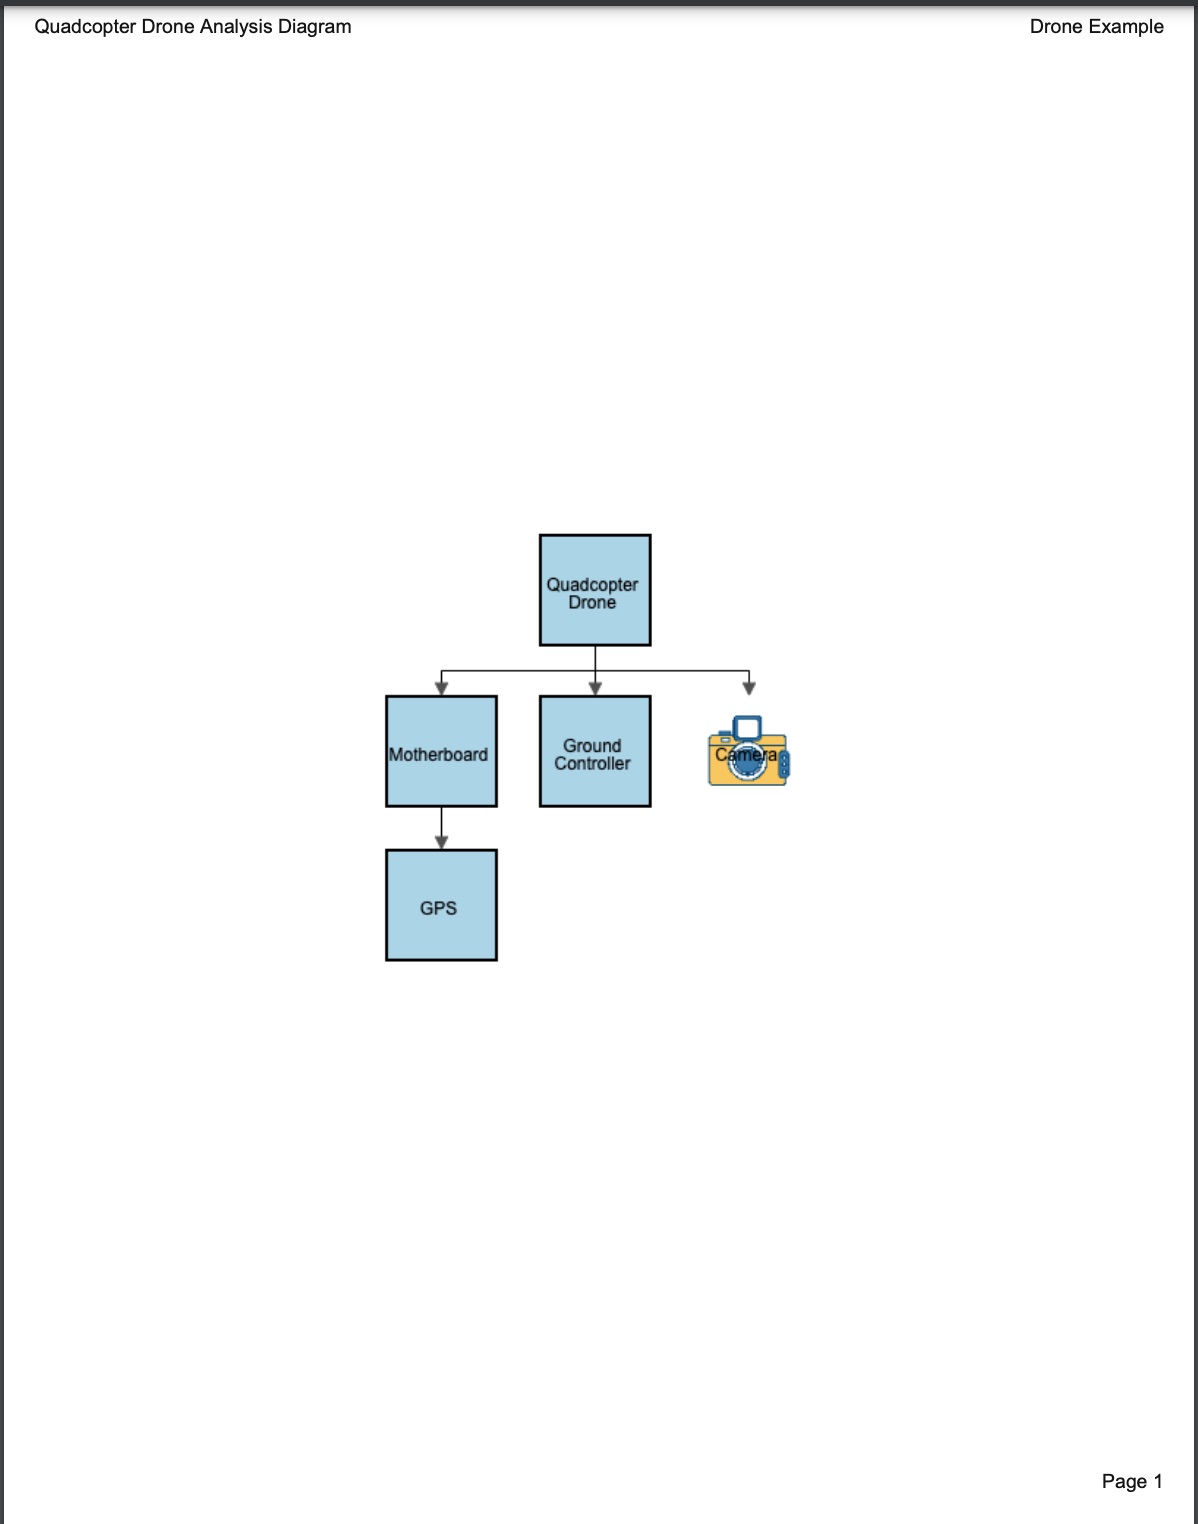
Click Report to generate your Analysis Diagram report. A sample PDF report is shown below.
13. Moving On with Analysis Diagrams
You have now completed the basics of using the Relyence Analysis Diagram capability. You are welcome to explore more on your own. Below is one example of the type of diagram you can create with Relyence Analysis Diagram. For more details on Analysis Diagram capabilities, review The Analysis Diagram Editor topic of this guide.
