Customizing the Relyence Dashboard
Relyence Dashboards are completely customizable. You can create any number of your own Dashboards and use them to get an overview of your system information. You may use Dashboards to highlight critical Analysis data, analyze metrics, or simply to have a compact visual overview of Analysis data.
Please note that the Relyence Dashboards are available for many Relyence Products. For our review of customizing the Relyence Dashboards will use Relyence FMEA.
If you have not yet reviewed Getting Started with the Relyence Dashboard, it may be helpful to do that prior to continuing with this section.
1. Create a New Dashboard
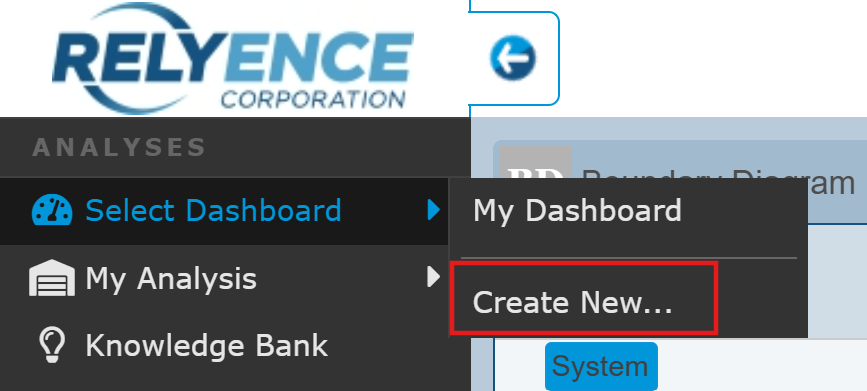
To start, let's create a new Dashboard. From the Sidebar menu, under the Analyses heading, if you see Back to Dashboard at the top, click it to go back to the Dashboard view. In the first item under the Dashboards heading in the Sidebar menu, click Create New....
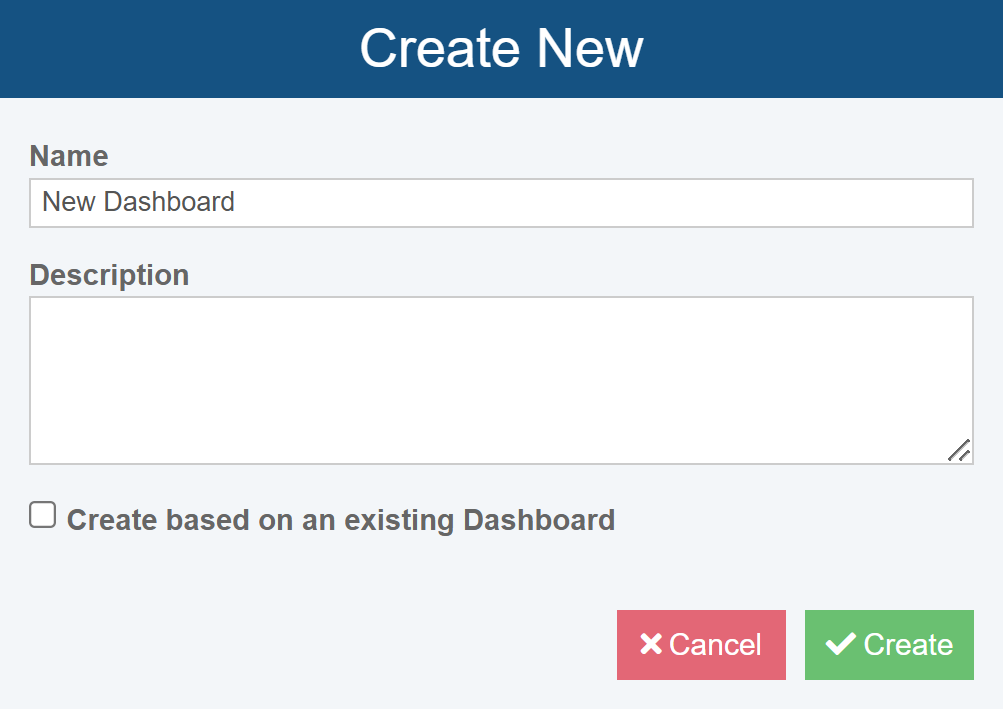
The Create New dialog appears.
Enter "New Dashboard" for the Name.
If needed, use the Create in selection to identify the Dashboard Folder to which this new Dashboard should be added. You can find more details about Dashboard Folders in the Using Folders topic.
Click Create.
The Dashboard Editor appears.
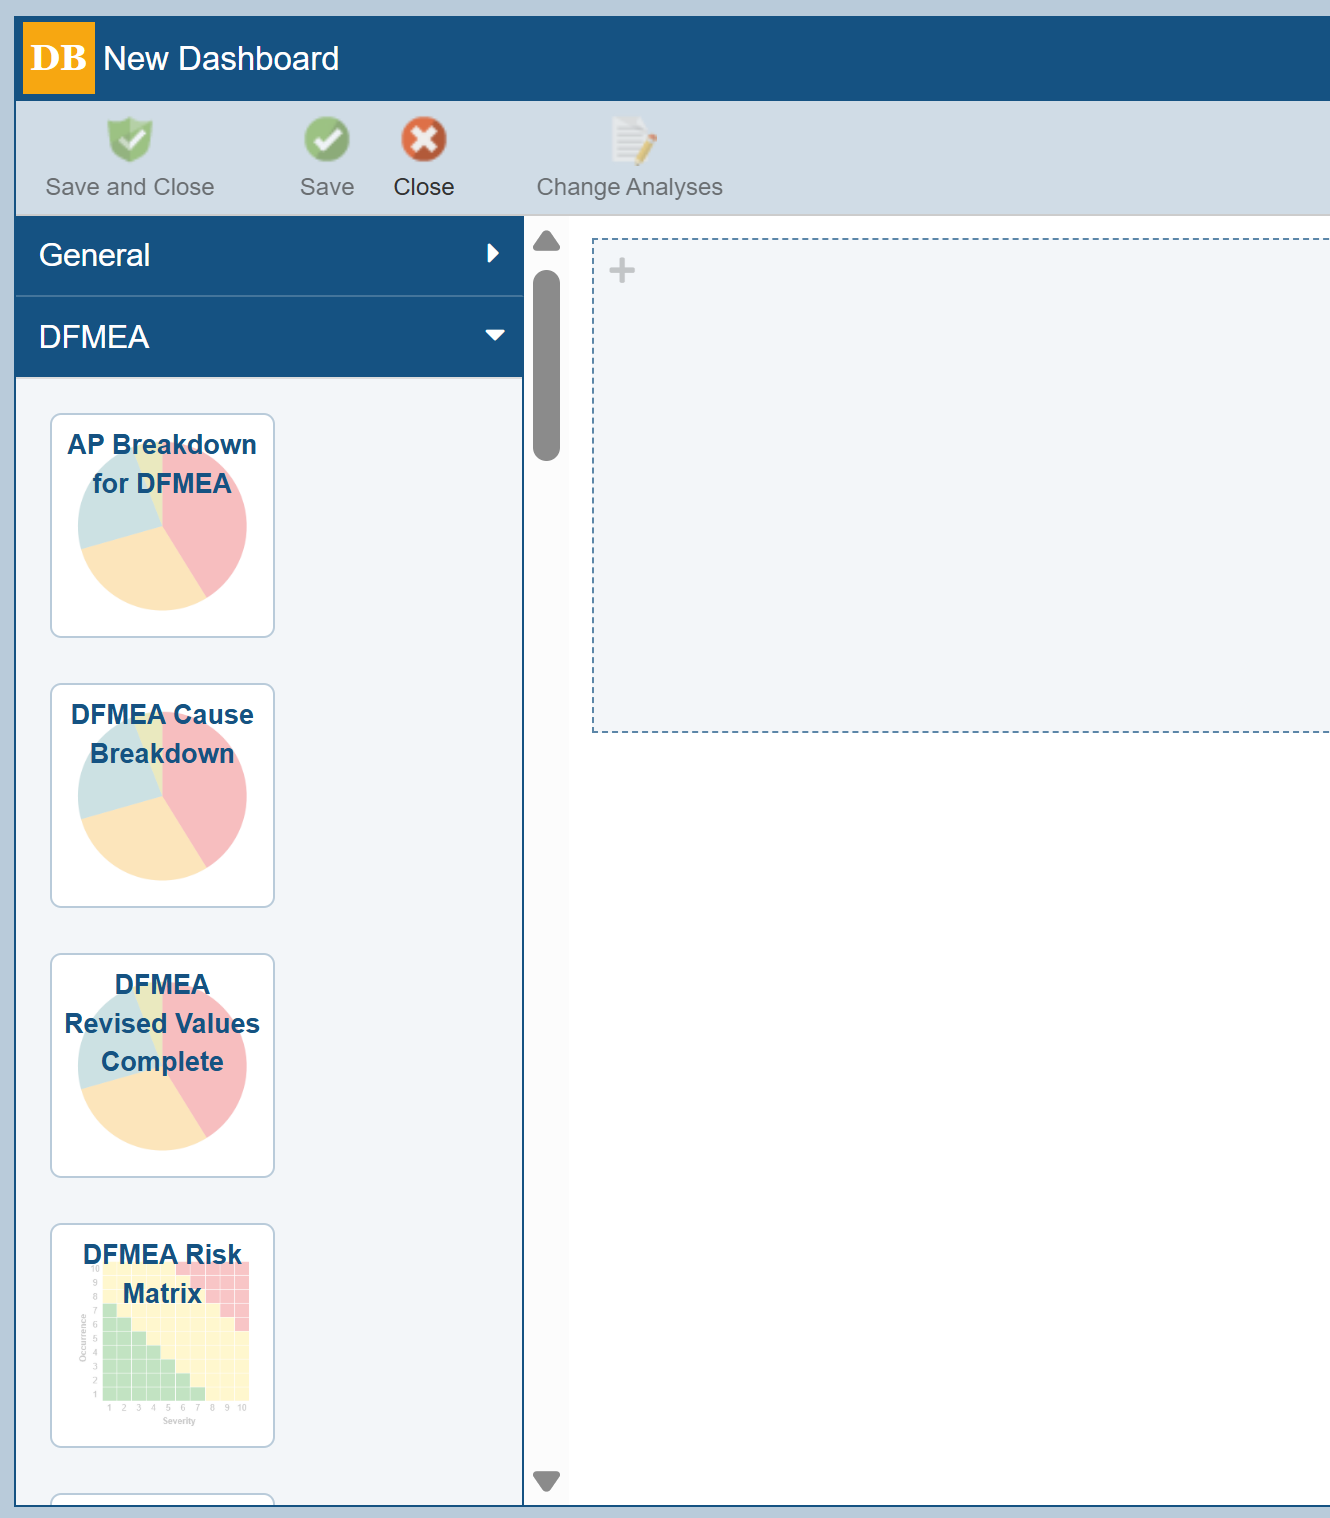
The Dashboard Editor is used to create your Dashboard using a drag-and-drop interface to drag widgets onto your Dashboard. Widgets are graphs, charts, or tables. Available widgets are shown in the Widget Pane on the left of the Dashboard Editor.
For organizational purposes, widgets are grouped based on the Relyence Product they are associated with, and an additional General group that includes widgets that apply to all Products. You can mix and match widgets of any type on your Dashboard; they are grouped simply for organizational ease when building your Dashboard.
2. Add Widgets and set Properties
Make sure the DFMEA widgets are shown by clicking the DFMEA heading in the Widget Pane if necessary.
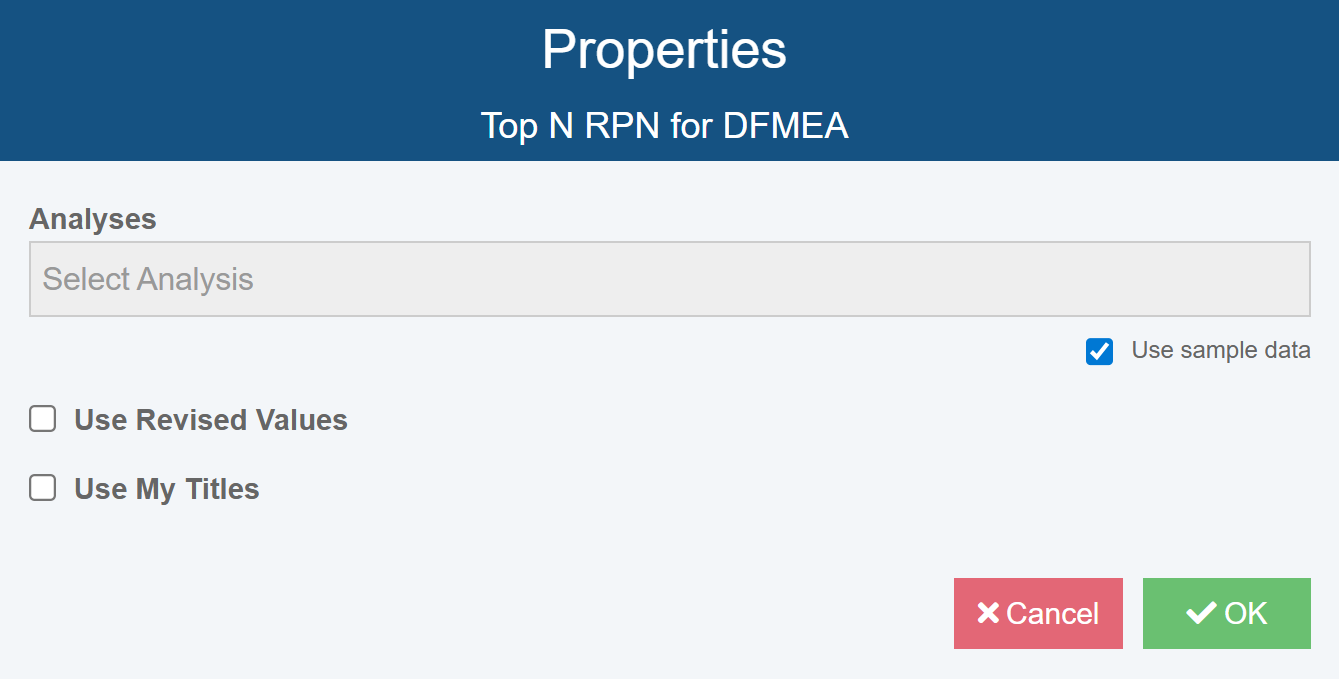
Scroll down in the DFMEA widget list to the Top N RPN for DFMEA widget. Click and hold your mouse down and drag the widget into the empty row at the top of the Dashboard, and then release the mouse to drop the widget onto the Dashboard. Once dropped, the widget Properties dialog appears.
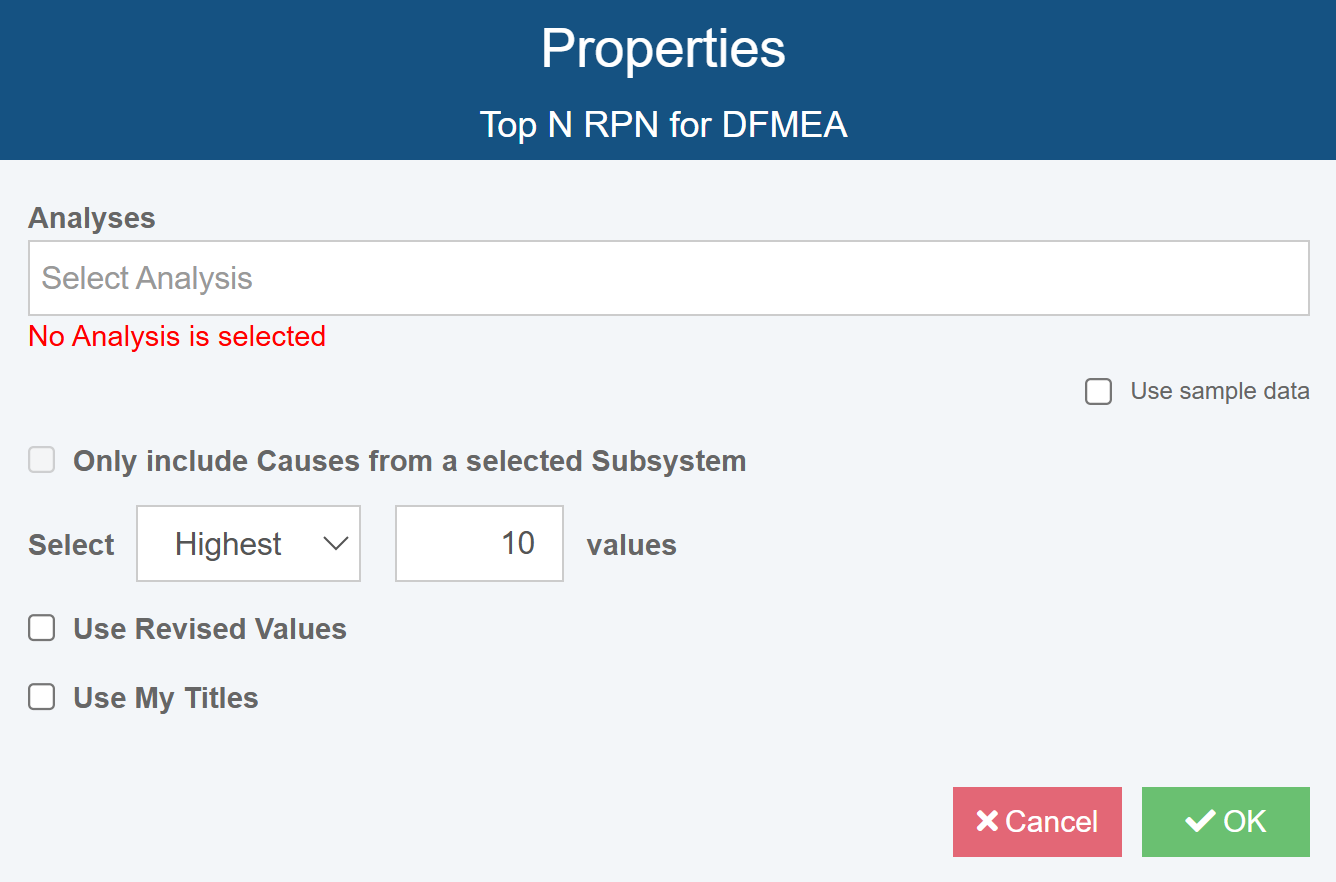
The Analyses field enables you to choose which Analyses to use when rendering this widget. You can include data from a single Analysis or multiple Analyses, including Analysis Revisions and Analysis Tree Revisions.
Note: You can also use the Change Analyses button in the main toolbar for your Dashboard to set the same Analysis or Analyses for all widgets on a Dashboard. This option is defined in more detail later in this topic.
The Use sample data checkbox provides a way to review Dashboard using a sample set of data. This is useful if you are building your Dashboards but do not yet have actual data to use. Once you have Analysis data, the Use sample data checkbox should be cleared.
The Only include Causes from a selected Subsystem checkbox allows you to use the data from a particular Subsystem from a selected Analysis for this widget. This option only is enabled if a single Analysis is selected in the Analyses checkbox. If selected, the Analysis Tree Item Selector will appear so you can select the desired Subsystem. The option to Include children of the selected Subsystem will also be available.
The Select option allows you to specify whether you want to chart the Highest or Lowest RPN values. The values field enables you to specify the number of RPNs to include in the chart. For example, you can use this widget show items with the 5 highest RPN values, or the 20 lowest RPN values.
The Use Revised Values checkbox allows you to indicate that you want to use the Revised Severity, Occurrence, and Detection values.
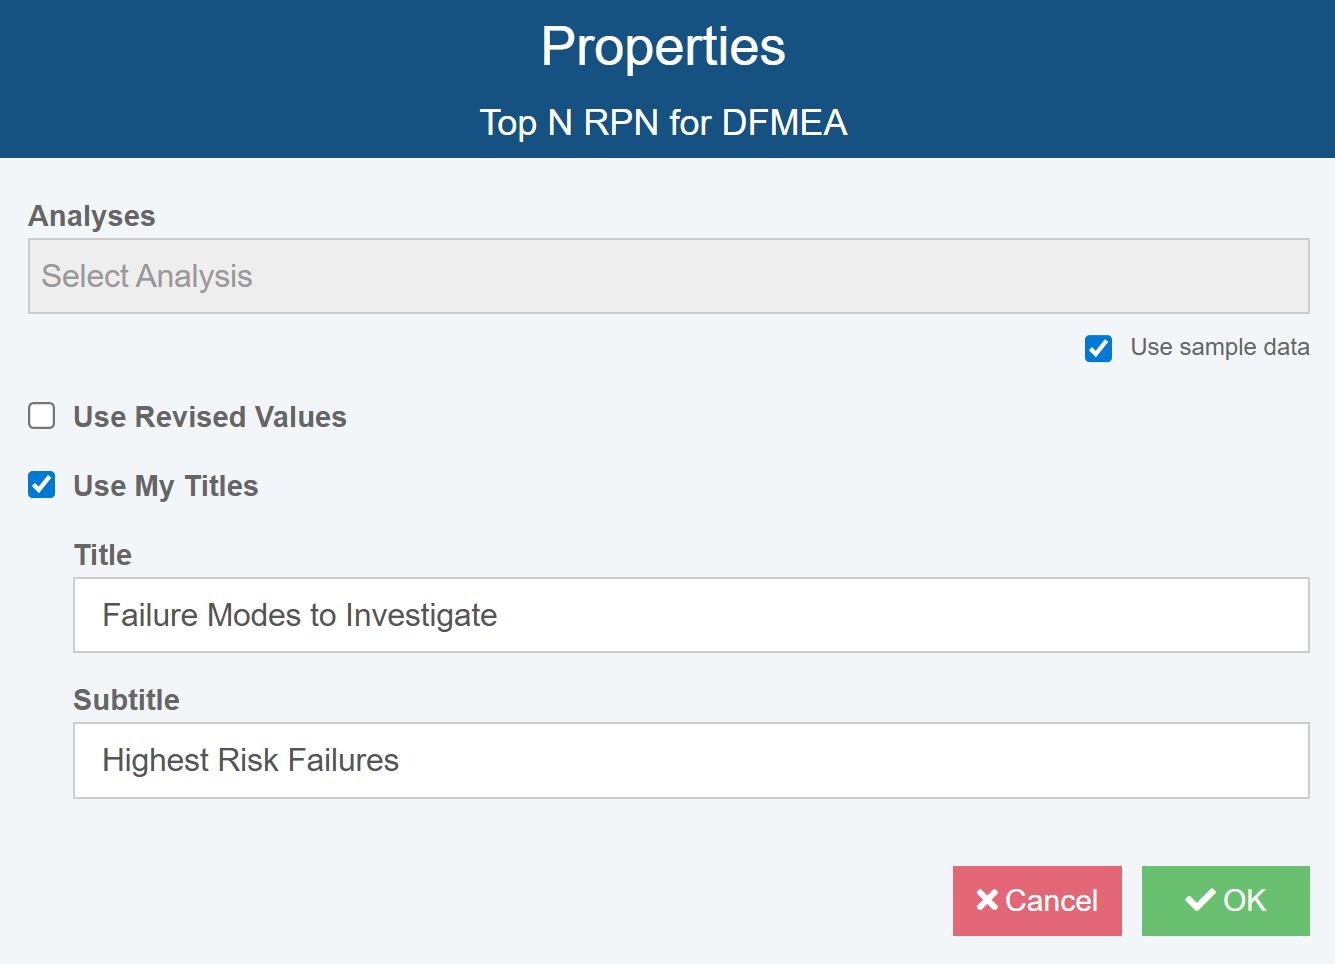
The Use My Titles checkbox enables you to enter your own custom titles for the widget.
For this example, we'll just use sample random data. Select the Use sample data checkbox. The Analyses field will be disabled, and the Only include and Select options will be hidden because they do not apply when using sample data.
Leave the Use Revised Values checkbox cleared.
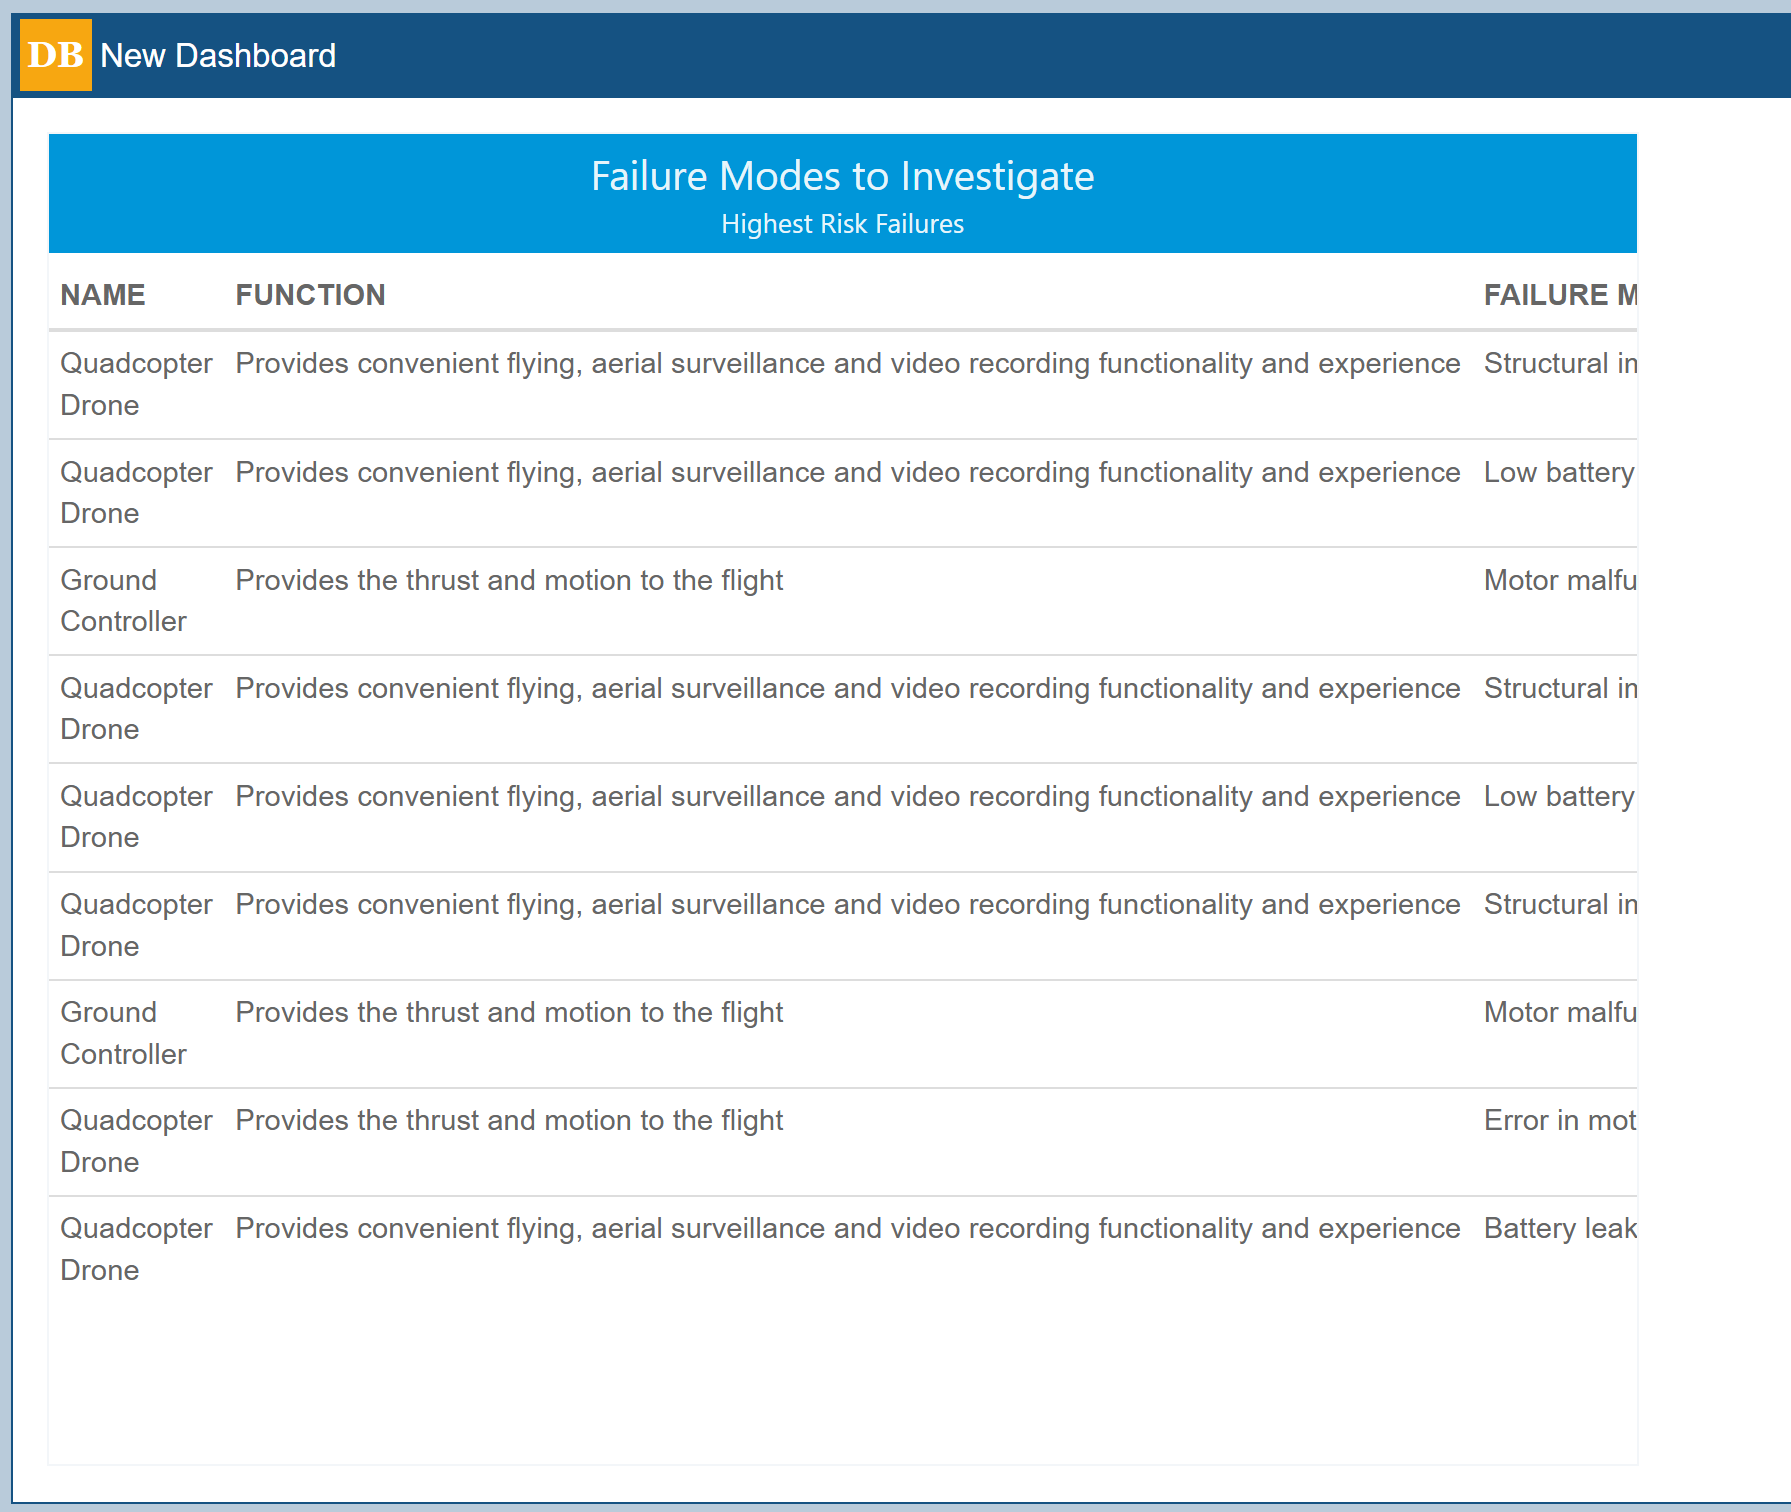
Let's change the default title. All widgets have a default Title and Subtitle set by Relyence. Select the Use My Titles checkbox and enter "Failure Modes to Investigate" for the Title and "Highest Risk Failures" for the Subtitle.
Click OK to save the widget Properties and return to the Dashboard Editor.
Also note the Change Analyses button in the toolbar.
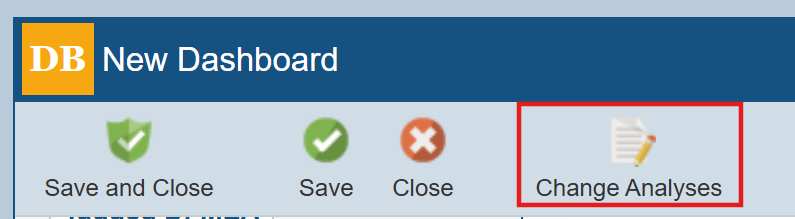
If you want to change the Analyses settings for all widgets on your Dashboard, click Change Analyses.
The Change Analyses dialog appears.
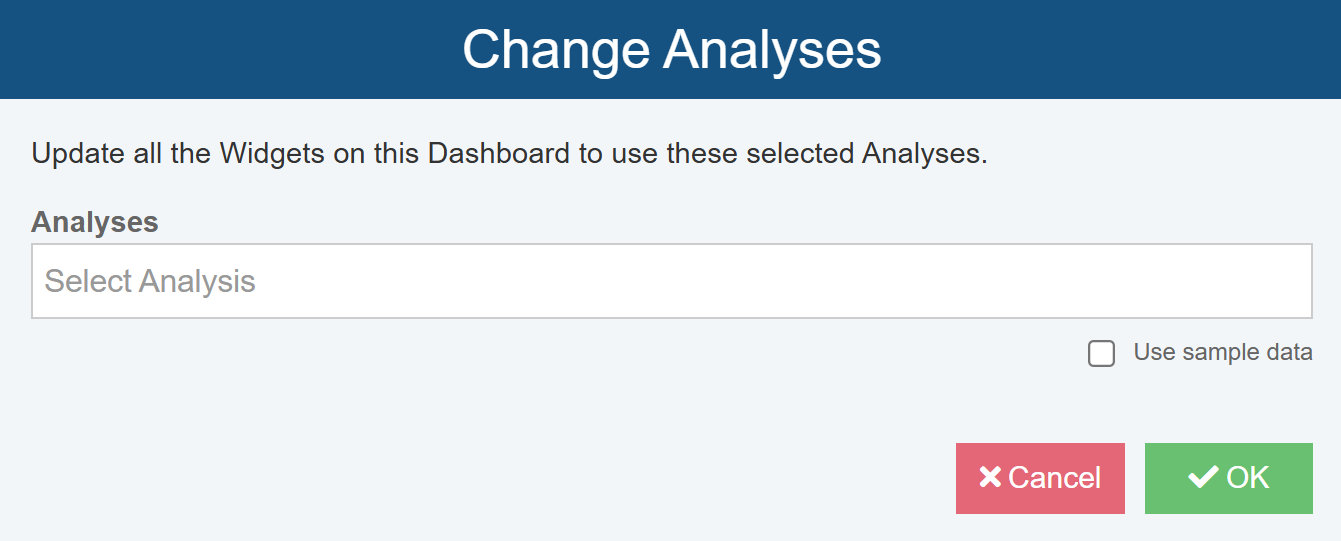
In the Analyses field, you can select the Analysis or Analyses you want to use for all widgets on your Dashboard or opt to Use sample data for all widgets.
As needed, click OK and on the Change Analyses dialog, click Yes if you're sure you want to change the Analysis or Analyses used for all widgets on this Dashboard.
All widgets will have been updated to use the Analysis or Analyses specified on the Change Analyses dialog.
Otherwise, click No and leave the Analyses settings for each individual widget.
3. Changing the Dashboard Layout
When initially dropped onto a Dashboard, new widgets are set to the minimum row height and width.
You can set the rows to be single height or double height. The Row Height icon controls this setting.
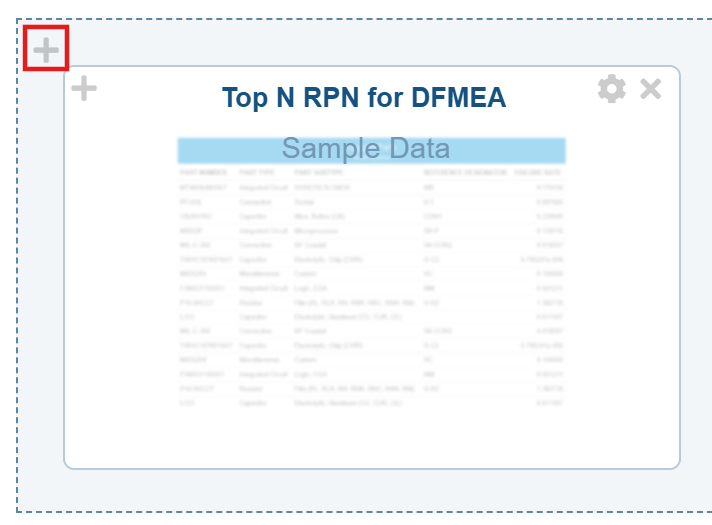
Click the Row Height icon to increase the row height. The row will change to double height and the Row Height icon will change to a minus (-) icon.
You can set the width of a widget to be single, double, triple, or quadruple width. The Widget Width icon controls this setting.
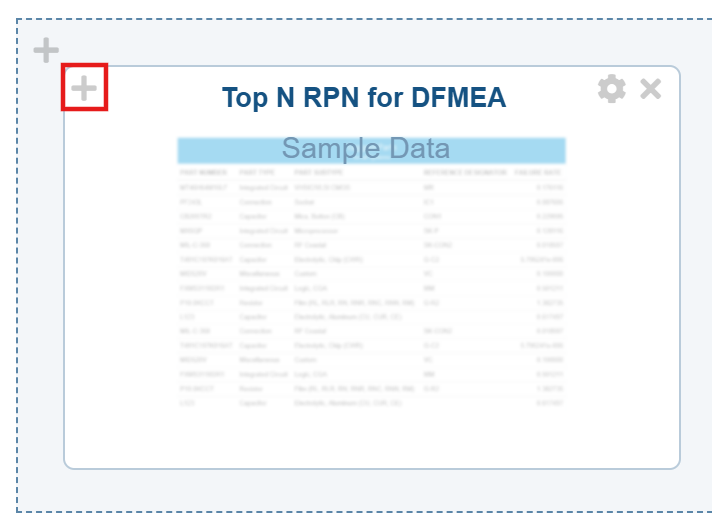
Click the Widget Width icon once to increase to double column width. The Widget Width will change to two icons: a minus (-) to decrease the width and a plus (+) to increase the width. Leave this widget as double width.
The Delete Widget icon allows you to delete a widget.
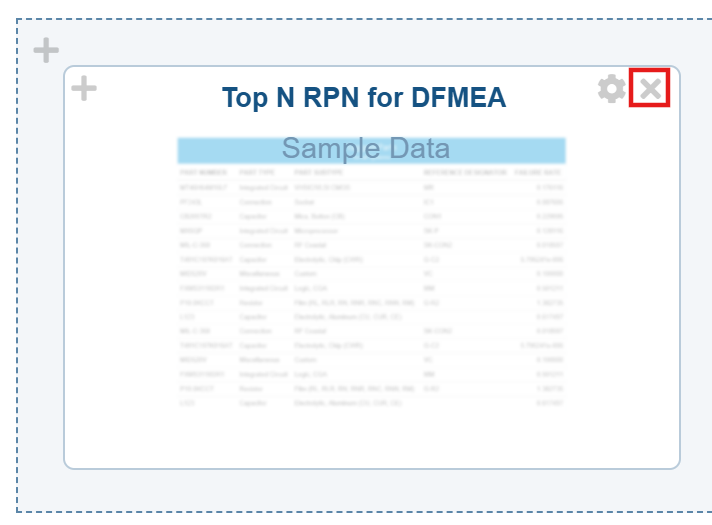
Click the Delete Widget icon. The Are you sure you want to delete this widget? message appears. Click No.
You can access widget Properties at any time using the Properties icon. This brings up the Properties dialog shown previously when first adding the new widget.
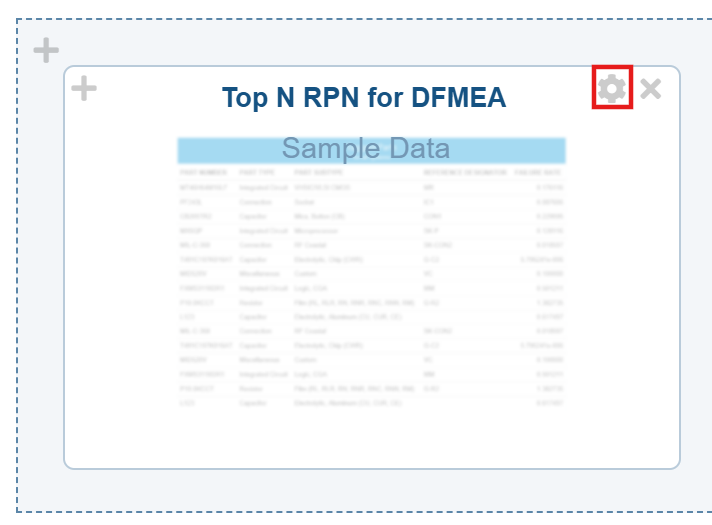
Click the Properties icon to see the settings you entered. Click Cancel to close the dialog.
4. View Your Dashboard
Click the Save and Close from the Dashboard Editor toolbar to save your changes, close the Dashboard Editor, and view your new Dashboard.
Click Customize in the top-right corner to go back into the Dashboard Editor to edit your Dashboard layout or widget properties at any time.