Getting Started with the Relyence Dashboard
If you would like to review a video overview of this Getting Started Guide, go to our online videos for Relyence Dashboard.
Please note that the Relyence Dashboards are available across the Relyence Products. For this Getting Started Guide, we will use Relyence FMEA for our review of Relyence Dashboards.
1. Sign in to Relyence
To begin, make sure you are signed in to Relyence. For details on signing in, see Signing in and Signing Out.
You must have a Relyence account to sign in to Relyence. If you do not yet have a Relyence account, you can register for one for free.
You may possibly see the Announcements dialog when first signing into Relyence. The Announcements automatically scroll, or you can review them using the previous and next arrow keys. For any Announcements you do not wish to see again, select the Don't show me this again checkbox. Once you have reviewed all the Announcements, click the 'x' (Close) button in the upper right corner of the Announcements dialog.
2. Open the Example Analysis
First, let's make sure Relyence FMEA is active.
After you have signed in, you may see a Welcome dialog. If a Welcome dialog does not appear, click Welcome to Relyence from the Help dropdown menu in the upper right of the Relyence header bar.
If you were previously working on an Analysis, you will see the Continue Where I Left Off option at the top of this dialog, otherwise it will not appear. If you are using a Trial version, the Show this page when Relyence opens option will not appear. This option is only available using a licensed version of Relyence.
Click the FMEA tab on the left to activate Relyence FMEA. Then click Open Example Analysis.
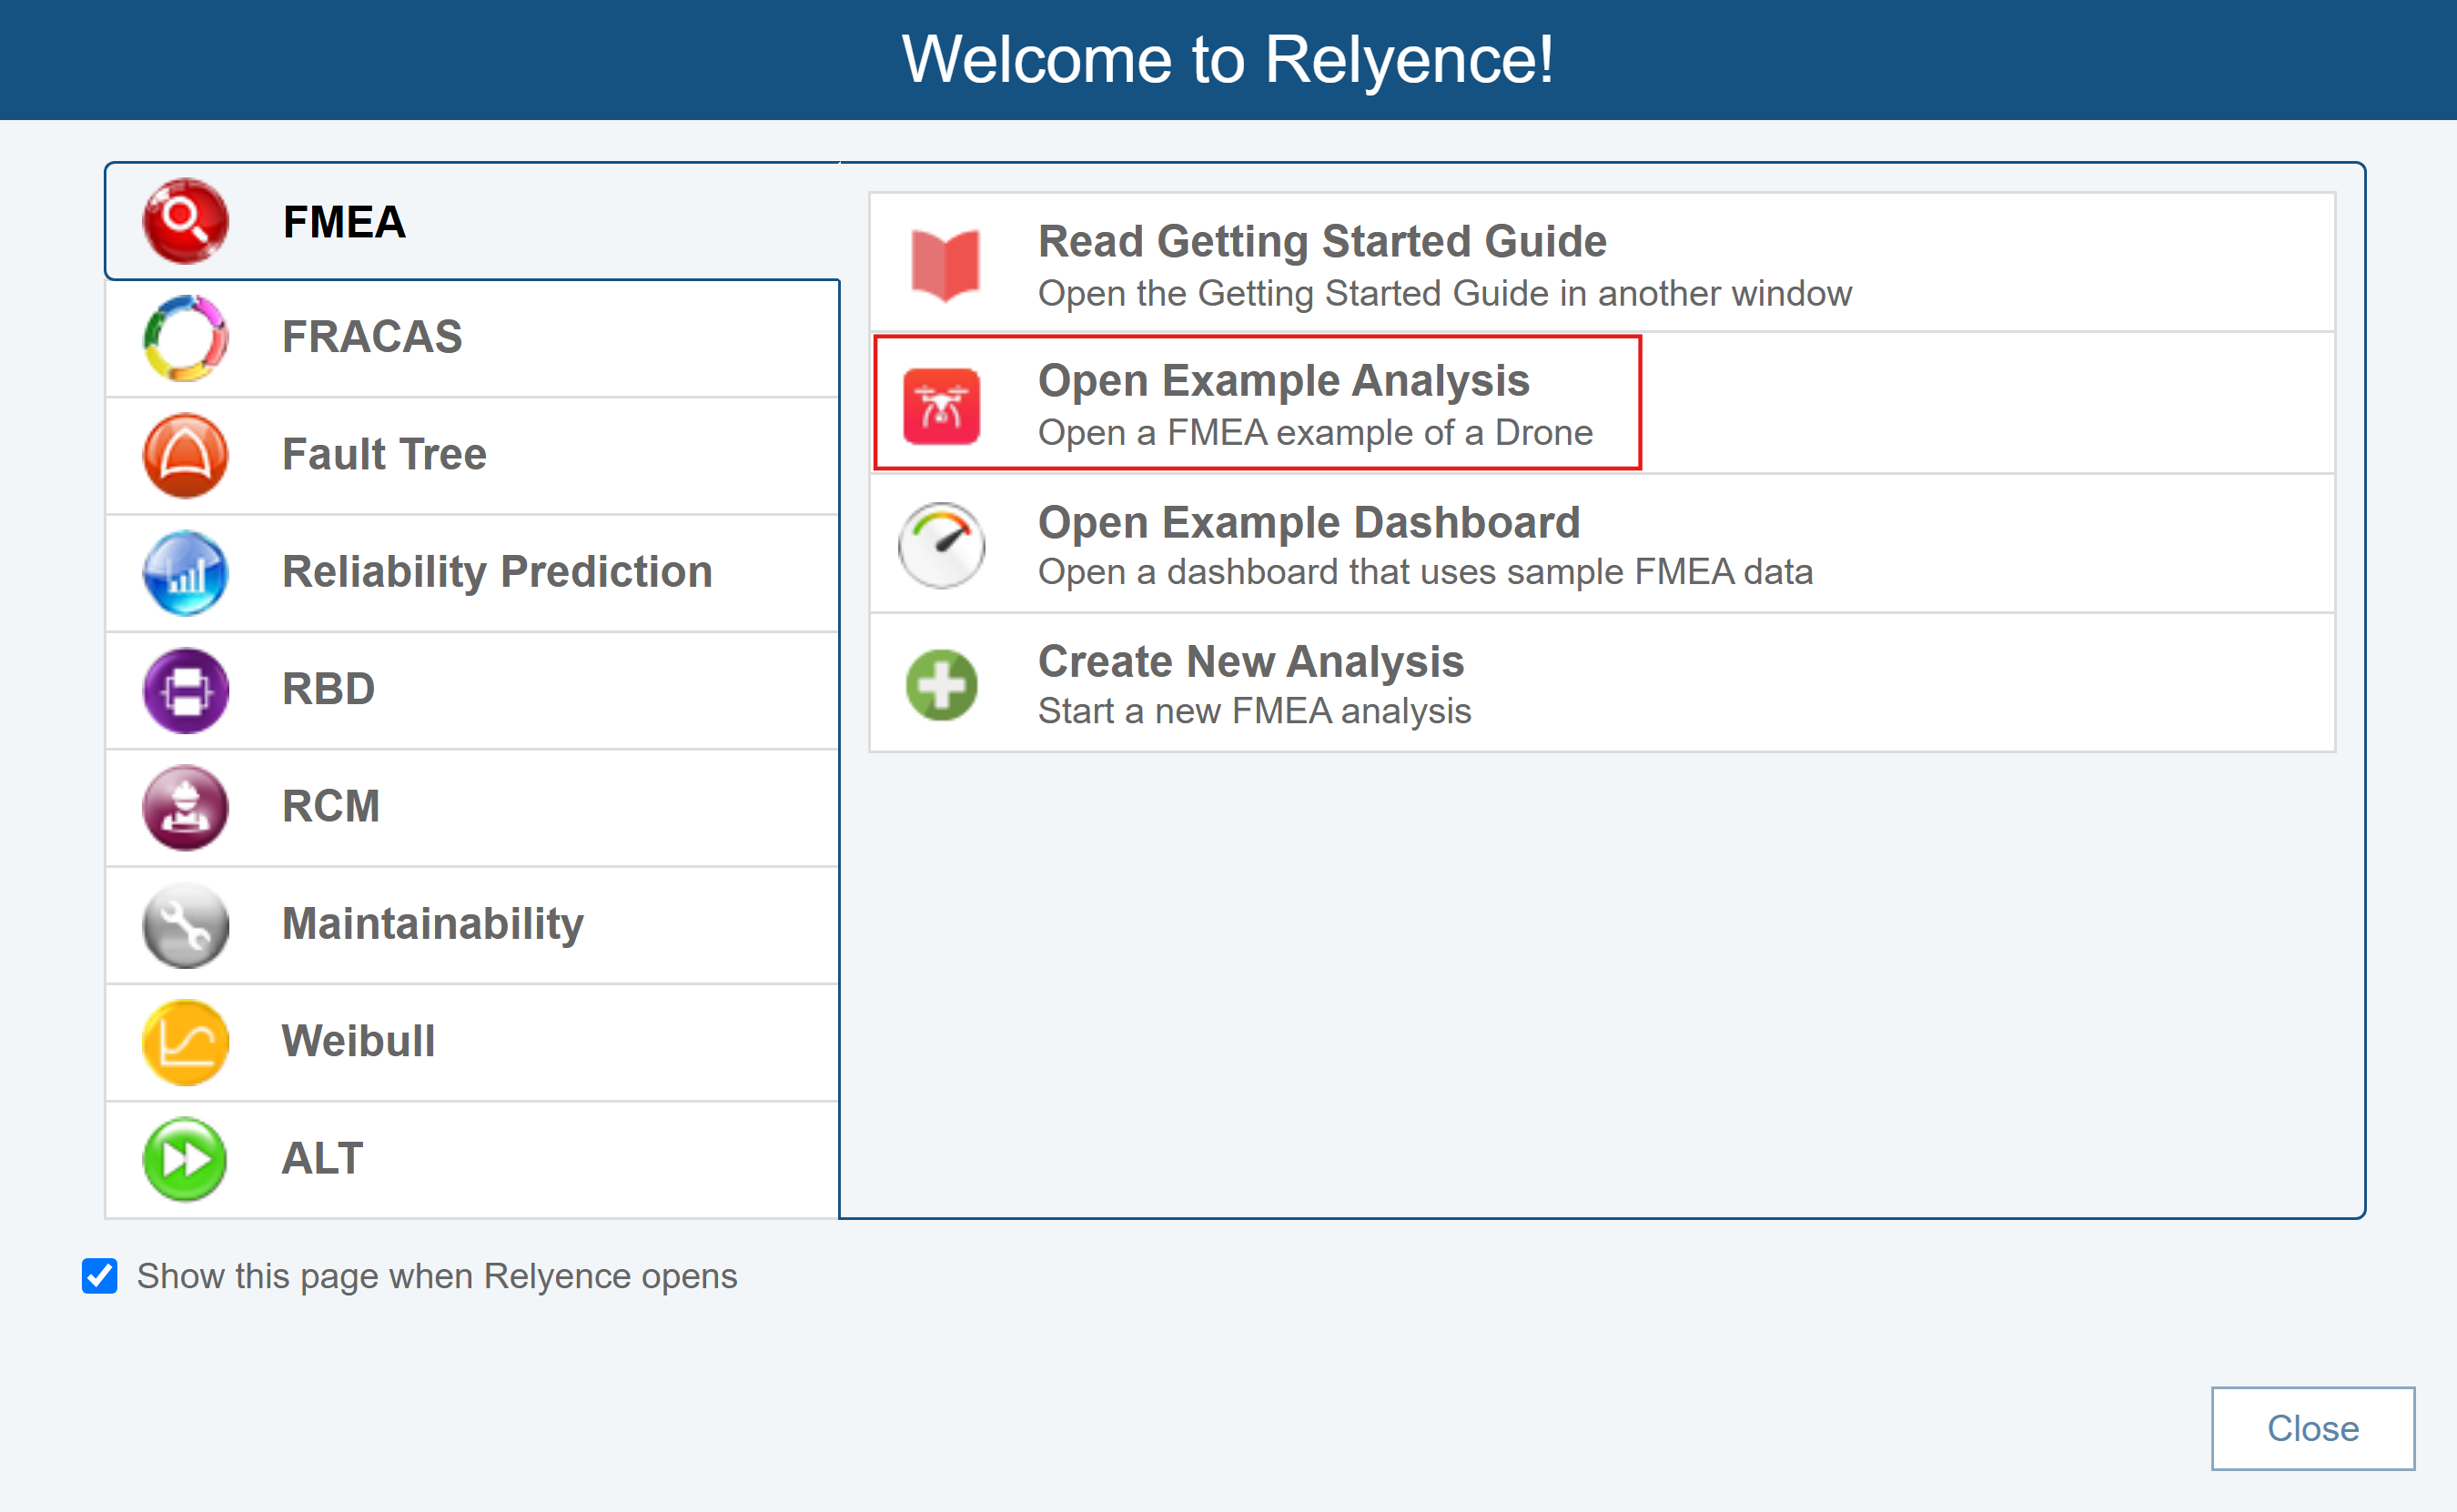
The Drone Example Analysis opens.
We will use Relyence FMEA, the supplied Drone Example, and the FMEA Example Dashboard for this tutorial.
3. Open the FMEA Example Dashboard
Once again, click Welcome to Relyence from the Help dropdown menu in the upper right of the Relyence header bar.
Click the FMEA tab on the left, and then click Open Example Dashboard.
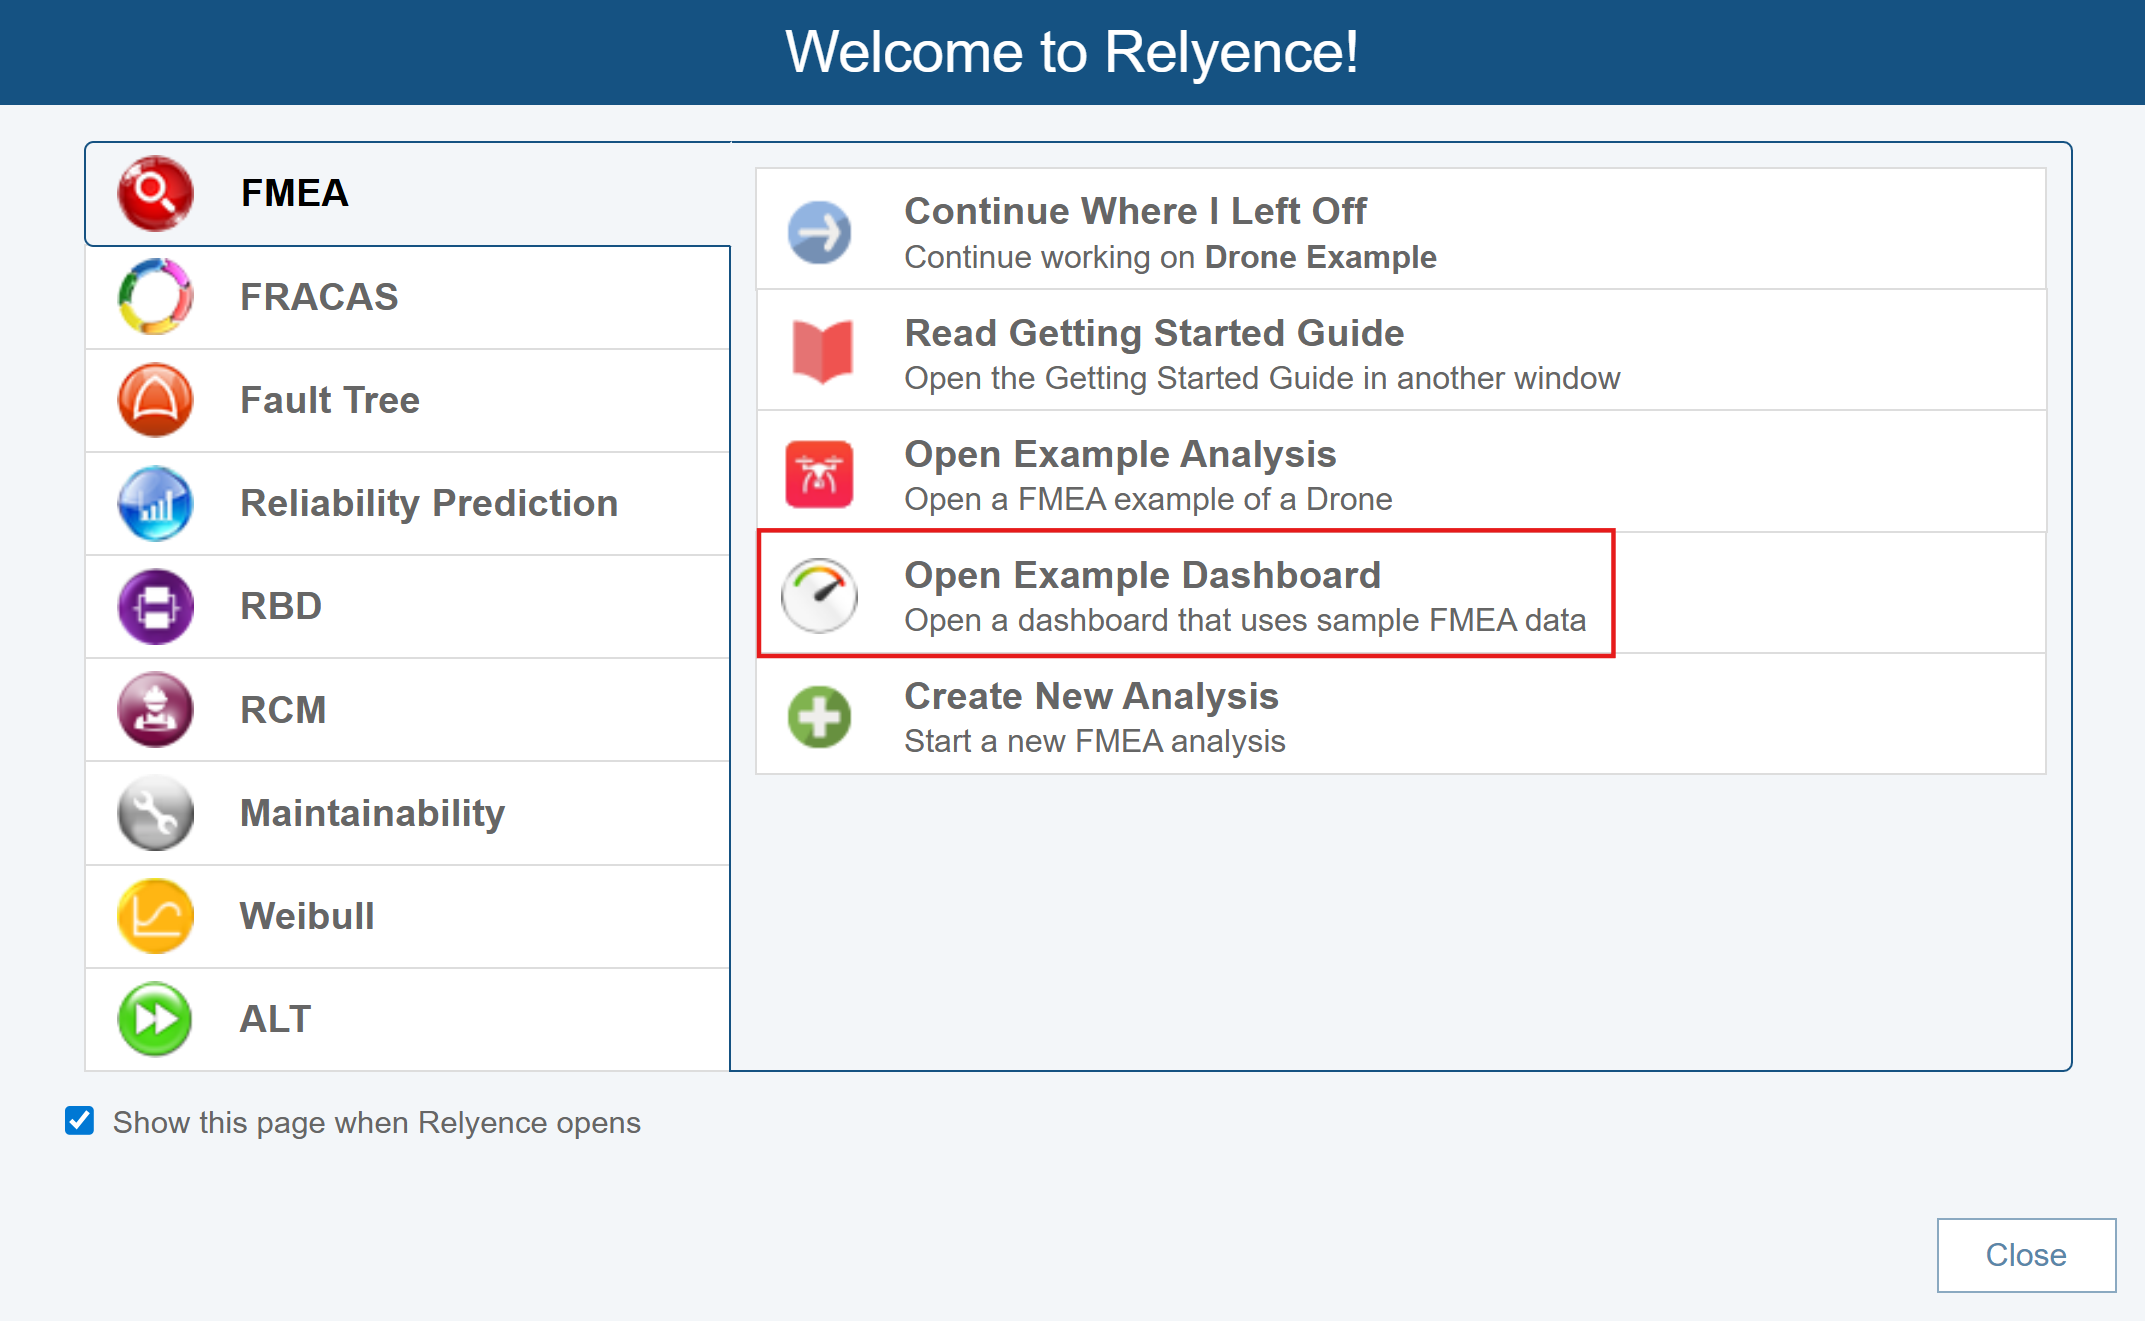
When you open an Example Dashboard for the first time, you will see the Revert Example pop up appear. You are free to make changes and save your changes to the Example Dashboards. If you want to revert to the original Example at any time, click Revert Example. You will get a message asking if you are sure before your changes are discarded. Click Got it! to dismiss the pop up.
For this tutorial, we assume an unmodified original Example is being used. If you are not sure if you are using an unmodified version of the Example, click Revert Example from the Sidebar. You will be asked if you want to lose your changes and reopen the Example in its original version. Click Yes. If needed, click Got it! to dismiss the pop up.
If you continue with a modified version, just be aware that screen shots or other functions may not operate exactly as described in this tutorial.
When complete, your Example Dashboard will appear.
4. Review the FMEA Example Dashboard
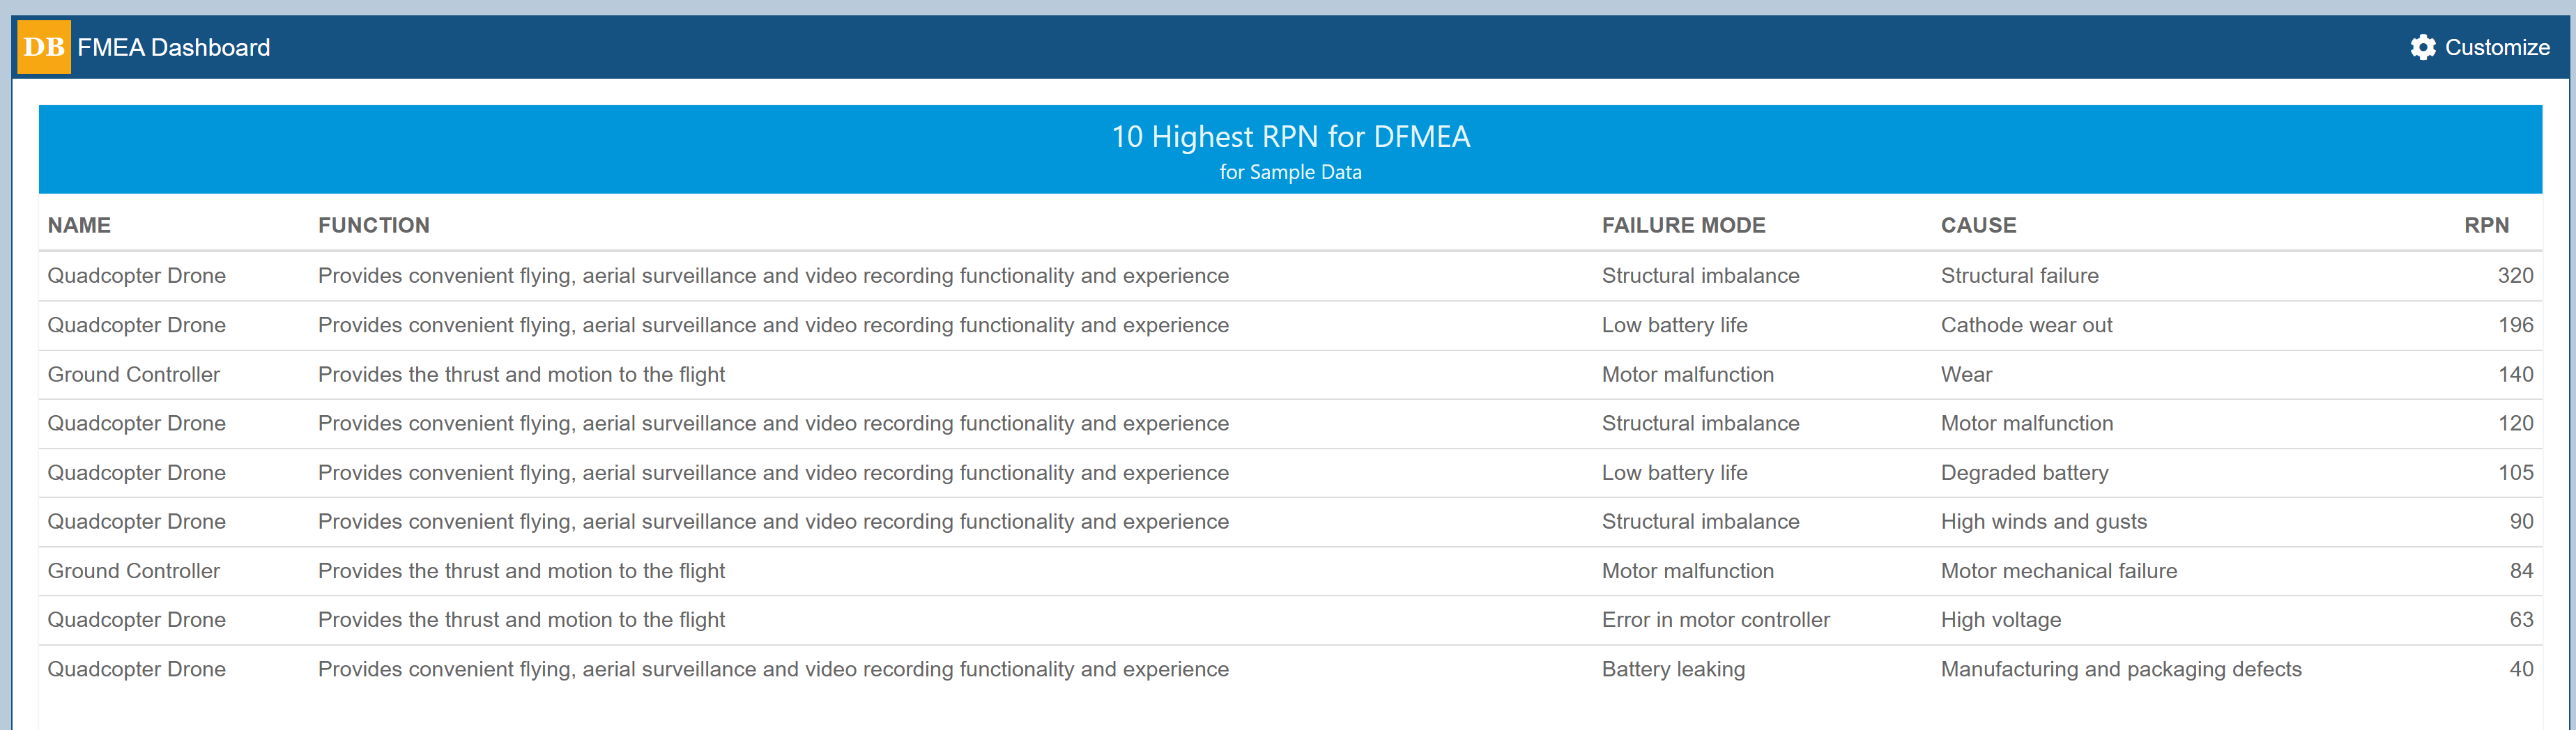
The FMEA Example Dashboard will appear similar to the view below.
(Note: Example Dashboards use a sample set of data; they are not based on data from an Analysis.)
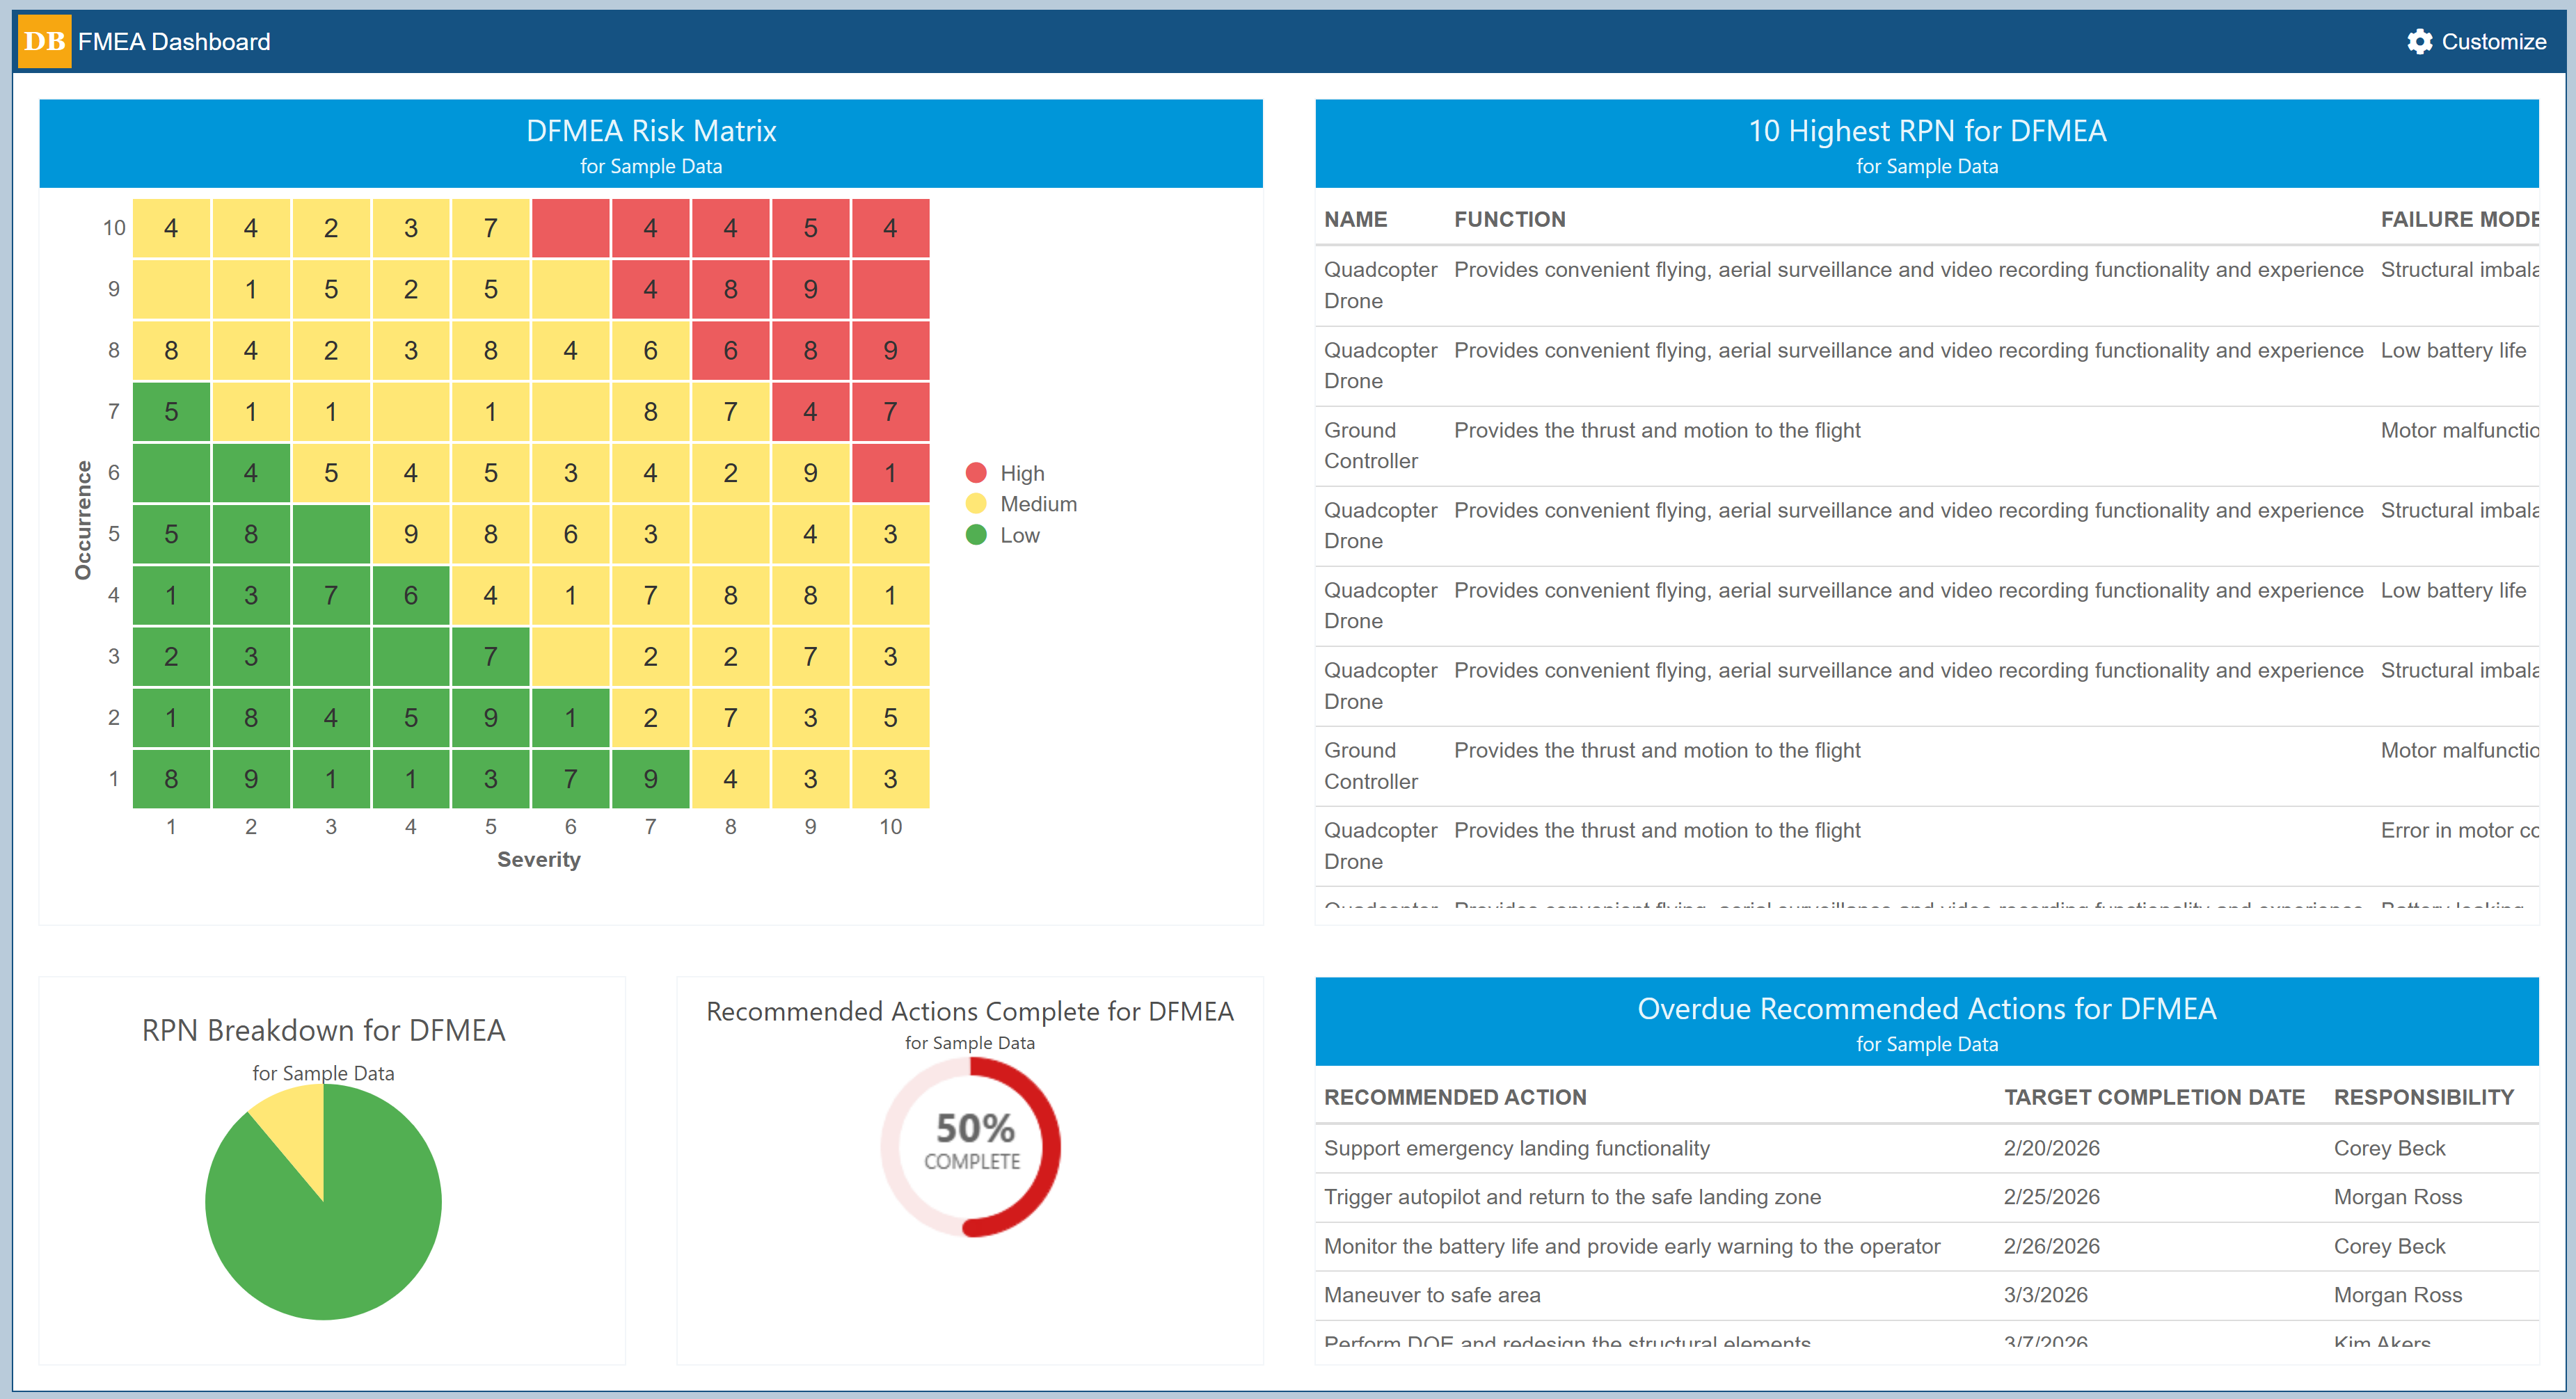
In this dashboard, you can see there is a variety of information presented. This example uses random sample data.
Each element on the dashboard is referred to as a widget. Widgets can be tables or a variety of charts, such as pie charts, line graphs, bar graphs, and gauges.
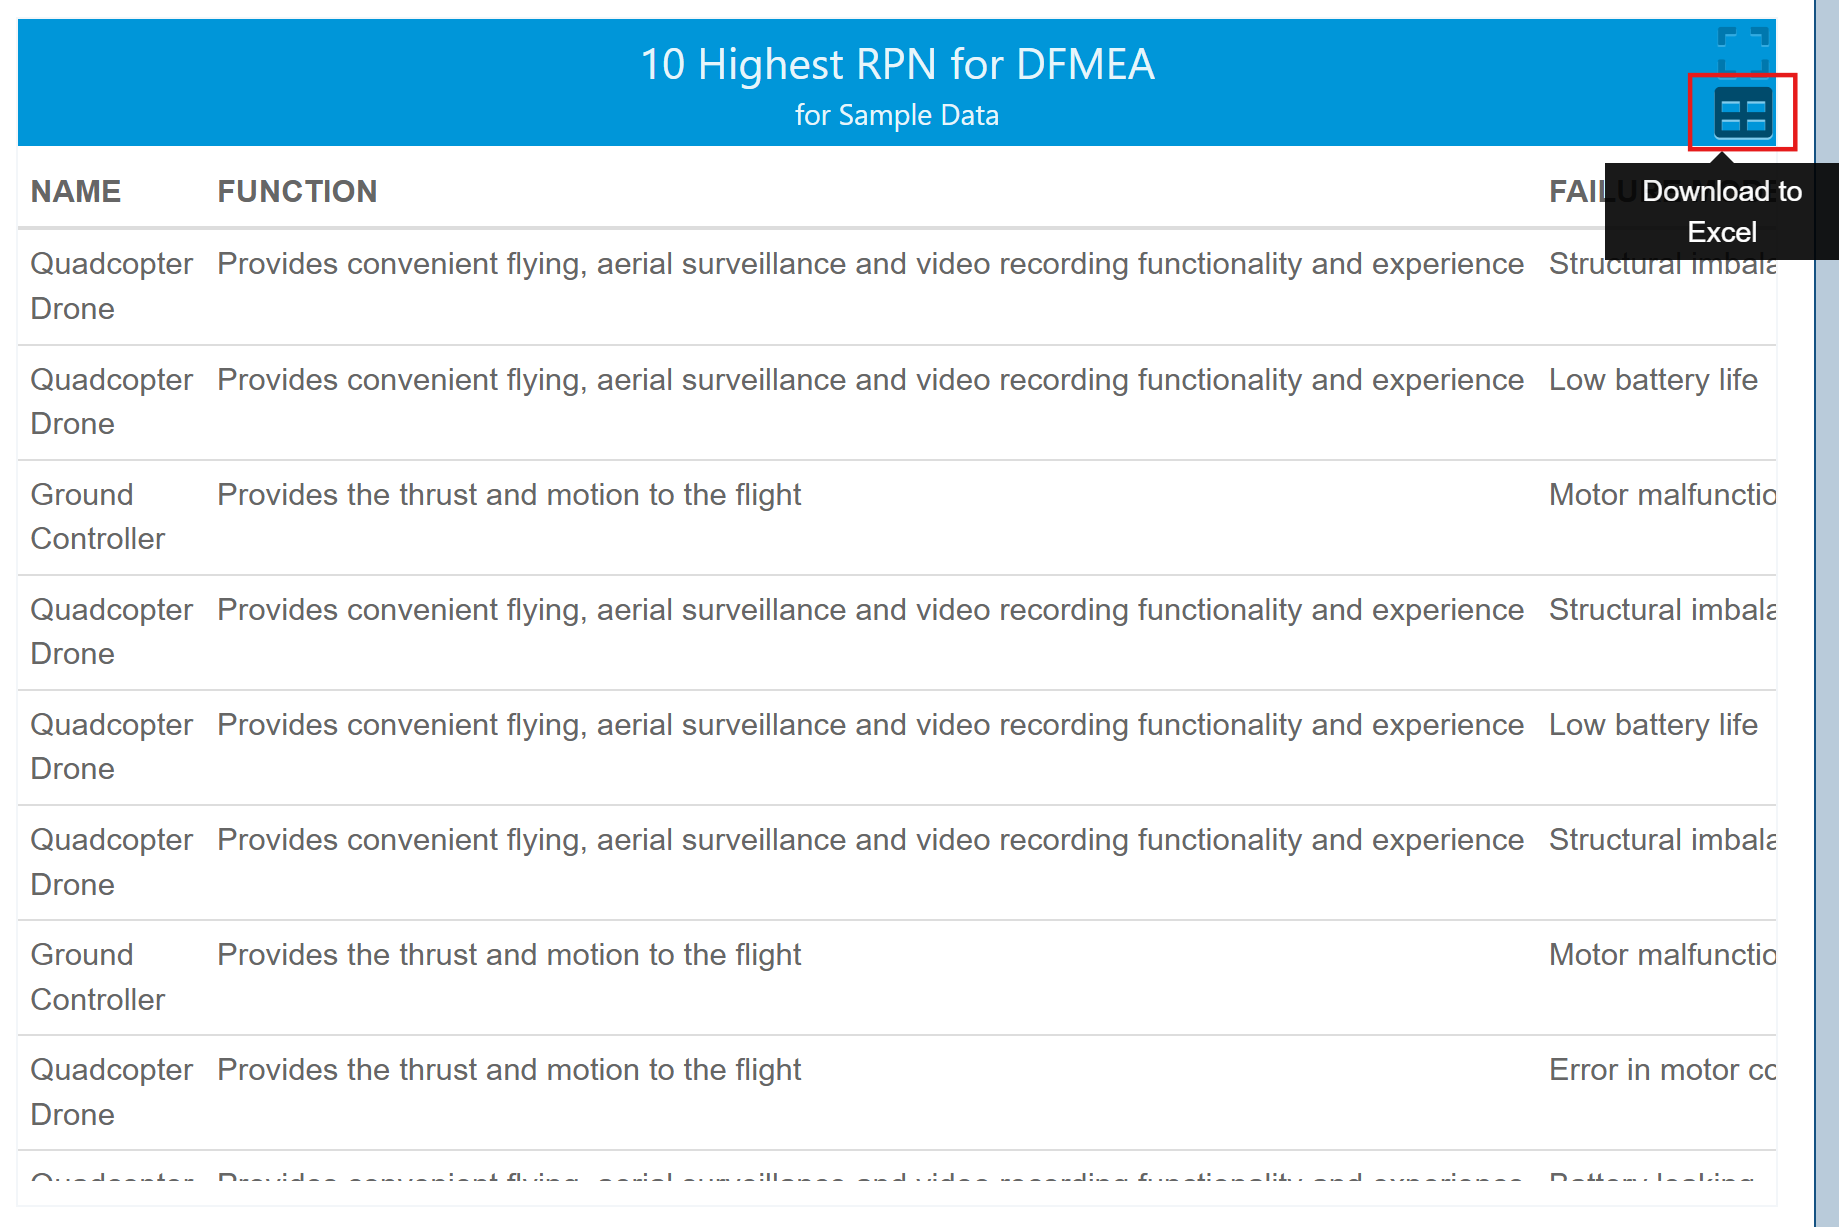
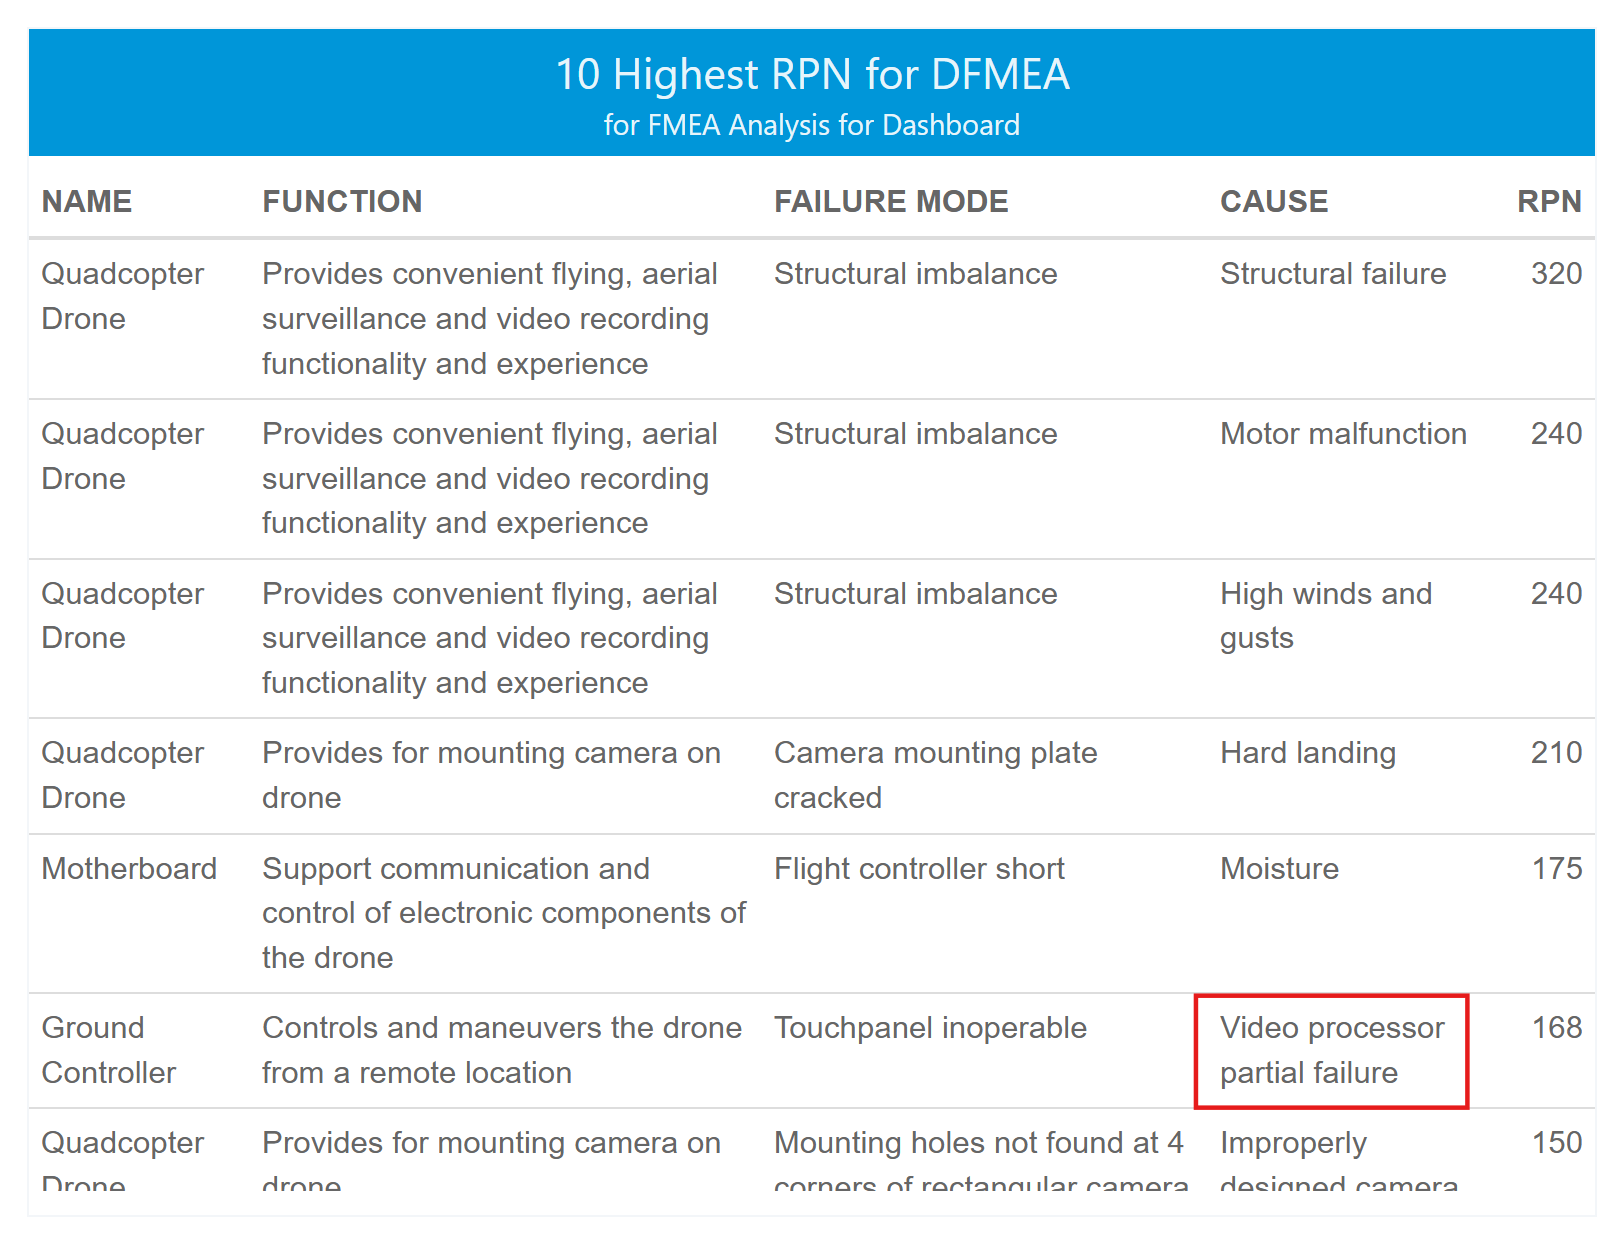
Any widget on the Dashboard can be maximized for full-screen viewing. With your mouse, hover over the upper right corner of the 10 Highest RPN for DFMEA widget until the Maximize/Minimize icon appears and is enabled. Click the Maximize/Minimize icon.
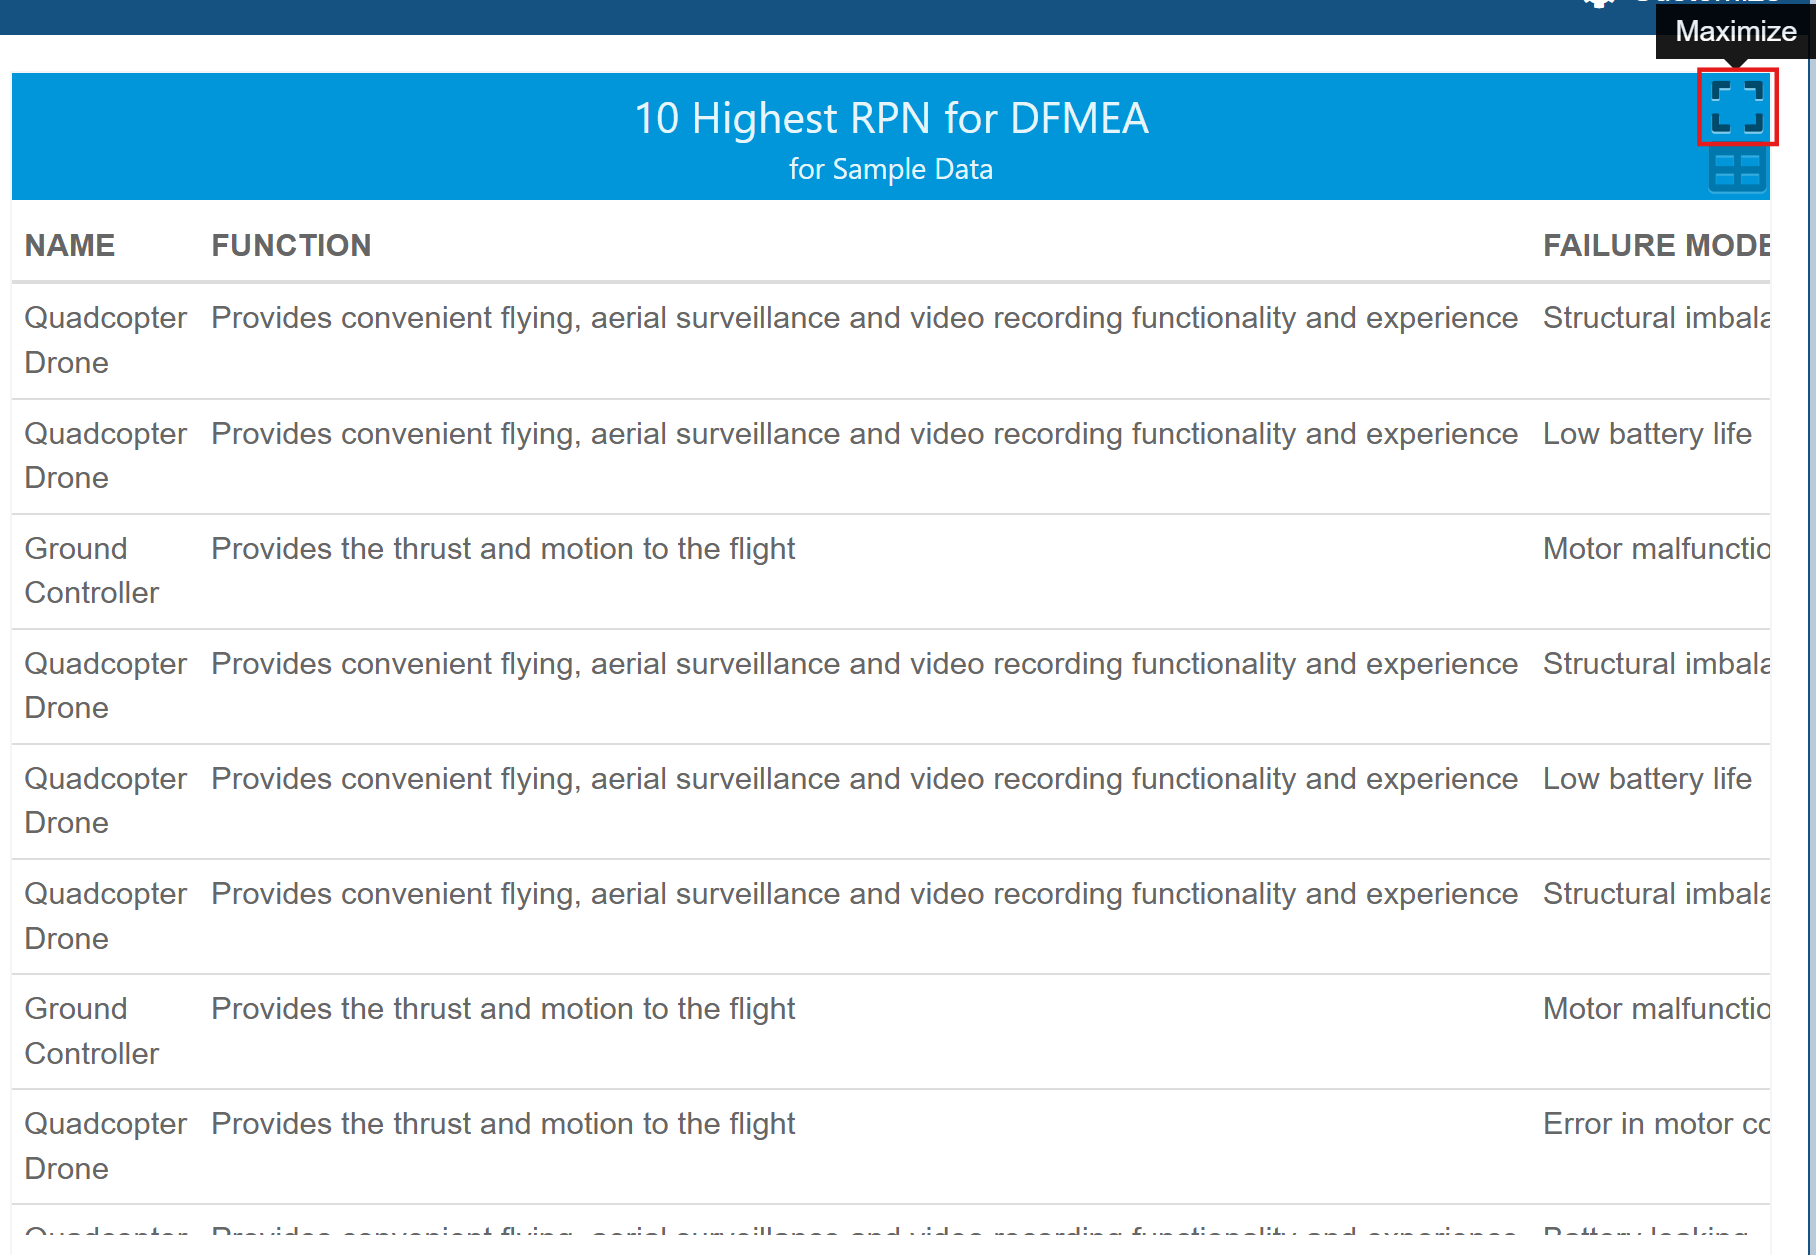
The 10 Highest RPN for DFMEA widget is maximized to full screen. (Note: your data may be different than the image below.)
Click on the Maximize/Minimize button in the top-right corner of the blue title bar to resize the widget and return to the Dashboard view.
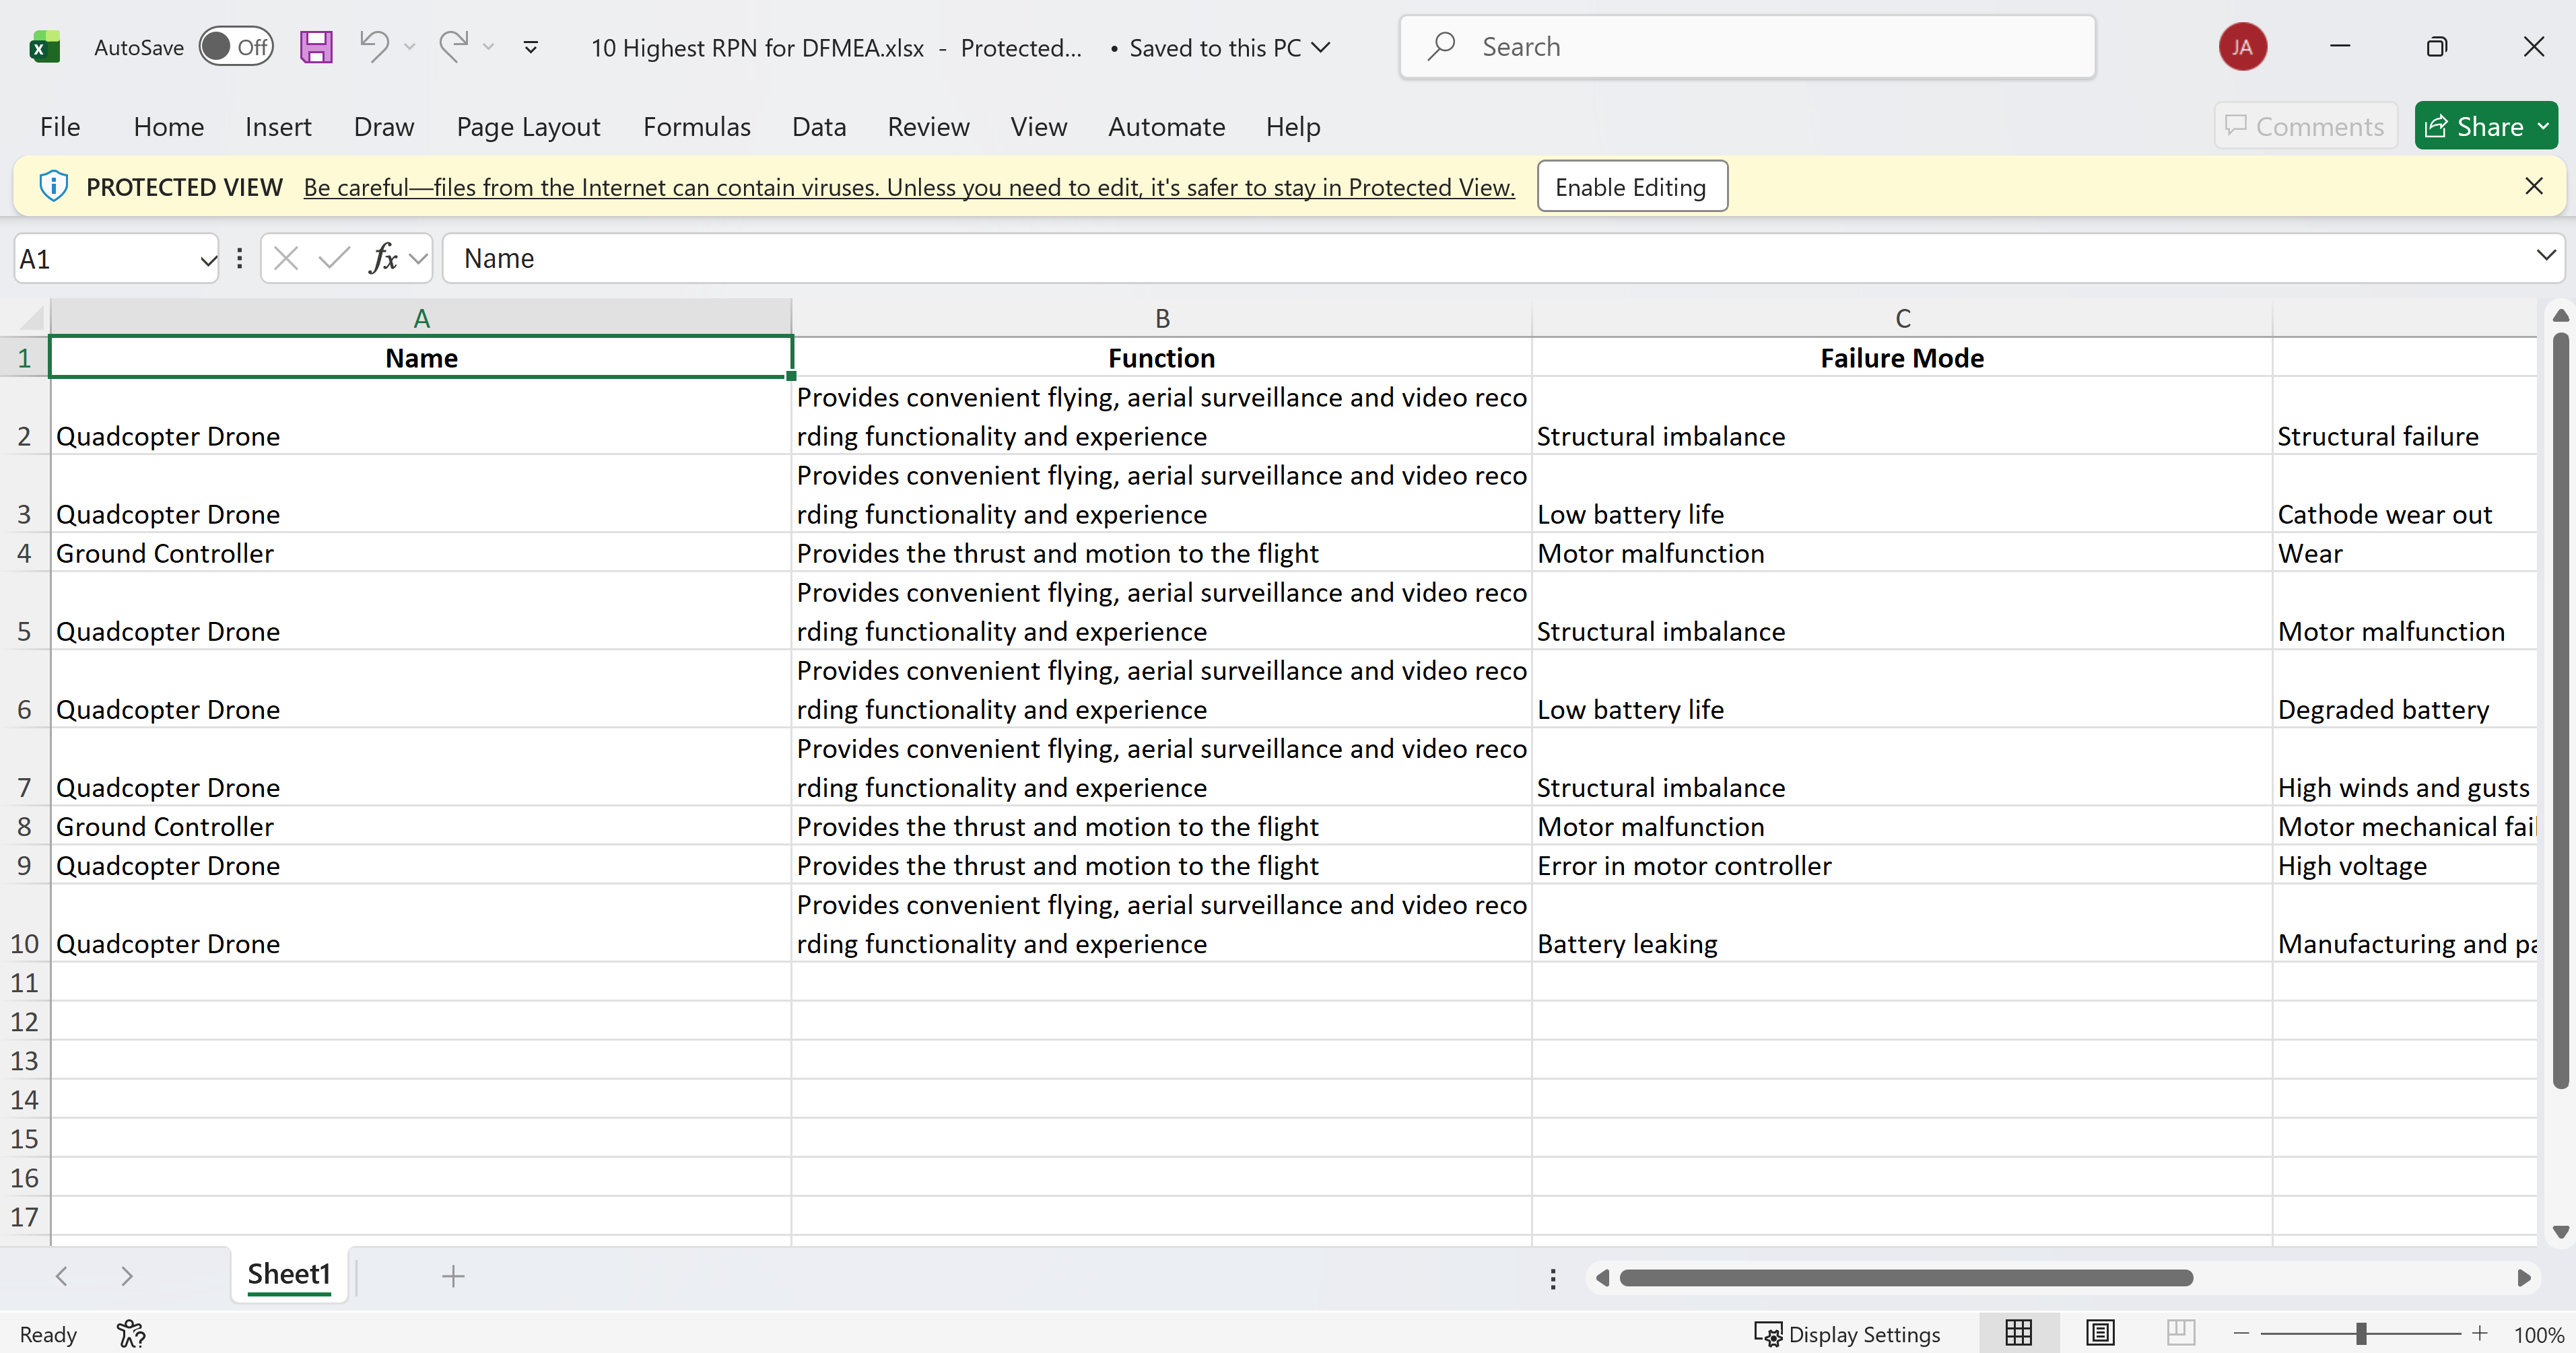
You can export tabular dashboard widgets to Excel. With your mouse, hover over the upper right corner of the 10 Highest RPN for DFMEA widget until the Download to Excel icon appears and is enabled. Click the Download to Excel icon to export the data to an Excel spreadsheet.
An Excel file will be automatically generated and downloaded to your default download directory. The widget title is used as the Excel filename. (Note: your data may be different than the image below).
Dashboards are completely customizable, so the look and feel, as well as the data presented, can be set up however you would prefer. For details on all the customization capabilities, review Customizing the Relyence Dashboard.
5. Drilldown
Relyence Dashboards support drilldown so you can view the underlying data that is presented in the charts and tables.
In the 10 Highest RPN widget, click on the Function in the first row. The Drilldown dialog appears.
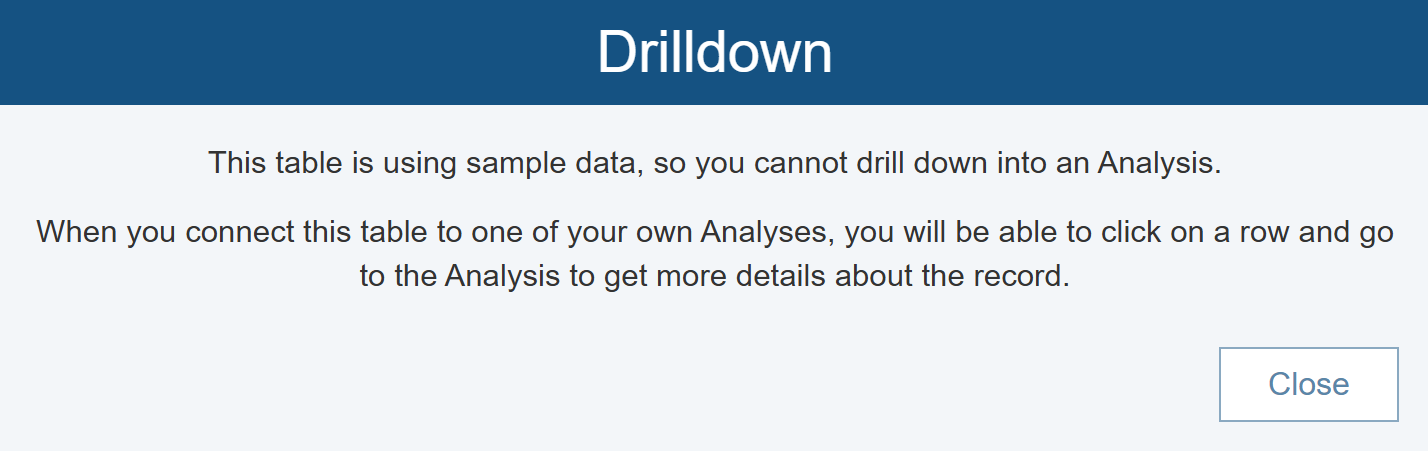
In this case, we are viewing sample data, so there is no way to drill down because there is no actual Analysis data being used. Click Close to dismiss the message.
Let's change the widget so it is based on actual Analysis data. To do this, we need to create an Analysis with data in it. We'll do this by creating an Analysis based on an Example Analysis supplied with Relyence that includes pre-populated data.
From the Sidebar, click View All. The View All dialog appears.
Click the Create toolbar button and then New. The Create New dialog appears.
For I want to create a new, select Analysis.
Enter "FMEA Analysis for Dashboard" for the Name.
If the Create in option appears, choose Analyses to add the Analysis at the top level or any custom Folder to add to that Folder.
For ease for this tutorial, we will create an Analysis based on our Drone Example in order to have some data already populated for use in the Dashboard. Select Create based on an existing Analysis. For the Analysis to use as basis, select Drone Example from the dropdown list. Select Copy data to copy the data from the Drone Example to our new Analysis.
Make sure the Read-only and Log changes in Audit Trail (if available) options are clear.
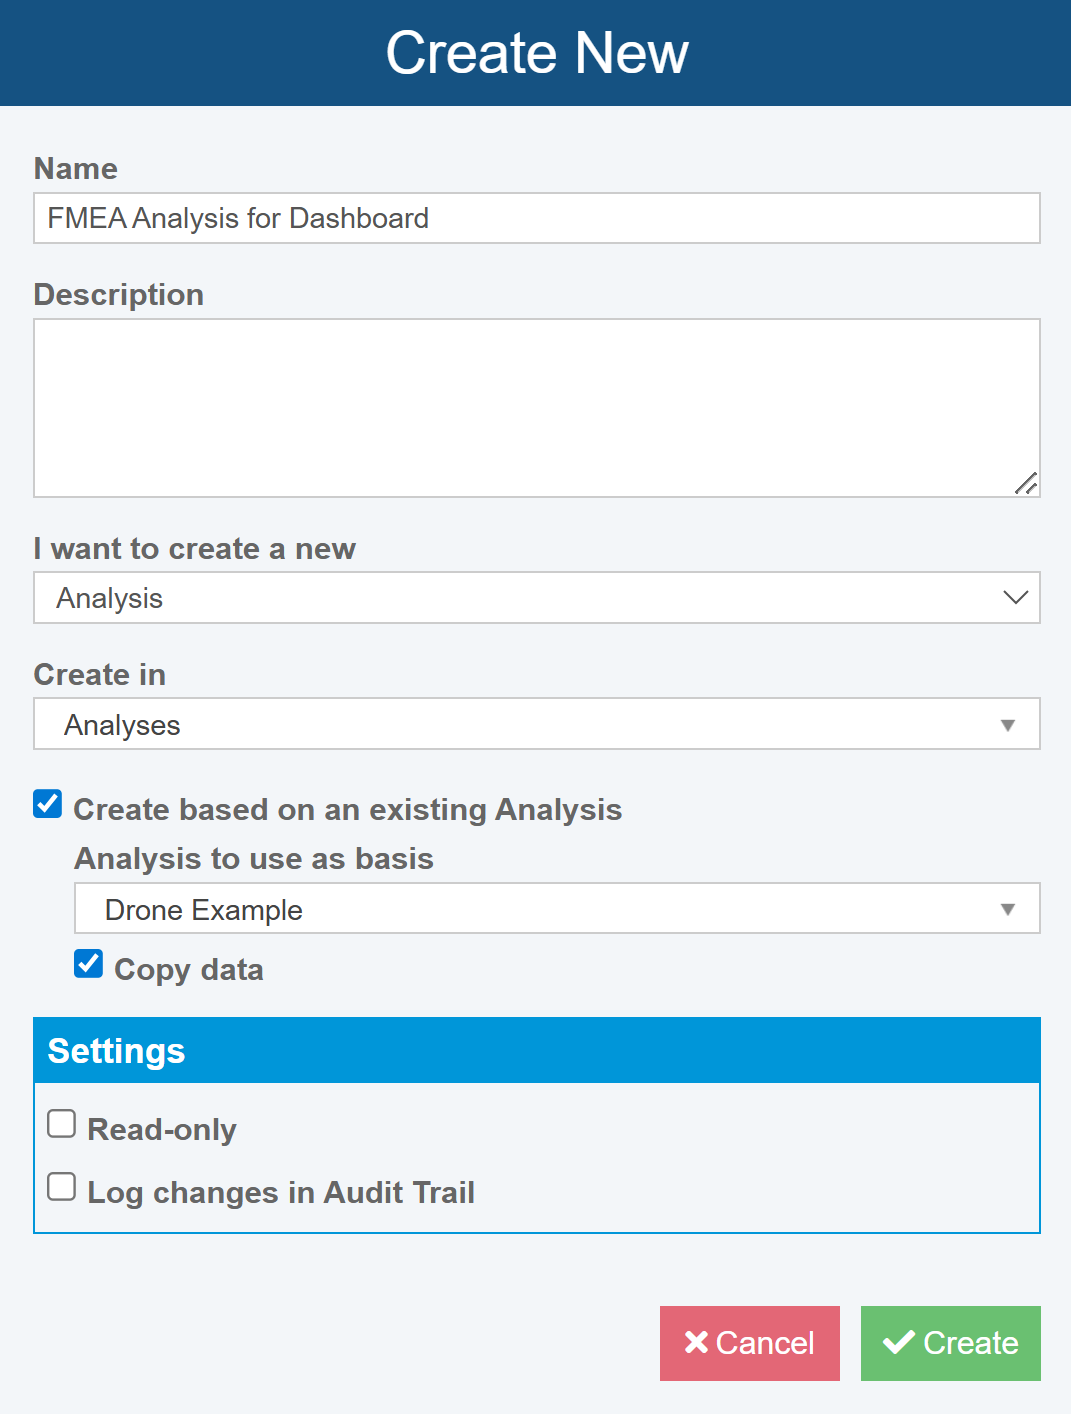
Click Create to create the new Analysis.
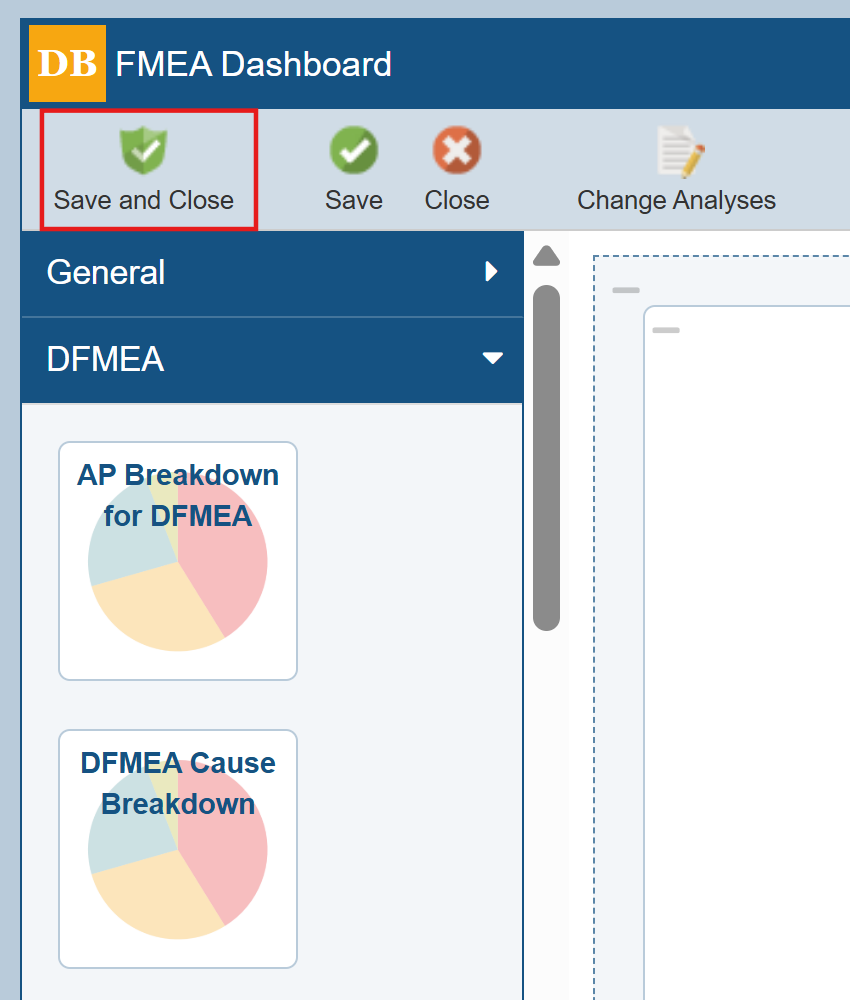
Your new Analysis will be opened and displayed. Click Back to Dashboard in the Sidebar to return to the Dashboard.
Now, let's set the 10 Highest RPN for DFMEA widget to look at our new Analysis data instead of using random sample data.
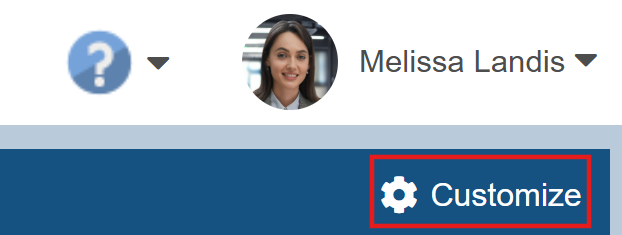
Click on Customize in the upper right corner of the Dashboard.
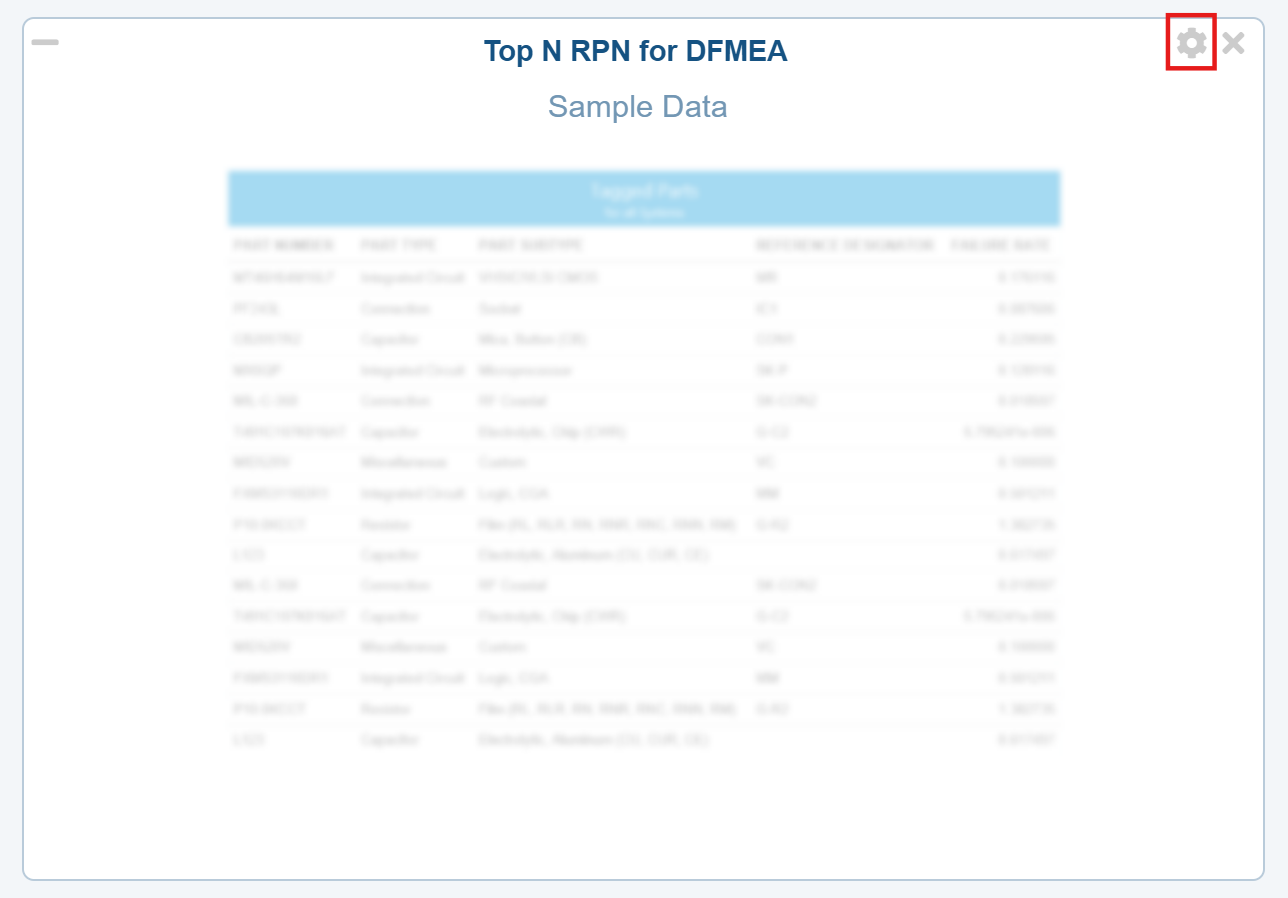
The Dashboard Editor appears. The Editor allows you to make modifications to your Dashboard. For now, we are just going to make a minor change to enable drilldown to function.
In the Dashboard Editor, in the upper right corner of the Top N RPN for DFMEA widget, click the Properties icon.
The Properties dialog appears. Clear the Use sample data checkbox. Click in the Analyses field and select "FMEA Analysis for Dashboard" from the dropdown list. Leave the remaining selections with their default settings.
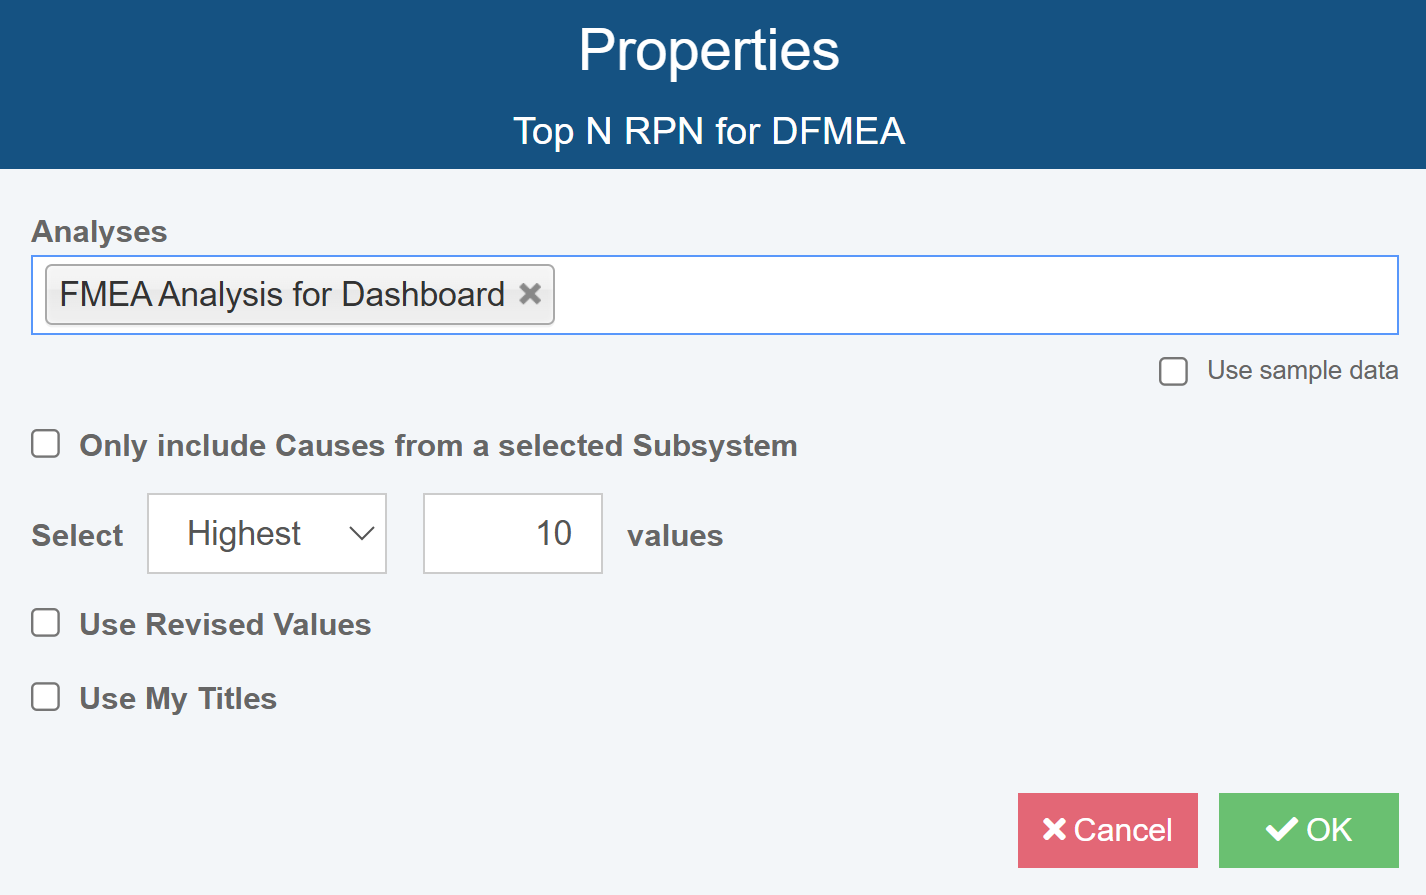
Click OK.
In the upper left corner of the Dashboard Editor, click Save and Close to save your changes, close the Dashboard Editor, and return to the Dashboard.
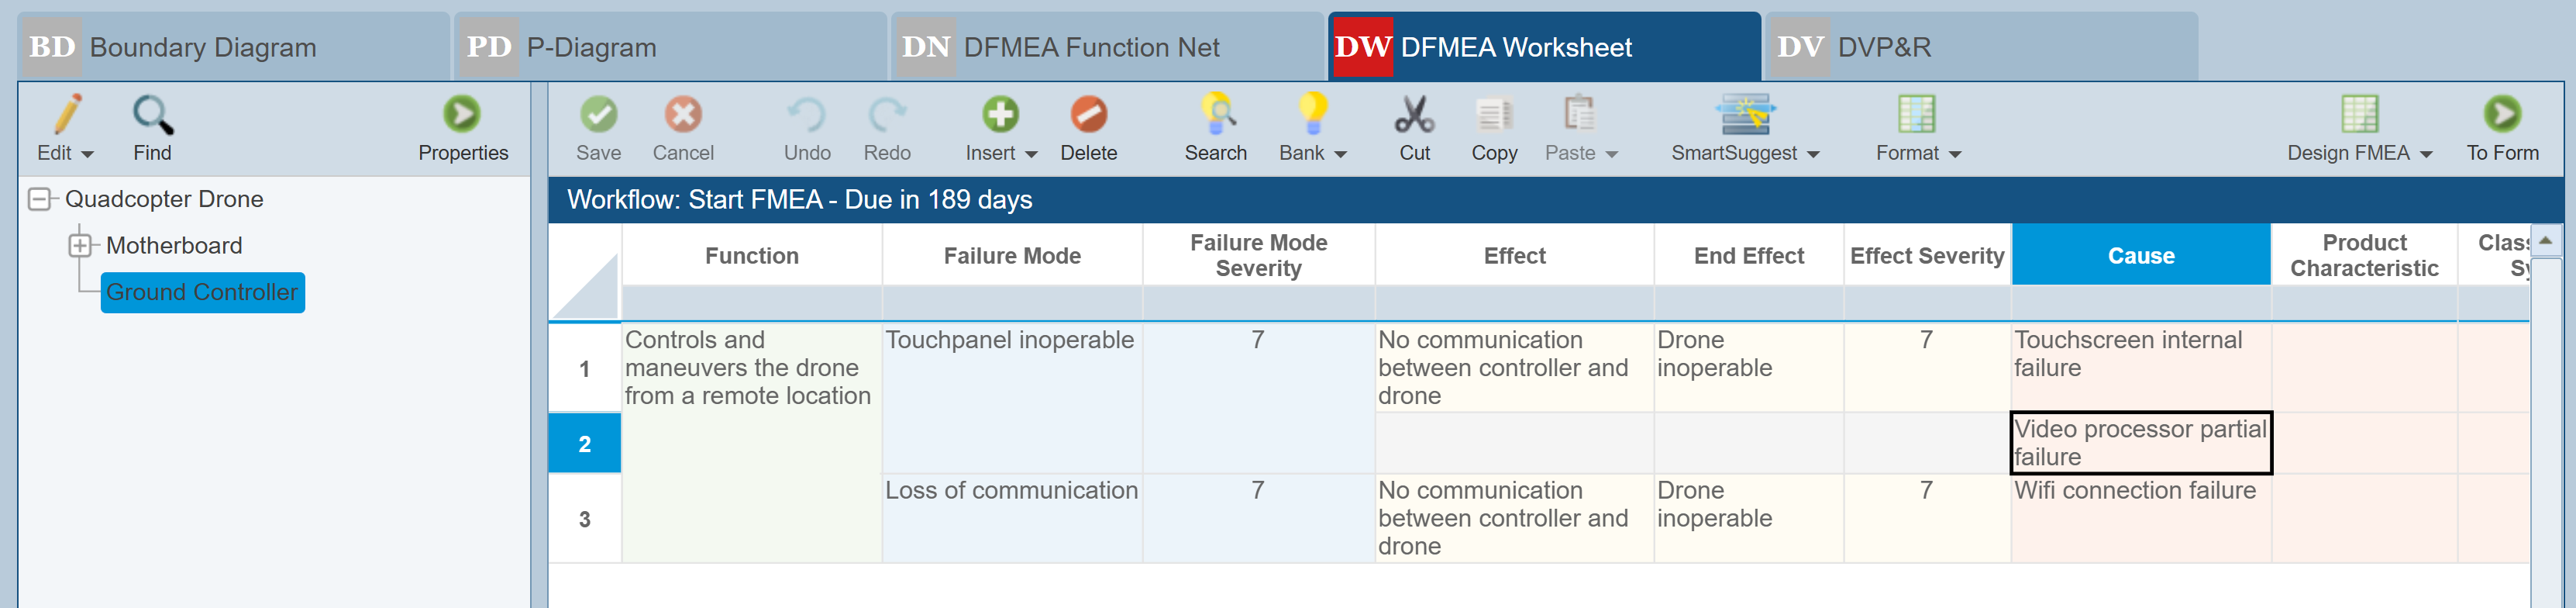
The 10 Highest RPN for DFMEA widget now reflects data from your newly created FMEA Analysis. You may see the Click on a row to drill down into the analysis message if this is the initial time you are viewing a Dashboard. If so, click Got it! to clear the message. Locate the Function "Controls and maneuvers the drone from a remote location" (you may need to scroll the list) and click on the Cause "Video processor partial failure".
You will be taken to the appropriate location in your FMEA Analysis.
At this point, you could review the Analysis data and make changes if desired.
Return to the Dashboard by clicking Back to Dashboard in the Sidebar.
6. Viewing other Example Dashboards
Example Dashboards are supplied for other Relyence Products. If you would like to view the Example Dashboard for any other Relyence Products, follow these steps:
- Click Welcome to Relyence from the Help dropdown menu
 in the Relyence header bar.
 - Click the Product tab on the left for the Dashboard you want to view.
- Click Open Example Dashboard.
Our supplied Example Dashboards may be a helpful starting point when creating your own Dashboard. To create a new Dashboard based on a supplied Example, follow these steps:
- Click Welcome to Relyence from the Help dropdown menu in the Relyence header bar.
- Click the Product tab on the left for the Product of interest.
- Click Open Example Dashboard.
- Click the Dashboard Name at the top of the Sidebar menu and select Create New... from the submenu.
- In the Create New dialog, enter a Name and, if desired, a Description for your Dashboard.
- Select Create based on an existing Dashboard and select the appropriate Product Dashboard from Dashboard to use as basis dropdown list.
- Click Create to create your Dashboard,
You can also create a completely new Dashboard by clearing the Create based on existing Dashboard checkbox. Or, you can create a new Dashboard based on one of your existing Dashboards by selecting your existing Dashboard for the Dashboard to use as basis dropdown list.
7. Creating and Customizing Your Own Dashboards
You have reviewed the basics of using Relyence Dashboards. Dashboards are completely customizable and you can create as many different Dashboards as you would like. You can create Dashboards spanning multiple Analyses, as well as Dashboards spanning multiple Products. So you could have one Dashboard that includes all the Analysis data you want to see in one place. Or, you could create multiple Dashboards to organize your Analysis data in configurations best suited for your needs.
For details on how to create, edit, or customize supplied sample Dashboards, go to Customizing the Relyence Dashboard.