Performing a DFMEA
Relyence DFMEA contains five possible elements: the Boundary Diagram, the P-Diagram (Parameter Diagram), the DFMEA Nets (Function Nets and/or Failure Nets), the DFMEA Worksheet, and the Design Verification Plan & Report (DVP&R). For more details, review the Elements of a DFMEA topic.
Each of the Relyence DFMEA elements can be used stand-alone. For example, if you only want to use the DFMEA Worksheet, you can do that. You can optionally use any combination of the five DFMEA elements.
Typically, DFMEA in Relyence FMEA is a six-step process if you use all five elements of the DFMEA: you build the Analysis Tree (if applicable), then you create your Boundary Diagram(s), then you create your P-Diagram, then build DFMEA Nets (Function Nets and/or Failure Nets), then complete the DFMEA Worksheet, and finally, create your DVP&R. This typical scenario is described in this topic.
Step 1: Build the Analysis Tree (optional)
You may choose to employ some type of hierarchical structure to organize your FMEAs. Any such structure is created in the Analysis Tree pane. In DFMEA, the Analysis Tree can be used to define the hierarchical structure of the system under review. You can also use the Analysis for any purpose in order to help with ease of management and team collaboration.
Each element in your tree has a separate FMEA Worksheet associated with it.
For more details, see the The FMEA Analysis Tree topic.
Step 2: Create Required Boundary Diagrams
The DFMEA process in Relyence FMEA optionally begins with the creation of one or more Boundary Diagrams. A Boundary Diagram depicts the relationships between subsystems and parts as well as interfaces with neighboring systems or environments in order to help define the scope of the DFMEA. Note that by default, Boundary Diagrams are not enabled in Relyence Analyses. To review how to turn on Boundary Diagrams in your Analysis, see the FMEA Properties topic for more details.
The following steps can be used to create or review a Boundary Diagram:
1. Select the Analysis Tree item and display the Boundary Diagram tab.
In the Analysis Tree pane, select the item for which you want to construct a Boundary Diagram and click the Boundary Diagram tab to activate the Boundary Diagram Worksheet. Note that if the Boundary Diagram tab does not appear, see the FMEA Properties topic to enable Boundary Diagrams in the Analysis.
Note that the image below shows the default Boundary Diagram for the Quadcopter Drone as it appeared by default before it was customized with all necessary details.
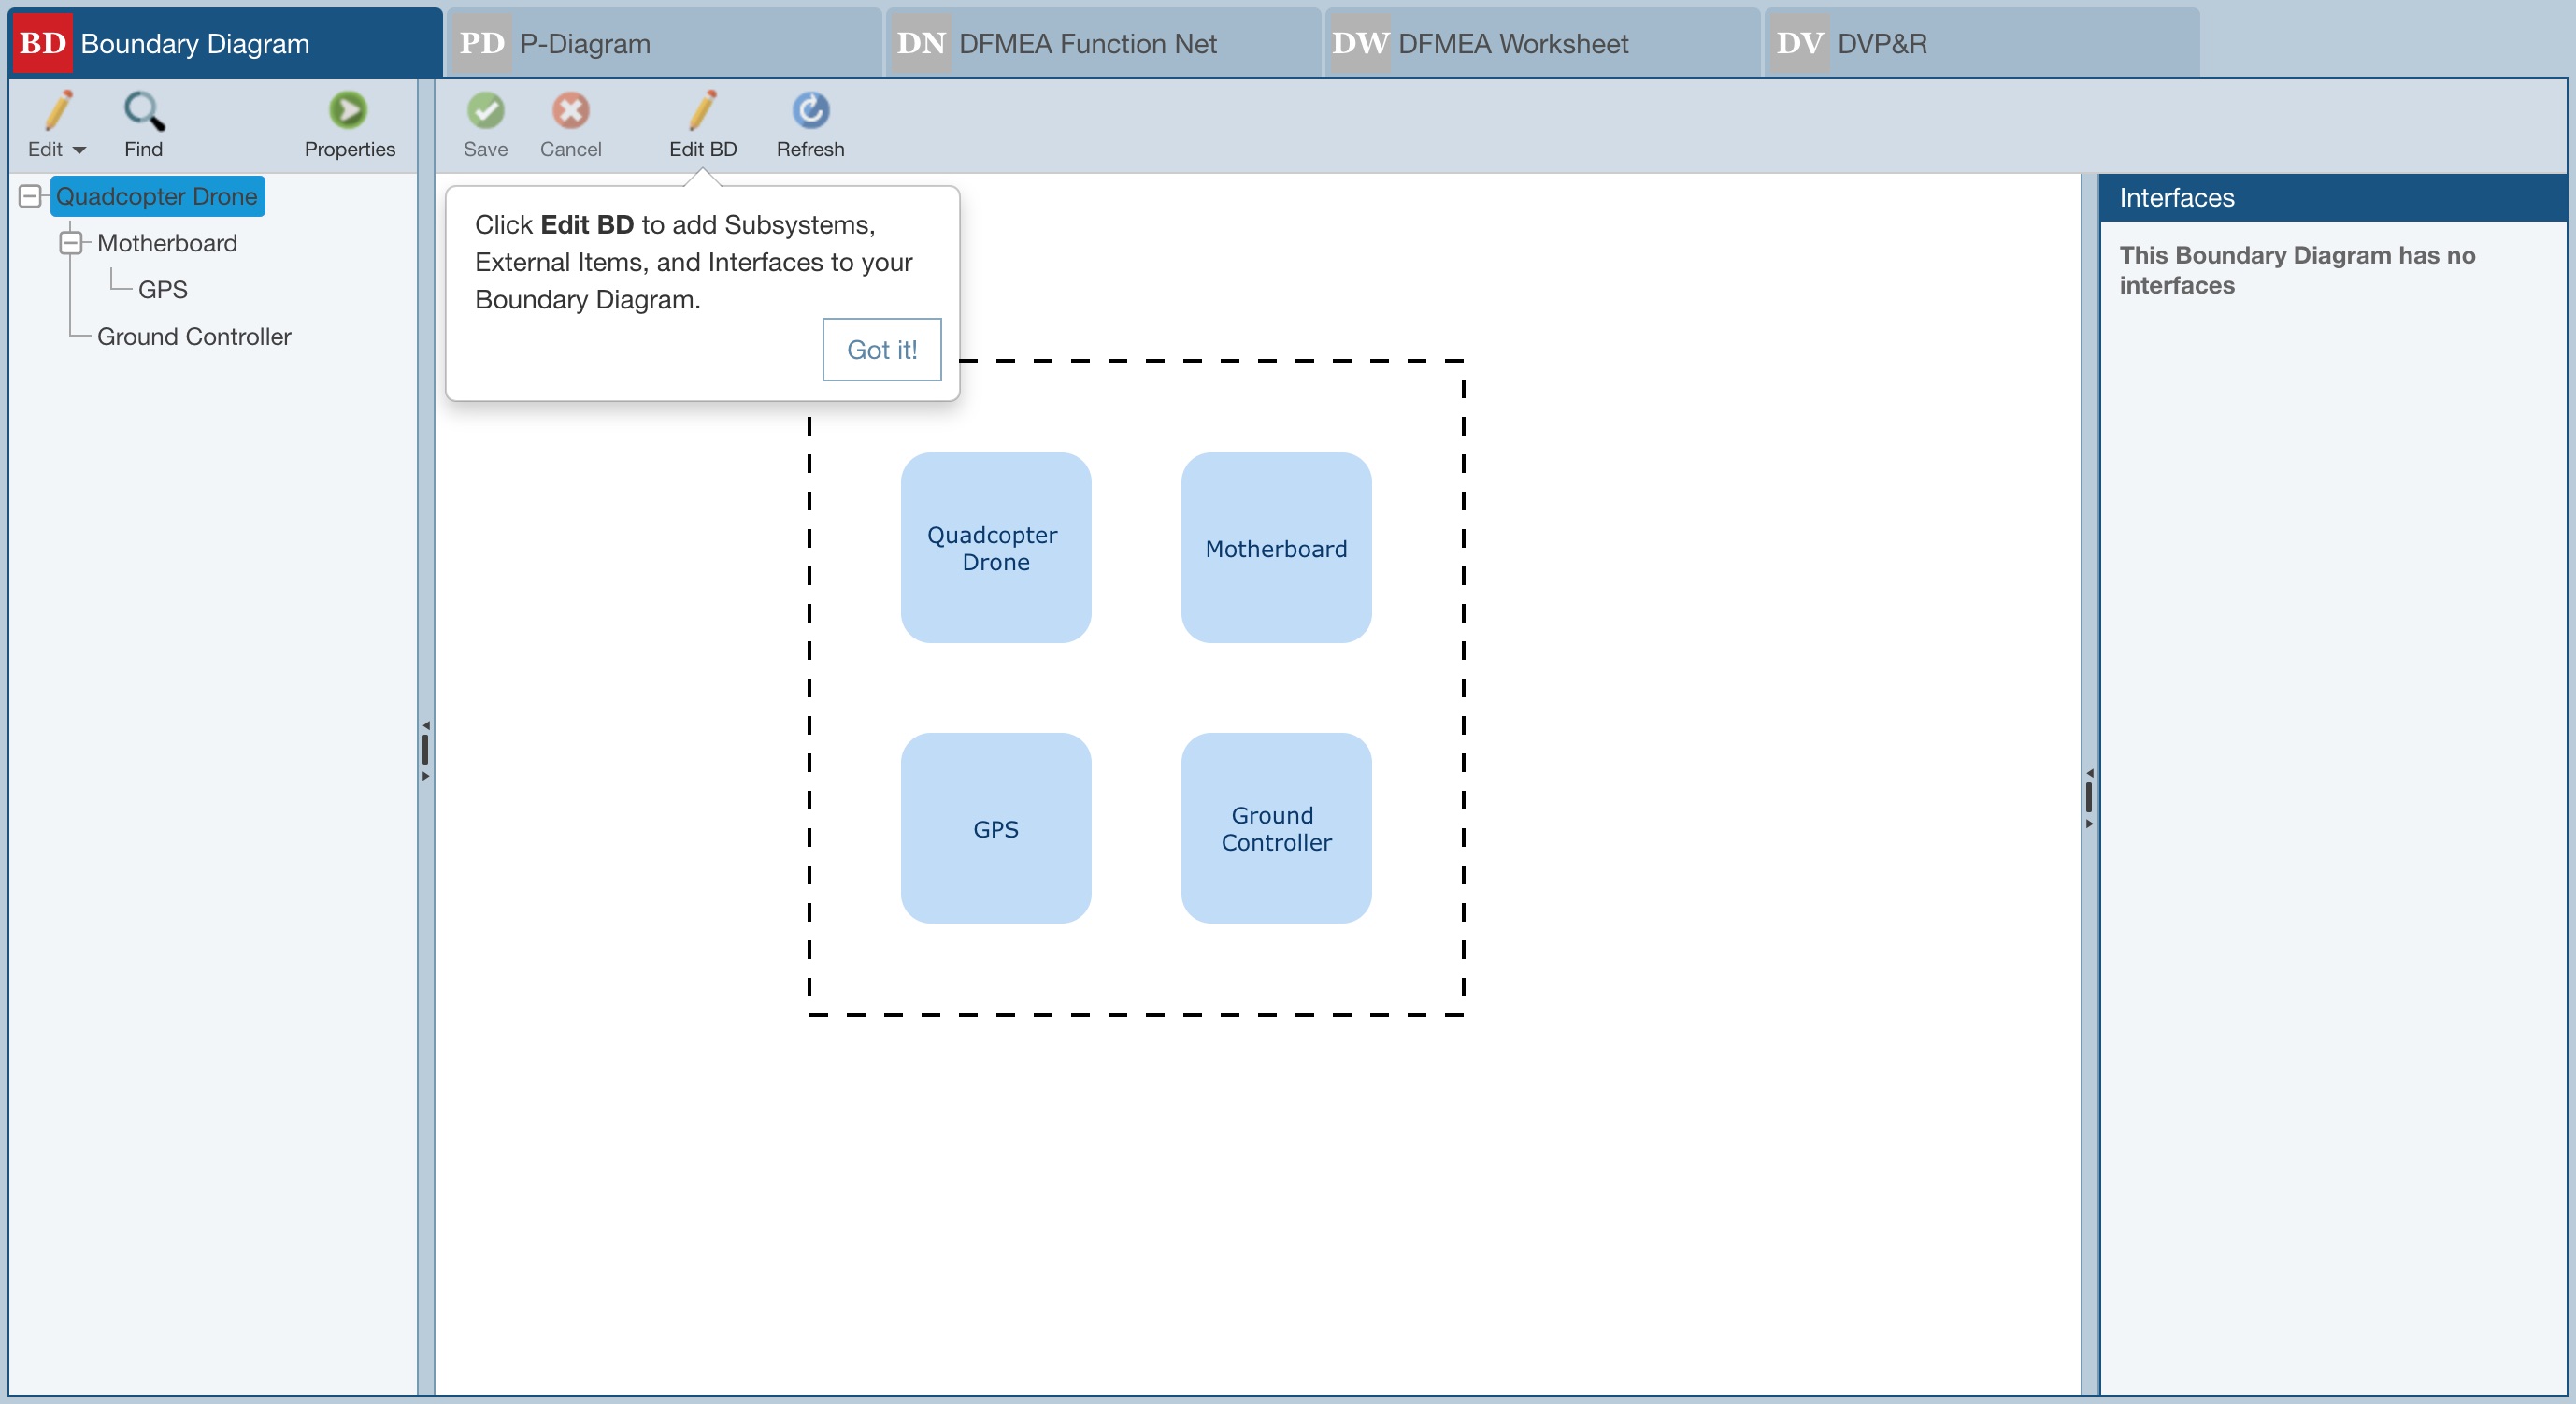
The Boundary Diagram window is displayed and an informational message may appear related to the Edit BD button in the toolbar. For new Analyses, the message denotes that you should click the Edit BD button to customize the Boundary Diagram as needed. Click Got it! to clear the message, if needed.
What is displayed on the Boundary Diagram pane will be one of three things:
- the Boundary Diagram for the Analysis Tree item currently selected
- the Boundary Diagram for the next higher Analysis Tree item in the Analysis Tree with a Boundary Diagram; descriptive text will appear in a red bar at the top of the Boundary Diagram
- a message indicating "There is no Boundary Diagram configured for this Subsystem or any of the parent Subsystems. Go to FMEA Properties to turn on Boundary Diagrams for specific Subsystems."
2. Review the Boundary Diagram.
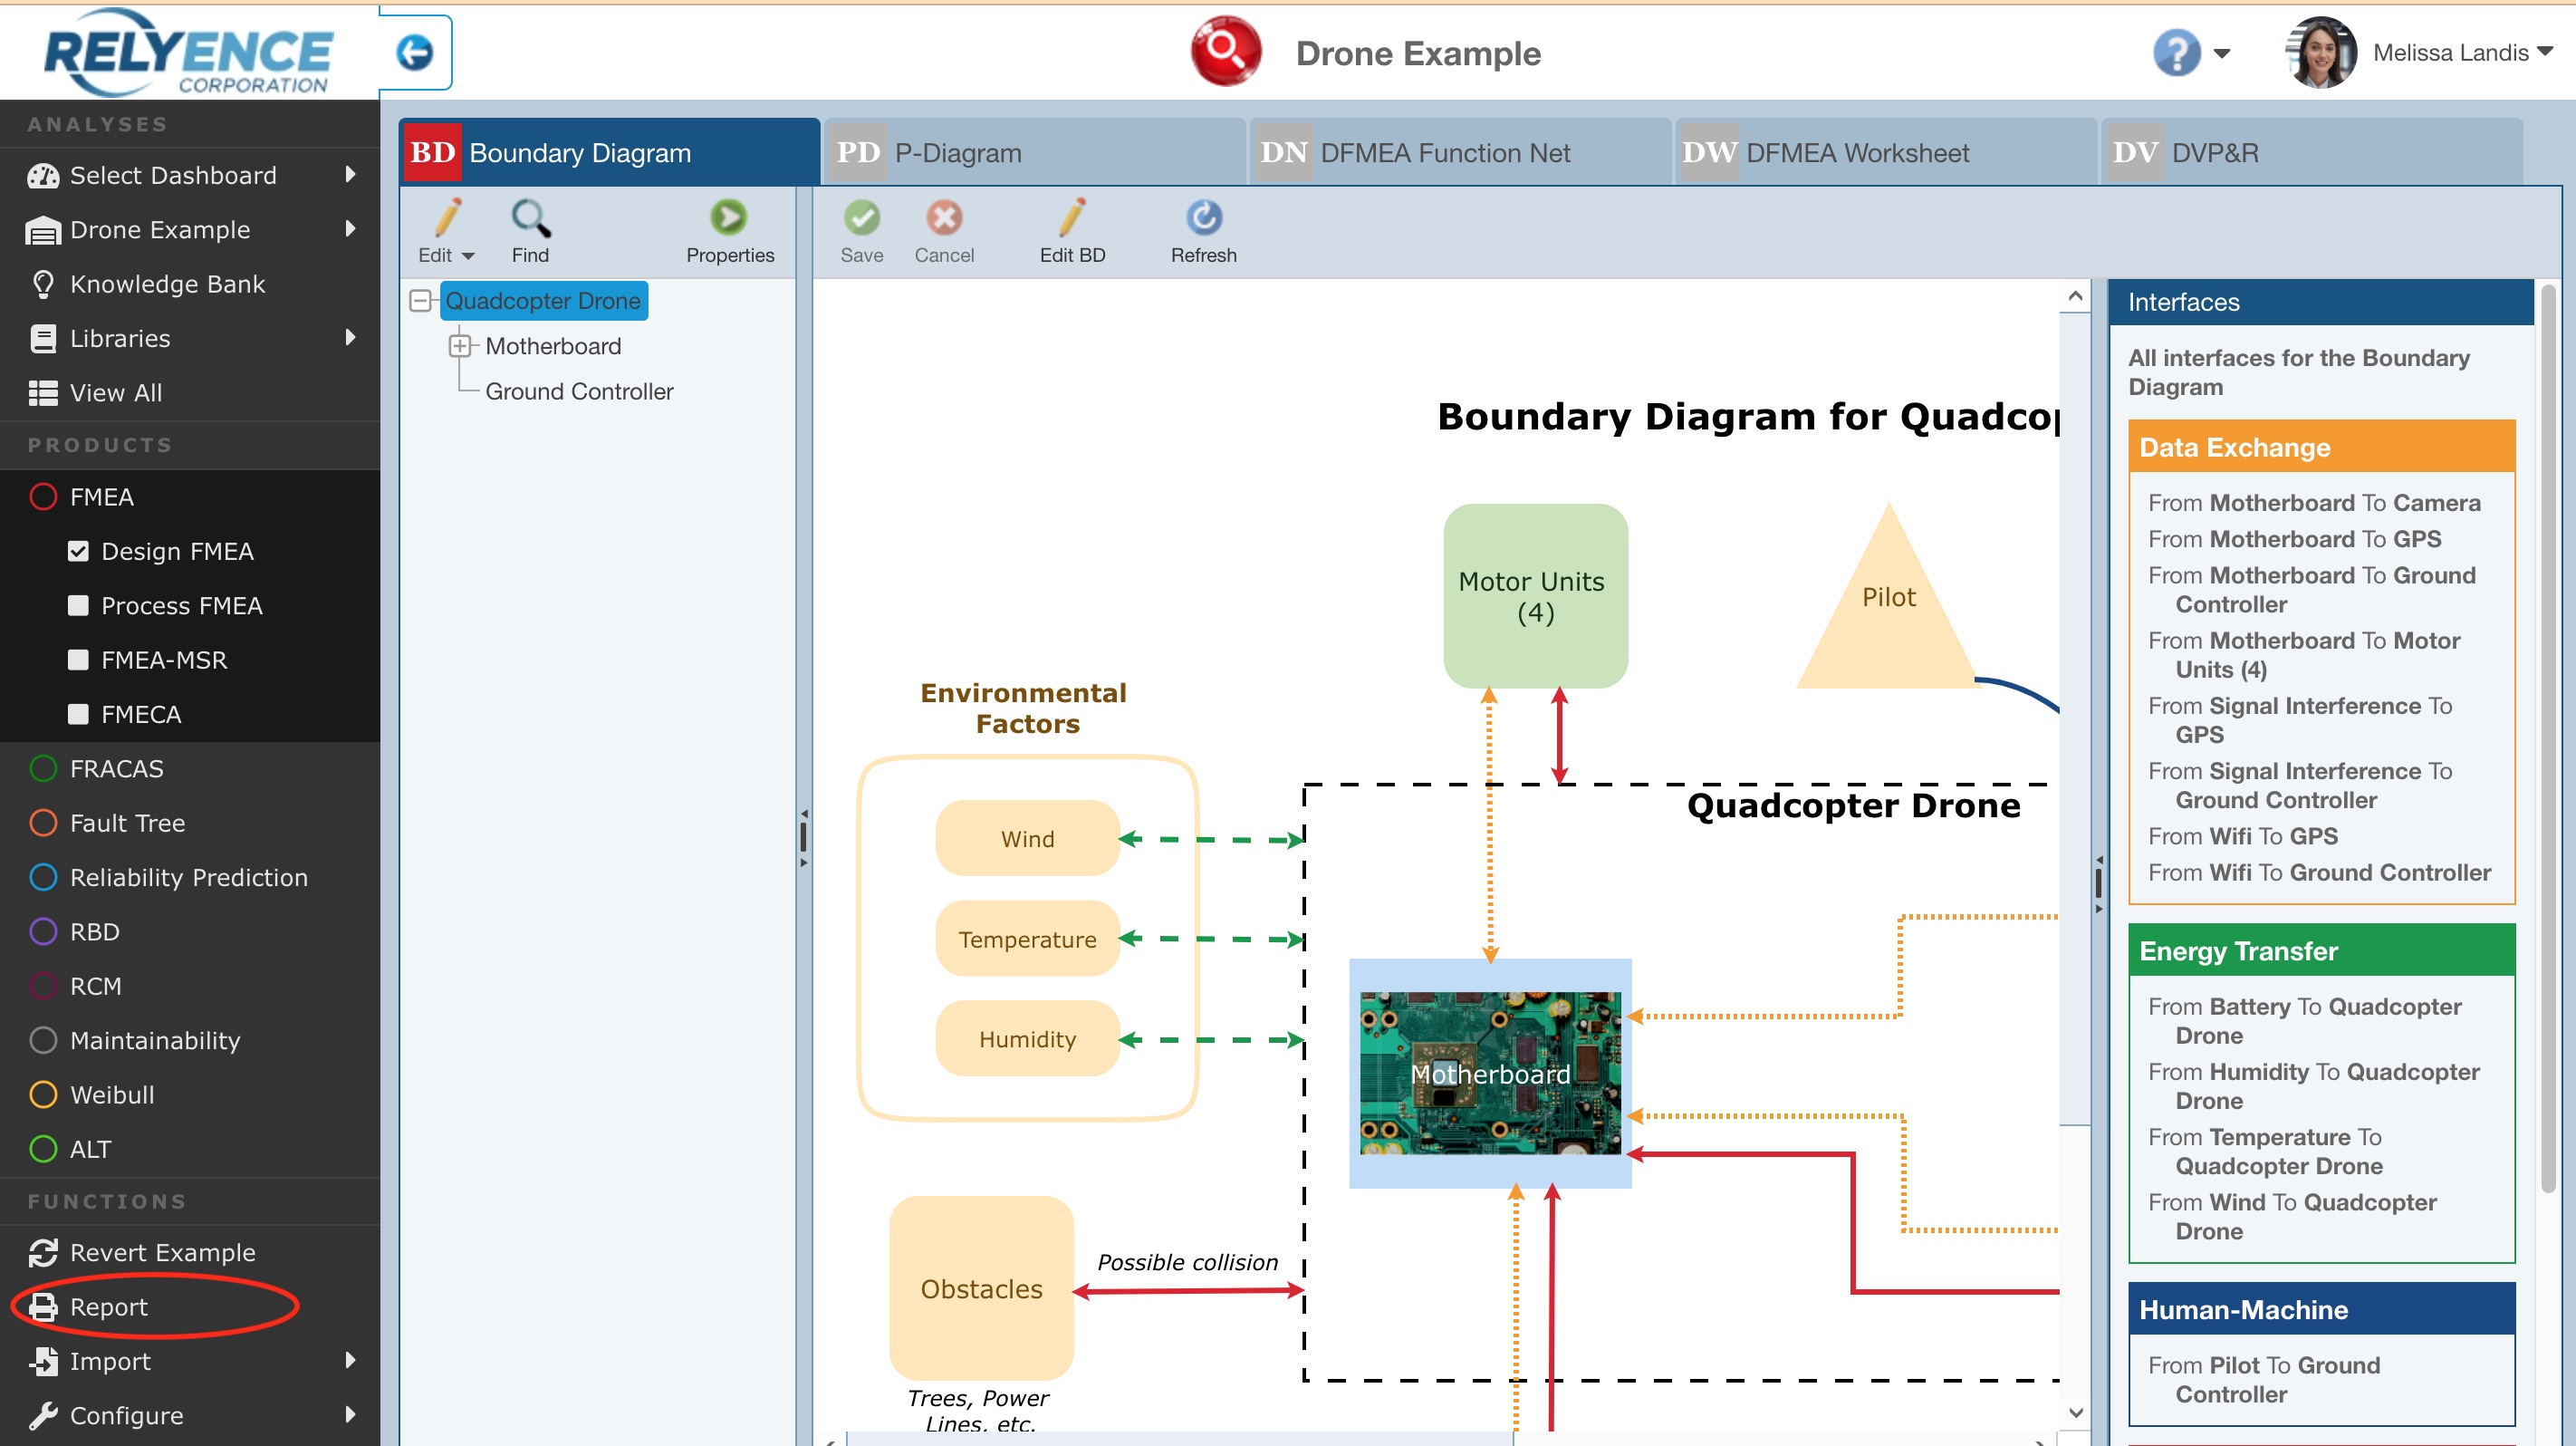
If a Boundary Diagram is displayed in the middle pane, the left pane will show the Analysis Tree and the right pane will show a summary of applicable Interfaces.
3. Review and/or customize the Boundary Diagram Interface and Block types.
You can define additional Blocks and/or Interfaces - from Sidebar, select Configure > FMEA > Boundary Diagrams. Review and/or add additional Interfaces and/or Block as described in for Configuring Boundary Diagram Interfaces and Blocks.
4. Access the Boundary Diagram edit mode.
Click the Edit BD button to access the Boundary Diagram edit mode.
The left pane of the Boundary Diagram edit mode provides access to the Blocks and Interfaces which can be included on any Boundary Diagram.
Any Boundary Diagram can include Blocks to represent Analysis Tree Subsystems, the Boundary, External Factors, a Legend, Other Subsystems, and Text (labels), as well as Interfaces to represent Data Exchange, Energy Transfer, Human-Machine, Material Exchange, and Physical Connection.
5. Add or remove Boundary Diagram Blocks, including the boundary.
Add or remove additional blocks on the Boundary Diagram pane as described in The Boundary Diagram Editor.
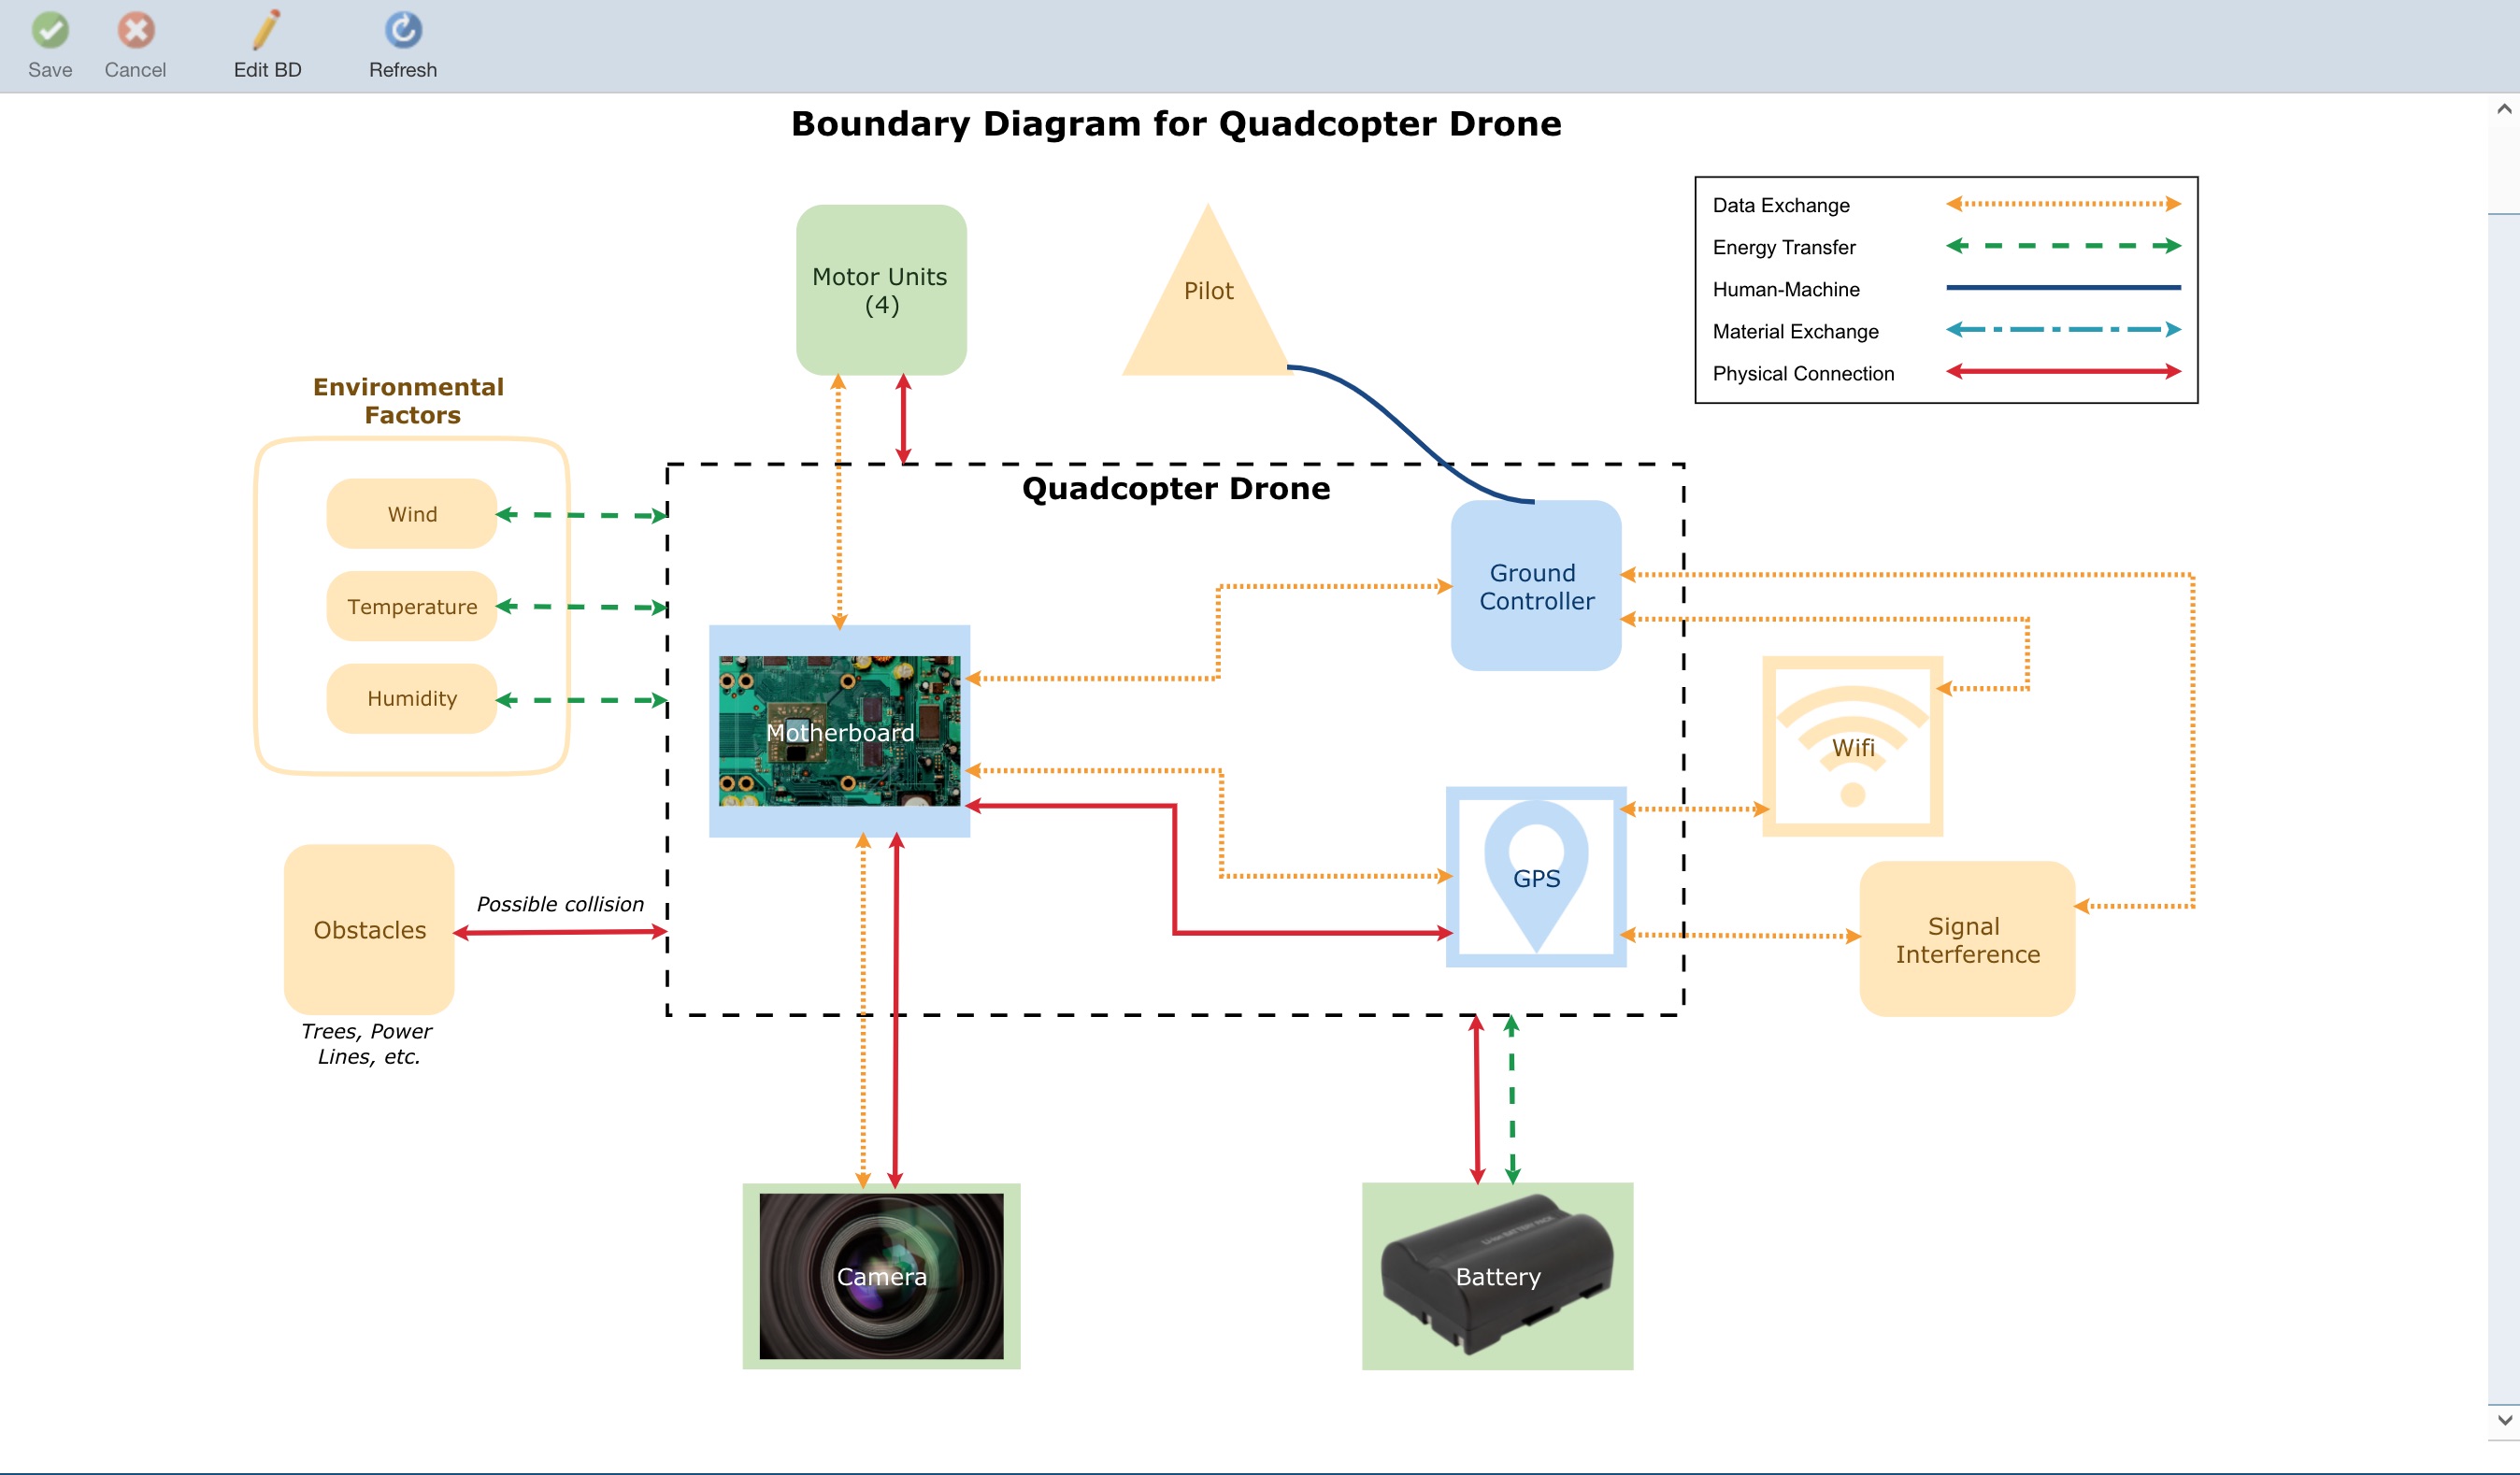
In the Drone Example Boundary Diagram for the Quadcopter Drone shown below:
- the Motherboard is an example of an Analysis Tree Subsystem
- the dash-lined box surrounding the Motherboard, Ground Controller, and GPS is a Boundary
- the triangular-shaped yellow block is an example External Factor
- the light green block labeled "Motor Units (4)" is an example Other Subsystem
- the Legend appears in the top right corner
- the title "Boundary Diagram for Quadcopter Drone" is an example of a Text block
- the orange dotted line from Motherboard to Ground Controller is an example of a Data Exchange Interface
6. Add or remove Boundary Diagram Interfaces.
Add or remove additional interfaces on the Boundary Diagram pane as described in The Boundary Diagram Editor.
7. Save changes to the Boundary Diagram and exit the Boundary Diagram Editor using the Save and Close, Save, and/or Close buttons in the toolbar.
8. If you wish to print the Boundary Diagram, click Report in the sidebar.
The Report Options dialog appears. Confirm or enter the Report title and select the preferred Format.
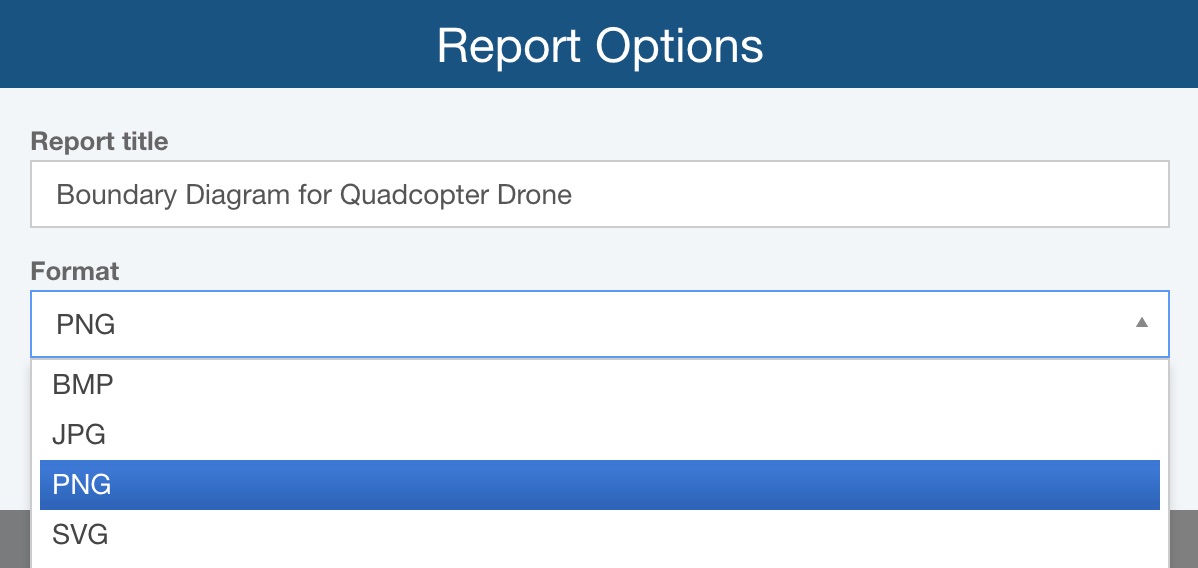
Click Report.
The Boundary Diagram report is downloaded in the selected format to your default downloads location.
Note that you can use Boundary Diagram data to help streamline data entry on your DFMEA Worksheet.
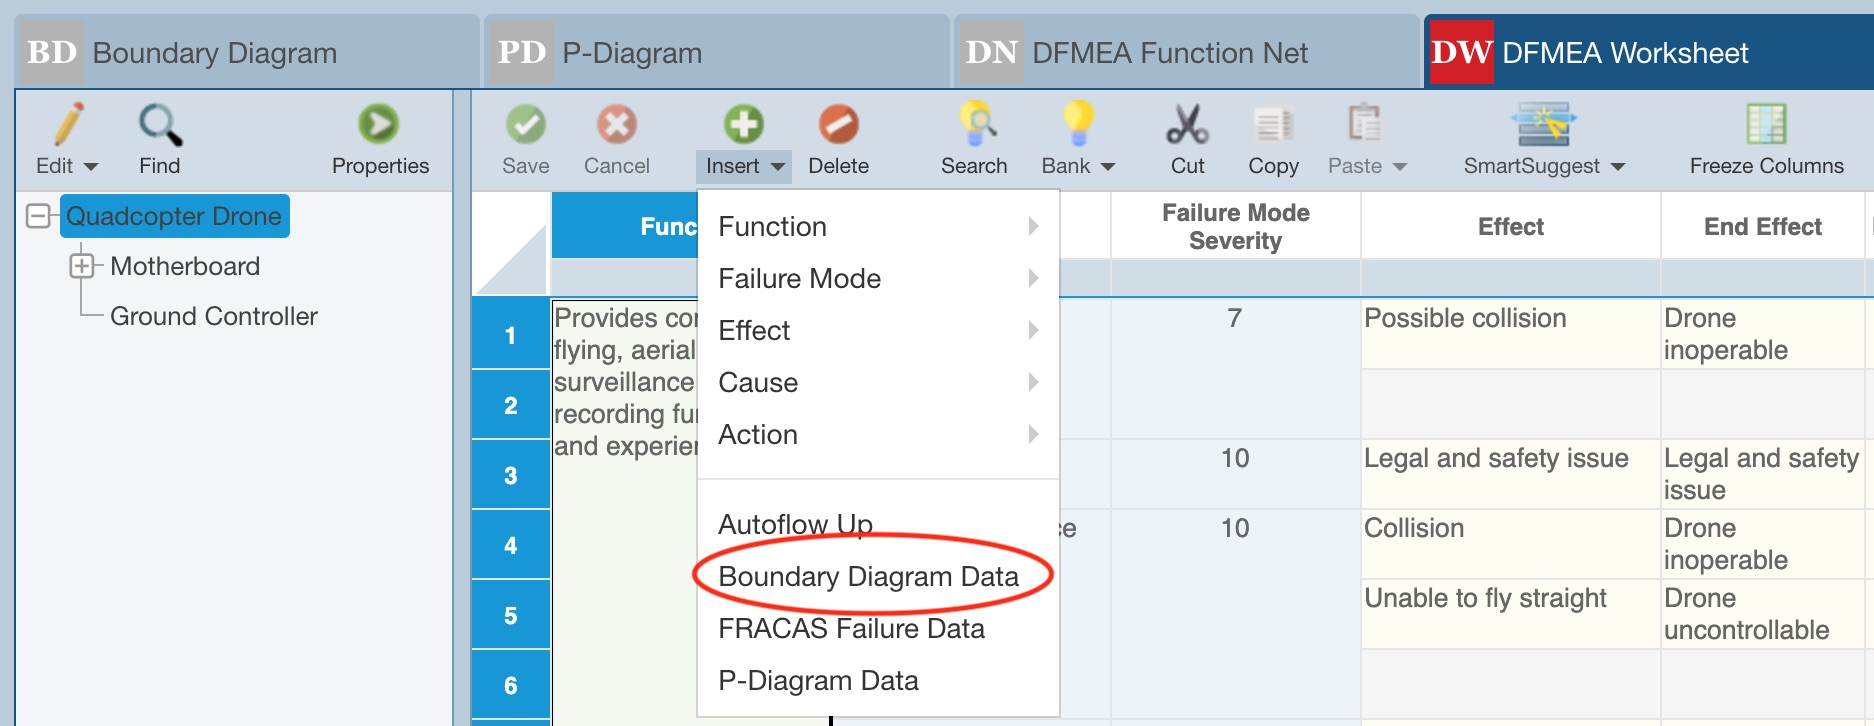
1. On the DFMEA Worksheet, select a cell in the column where you would like to add new data from the Boundary Diagram. For example, to enter a new Function into your FMEA Worksheet or connect to an existing Function in your DFMEA Worksheet, select a cell in the Function column.
2. In the toolbar, click Insert and then Boundary Diagram Data.
The Insert from Boundary Diagram dialog appears.
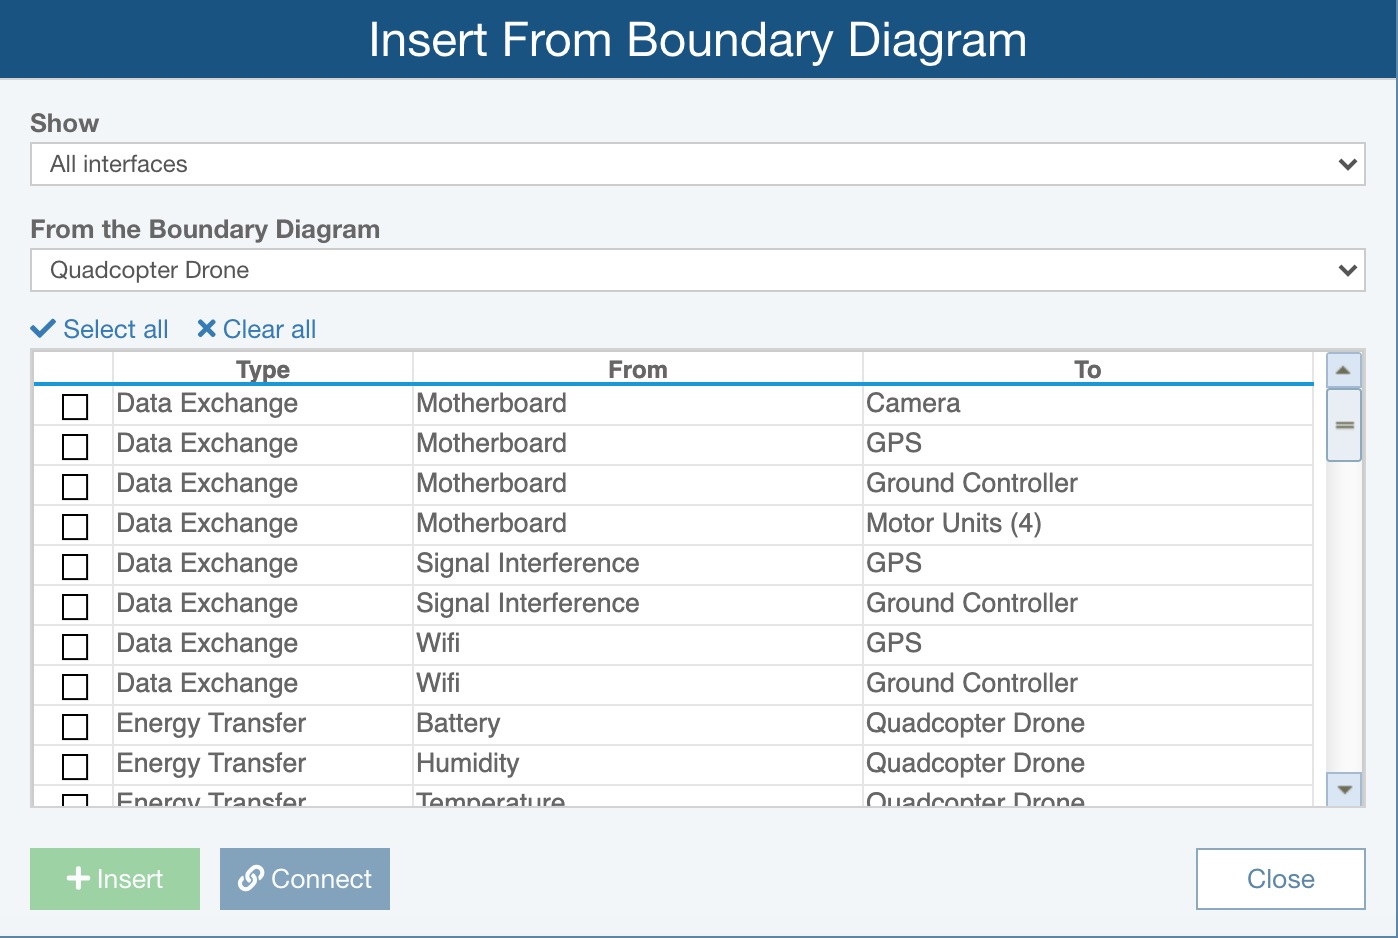
3. Use the Show field to confirm which Interfaces to show and use the From the Boundary Diagram field to identify the appropriate Boundary Diagram in the Analysis.
4. Select which Interfaces you'd like to insert as new unique Function records or to connect to existing Function records by clicking the checkmark in the leftmost column or using Select all and then use Insert or Connect as needed.
5. When finished, click Close and review the newly added FMEA data on the DFMEA Worksheet.
Step 3: Create a P-Diagram
DFMEAs optionally include the creation of a P-Diagram. Note that by default, P-Diagrams are not enabled in Relyence Analyses. To review how to turn on P-Diagrams in your Analysis, see the FMEA Properties topic for more details.
The FMEA process optionally continues or begins with the creation of a P-Diagram, or Parameter Diagram. The P-Diagram describes inputs and expected outputs, along with unintended outputs, noise factors, and control factors. Developing a well-defined P-Diagram can provide useful input for the FMEA, including details like Failure Causes, Failure Modes, Effects, Current Controls, and Recommended Actions.
The following steps are used to create or review your P-Diagram:
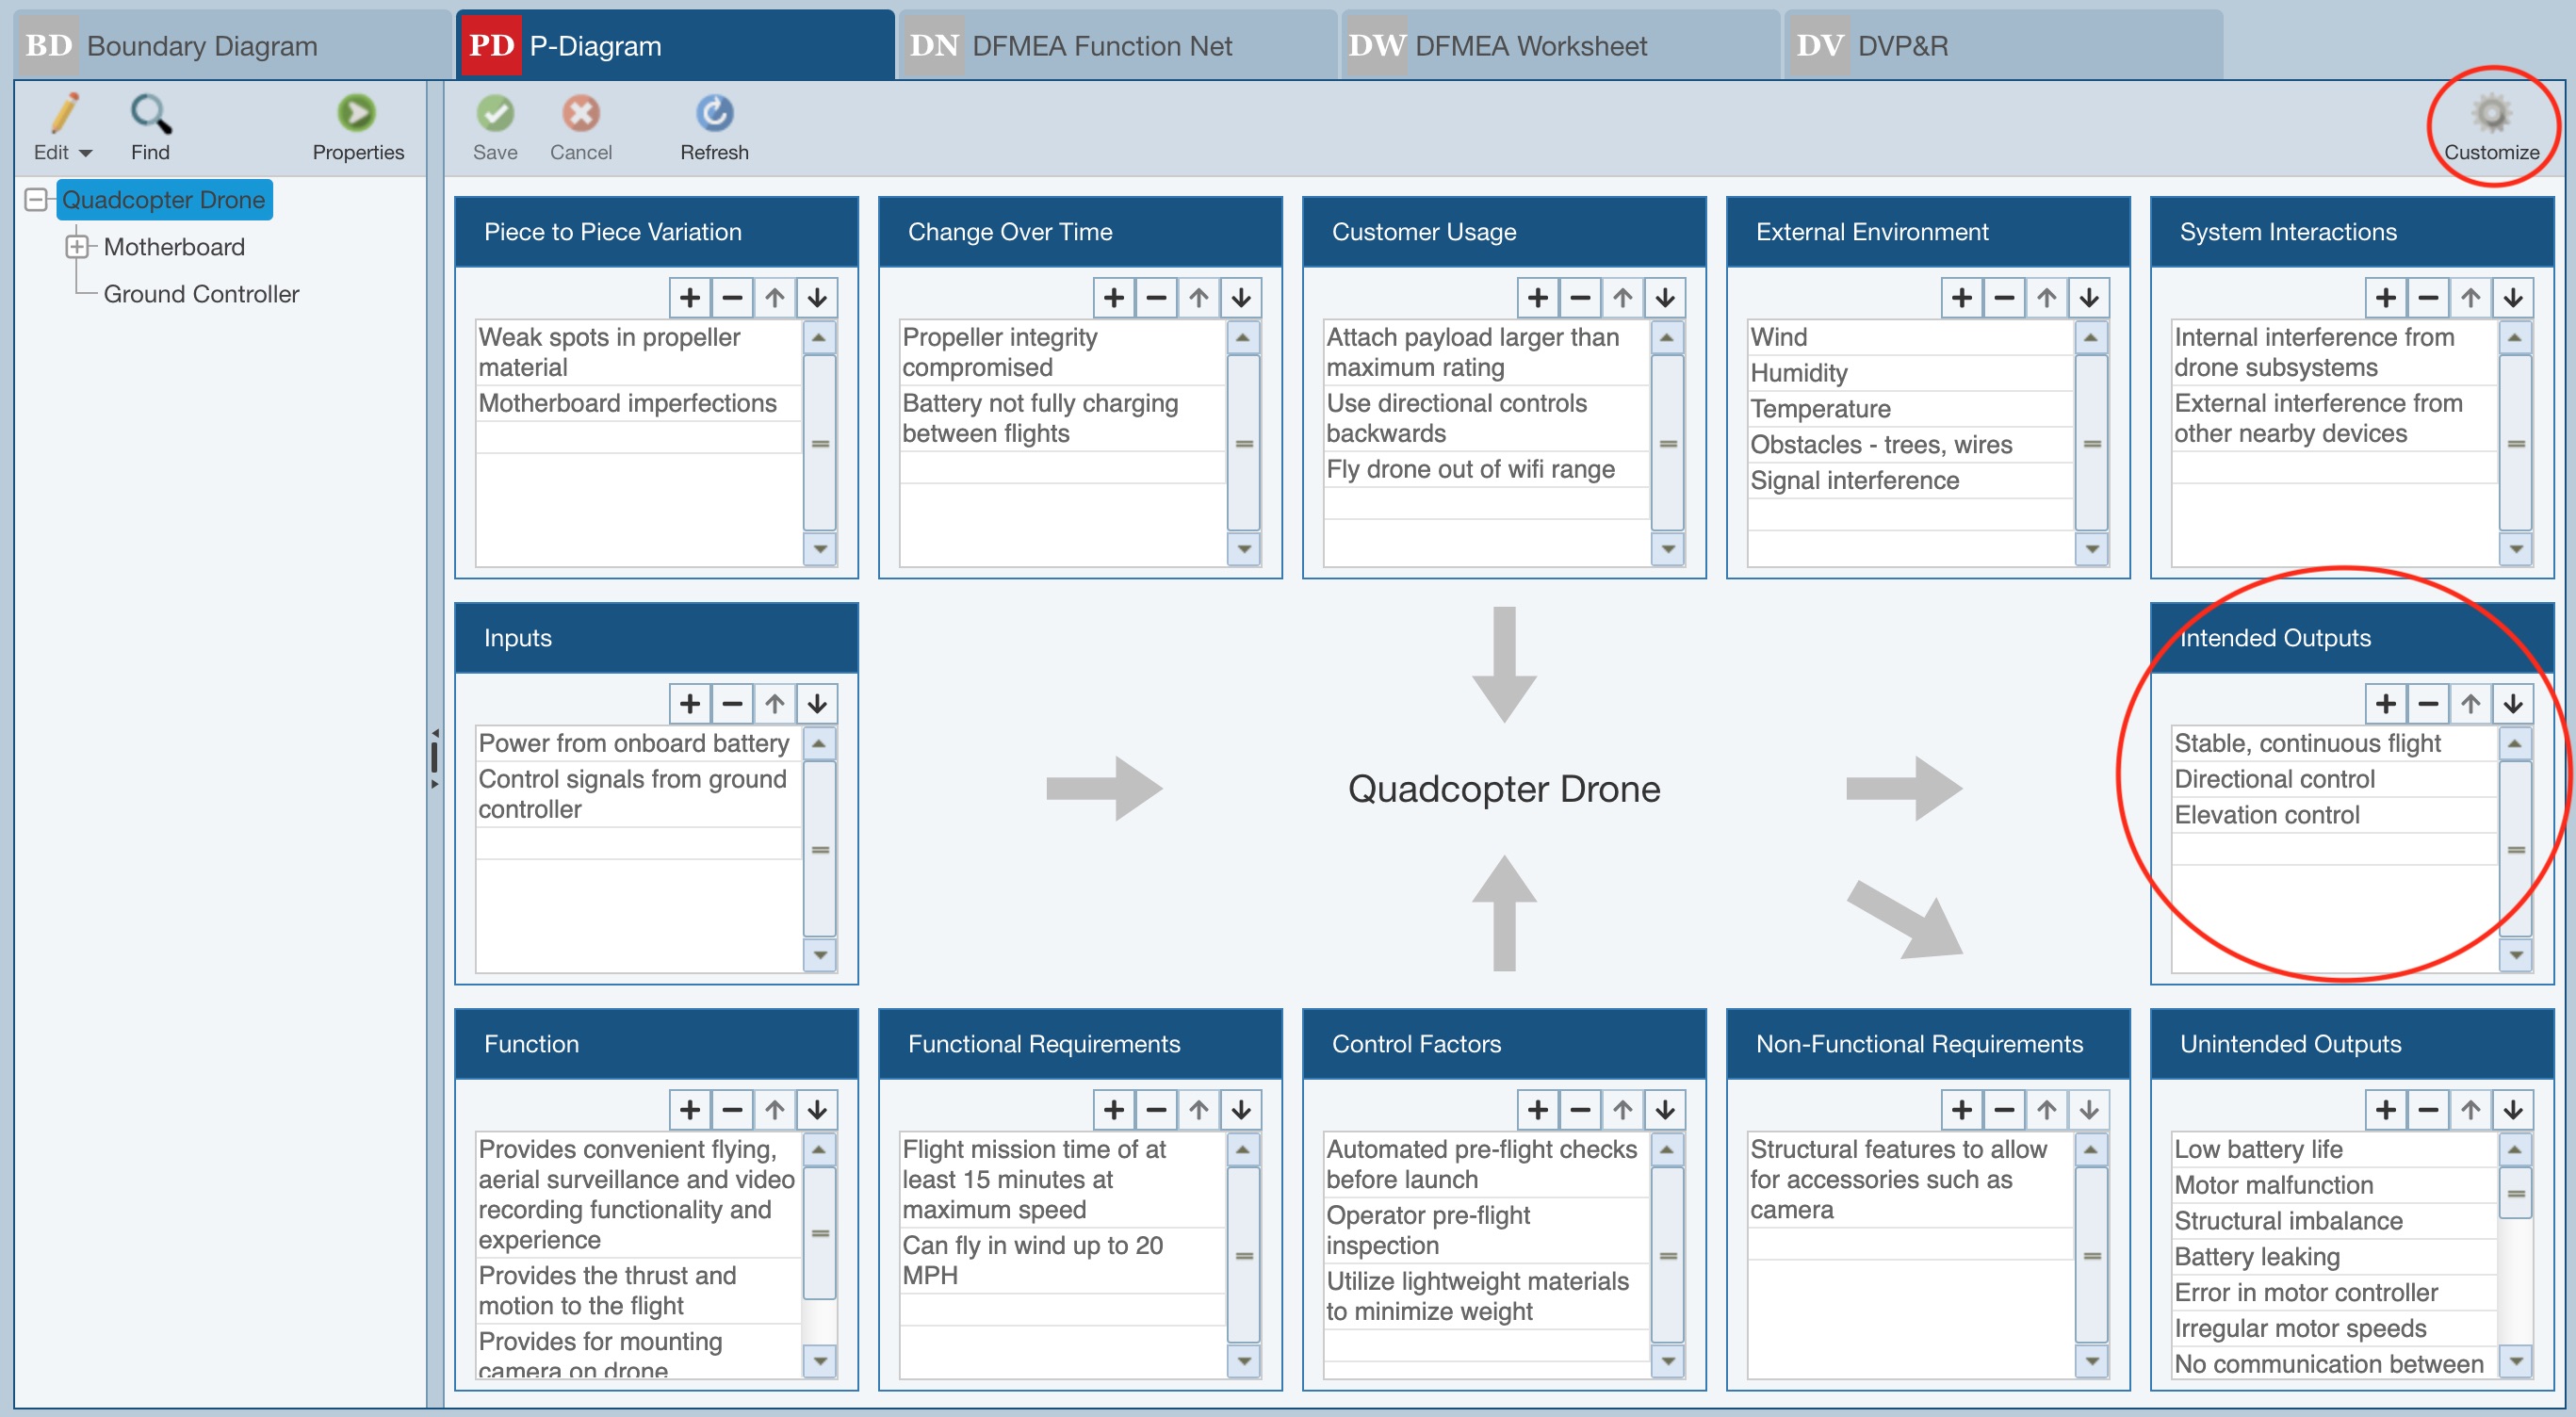
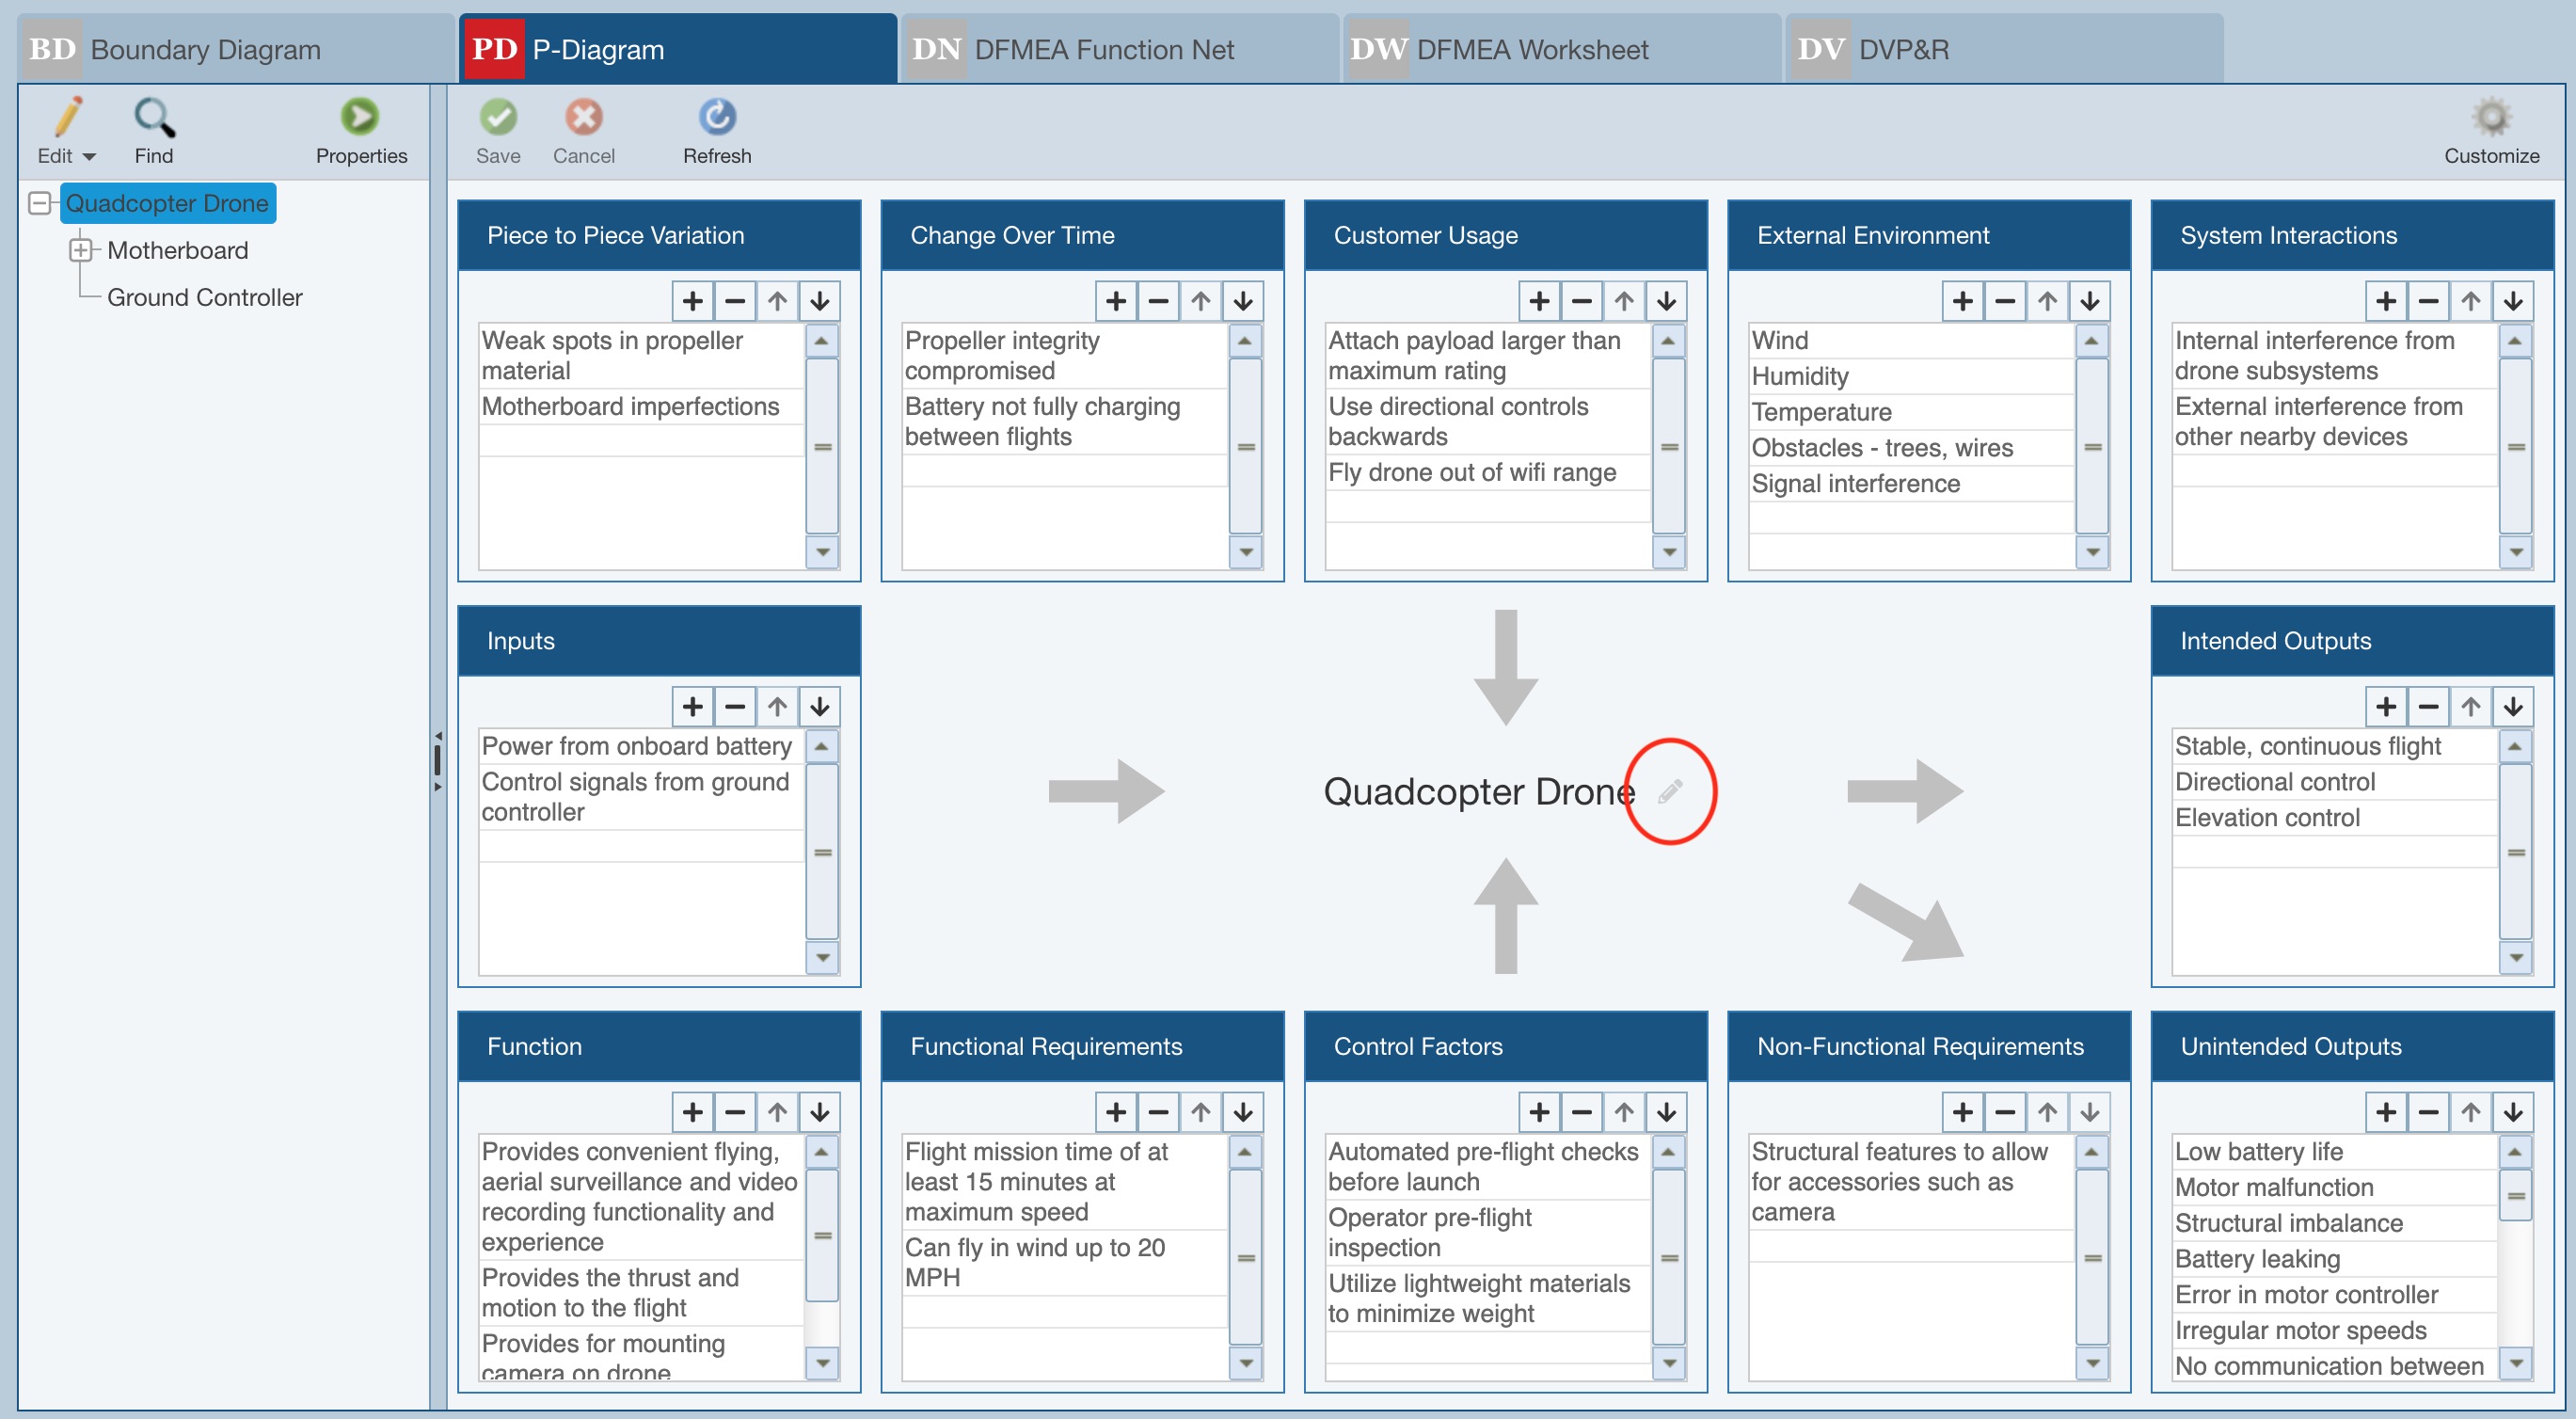
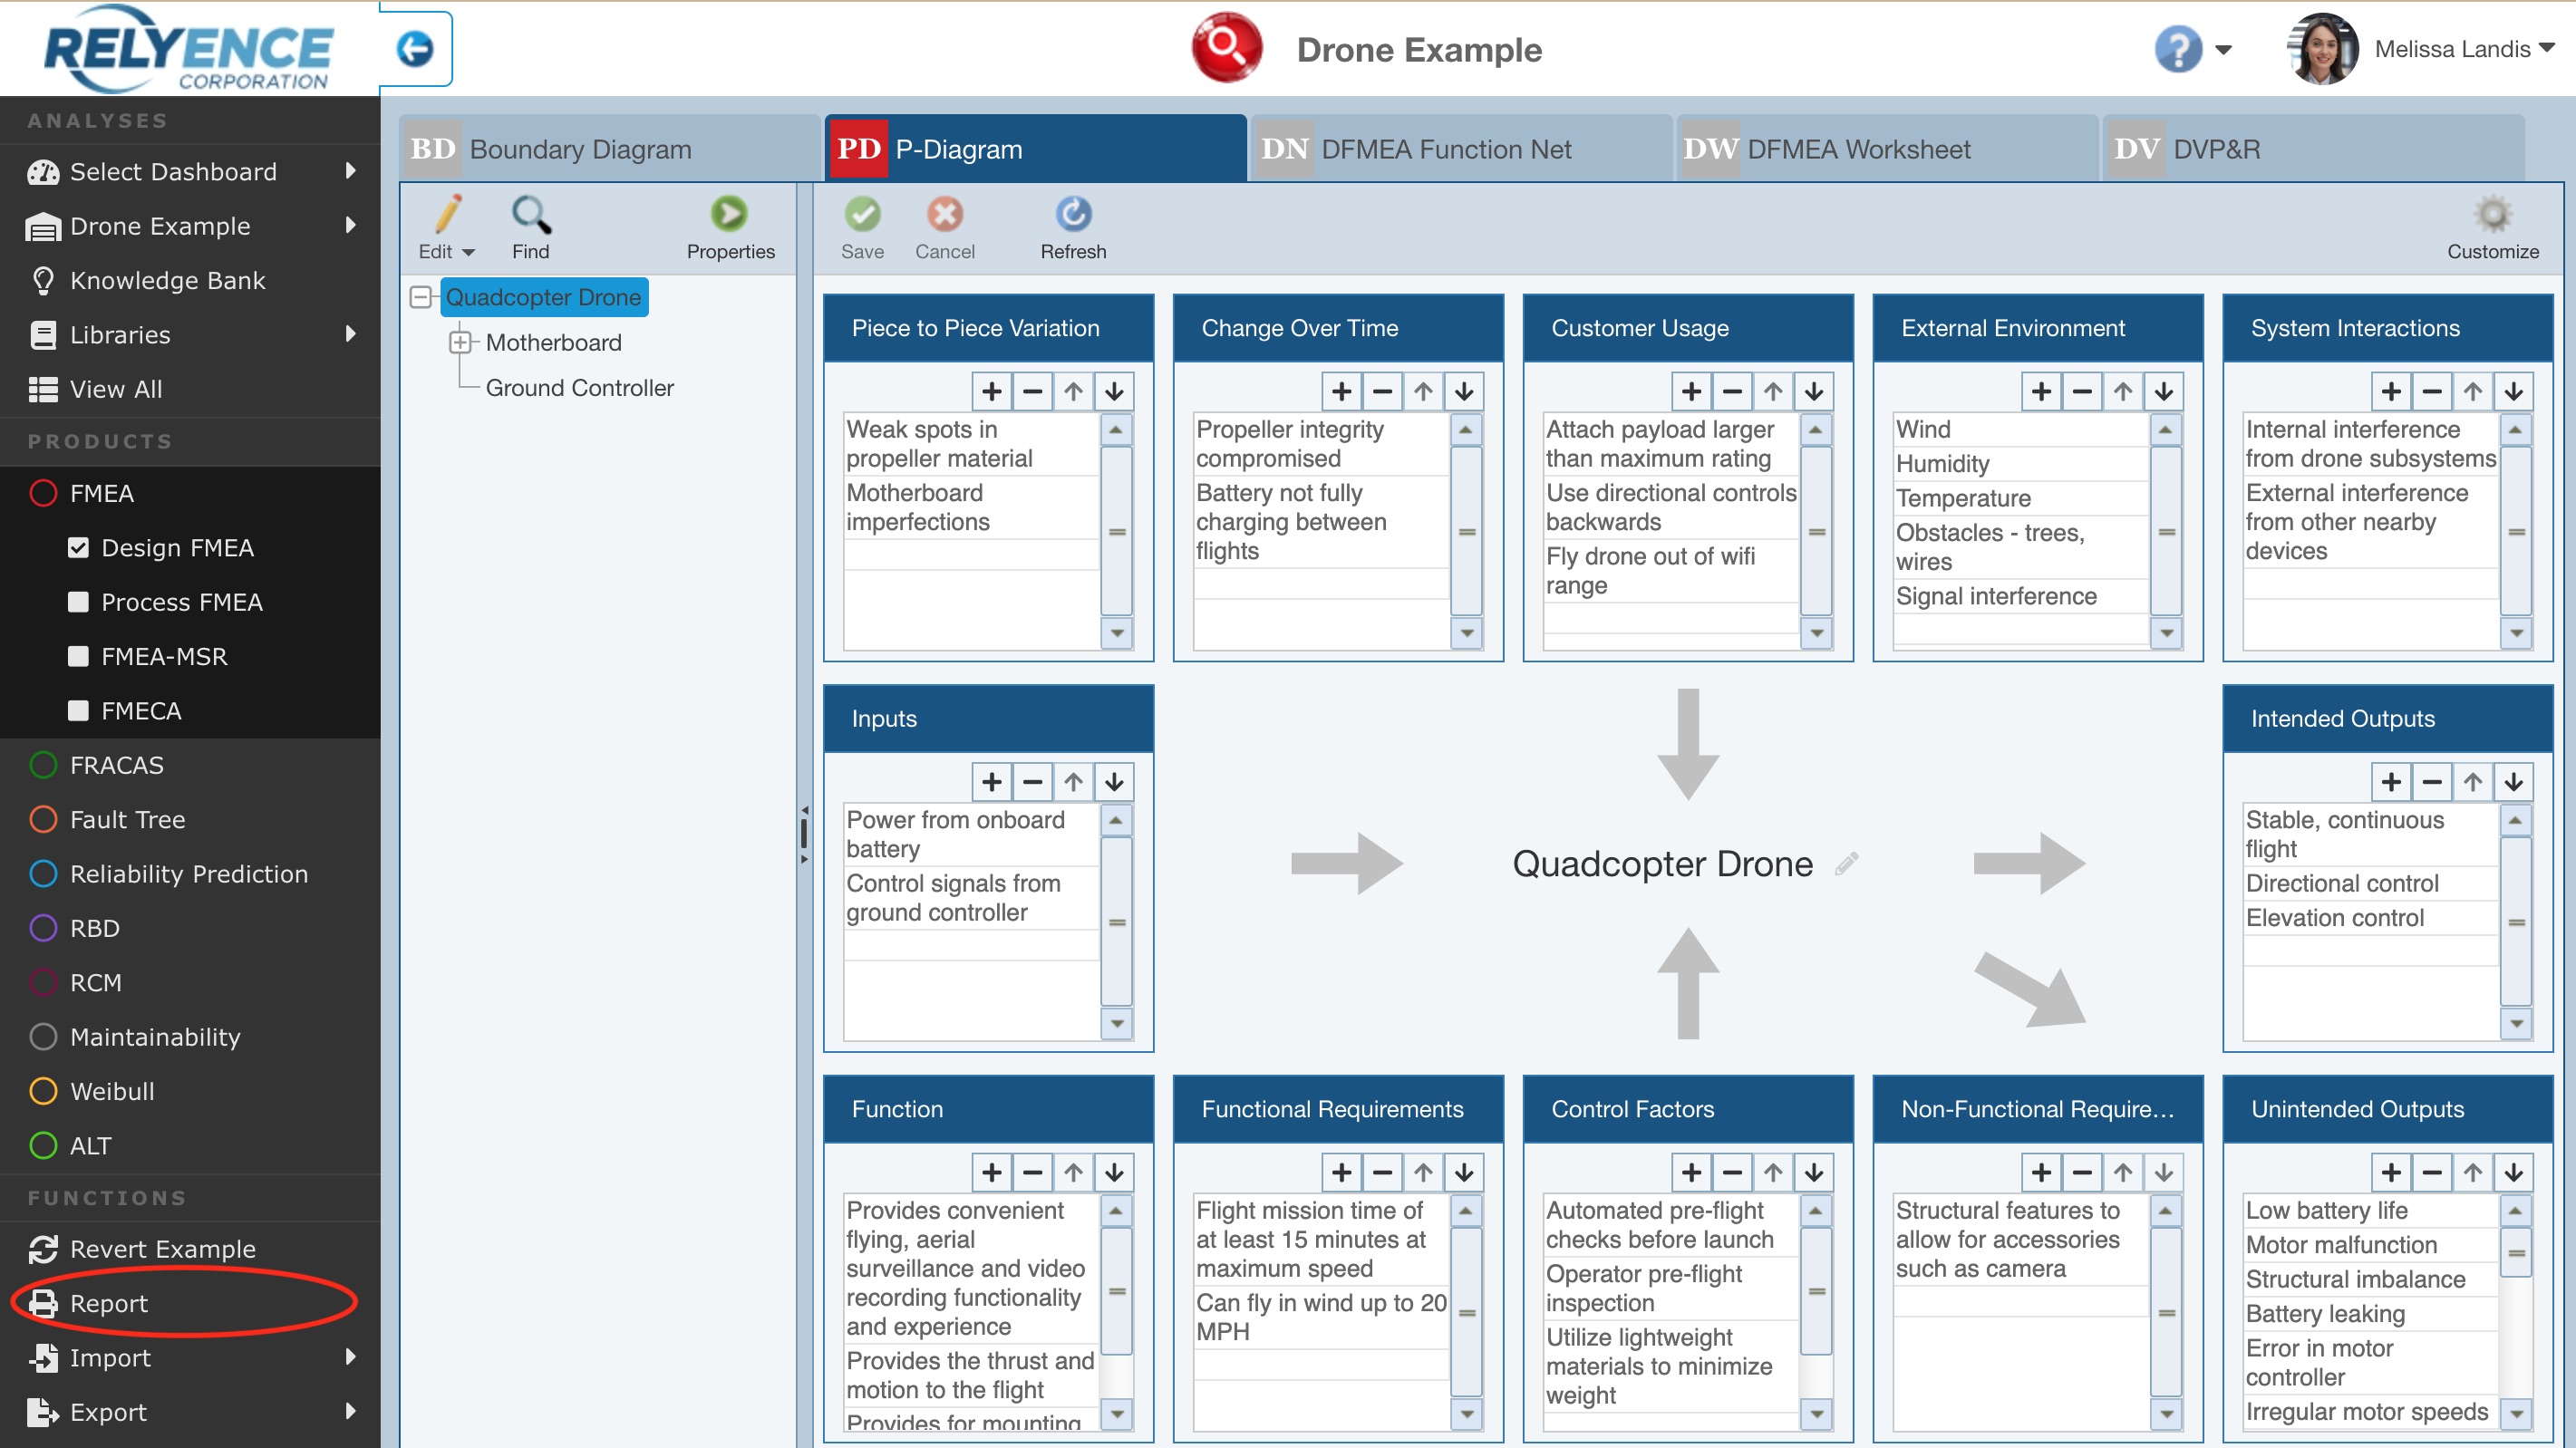
1. Click the P-Diagram tab to activate the P-Diagram Worksheet.

2. Review the elements of the P-Diagram. The elements are each of the boxes with the dark blue title bars. If you need to change any element titles, hide any elements or change any basic details about the P-Diagram format, click Customize.
3. Customize the P-Diagram worksheet, if needed.
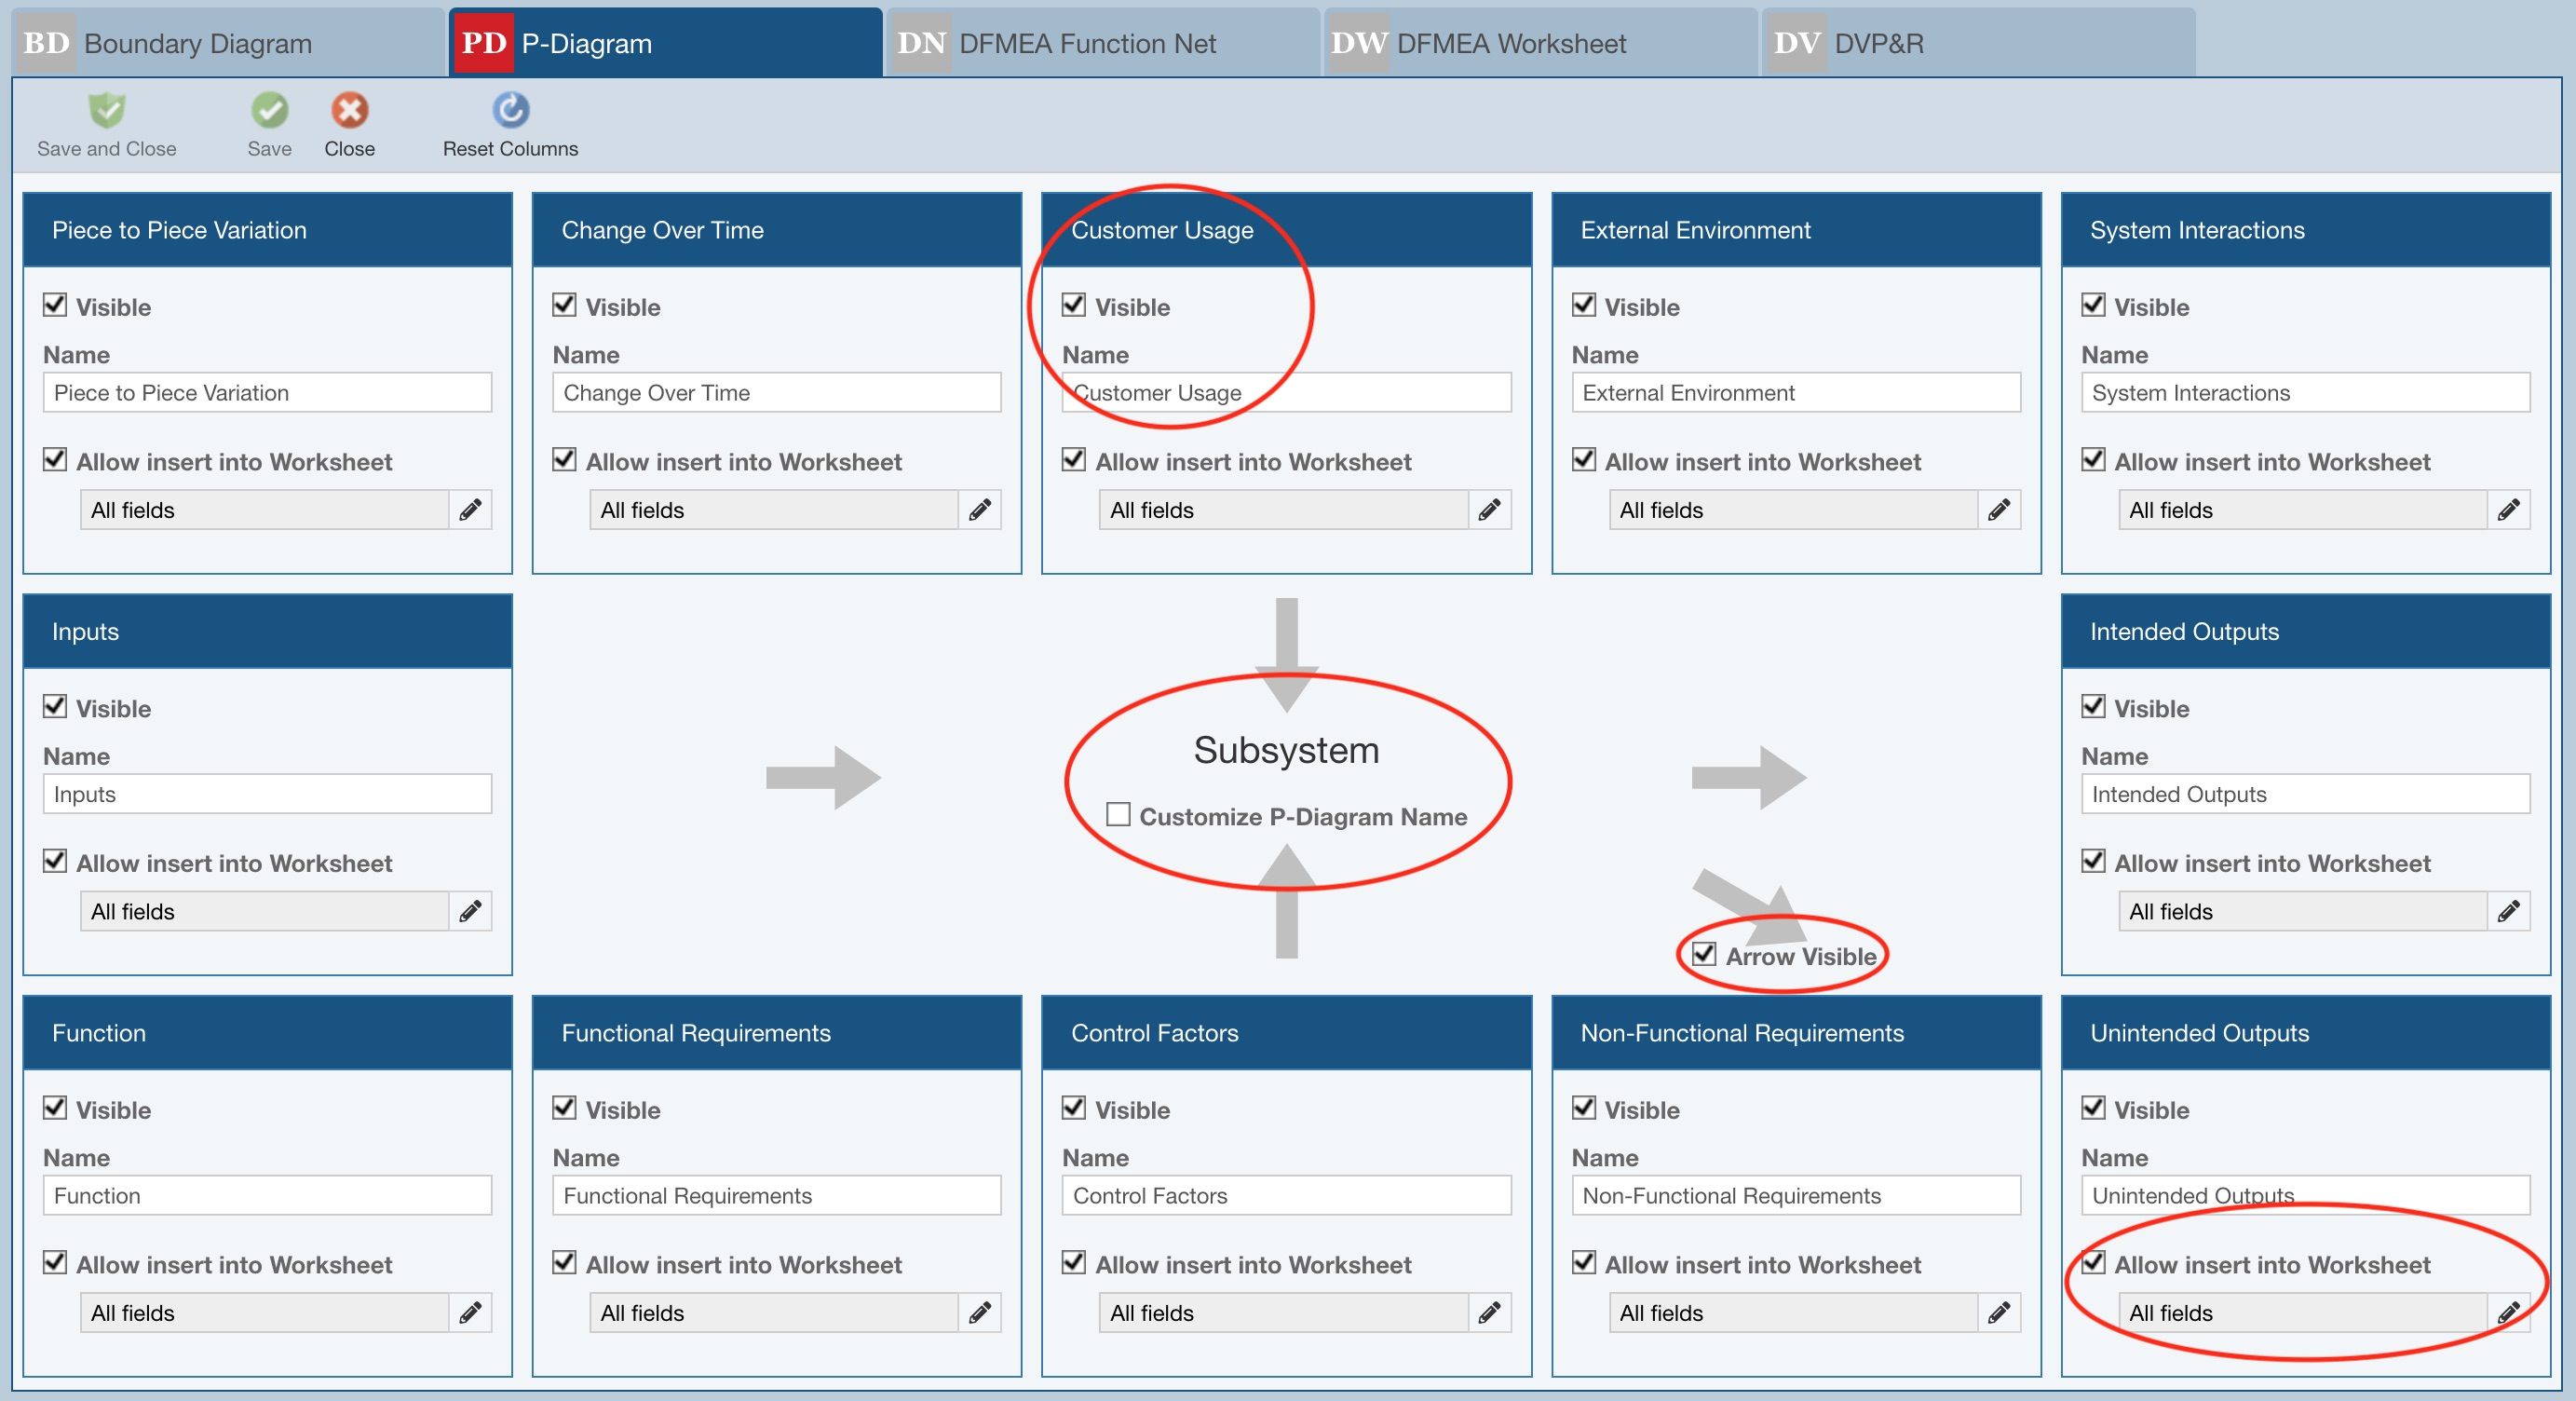
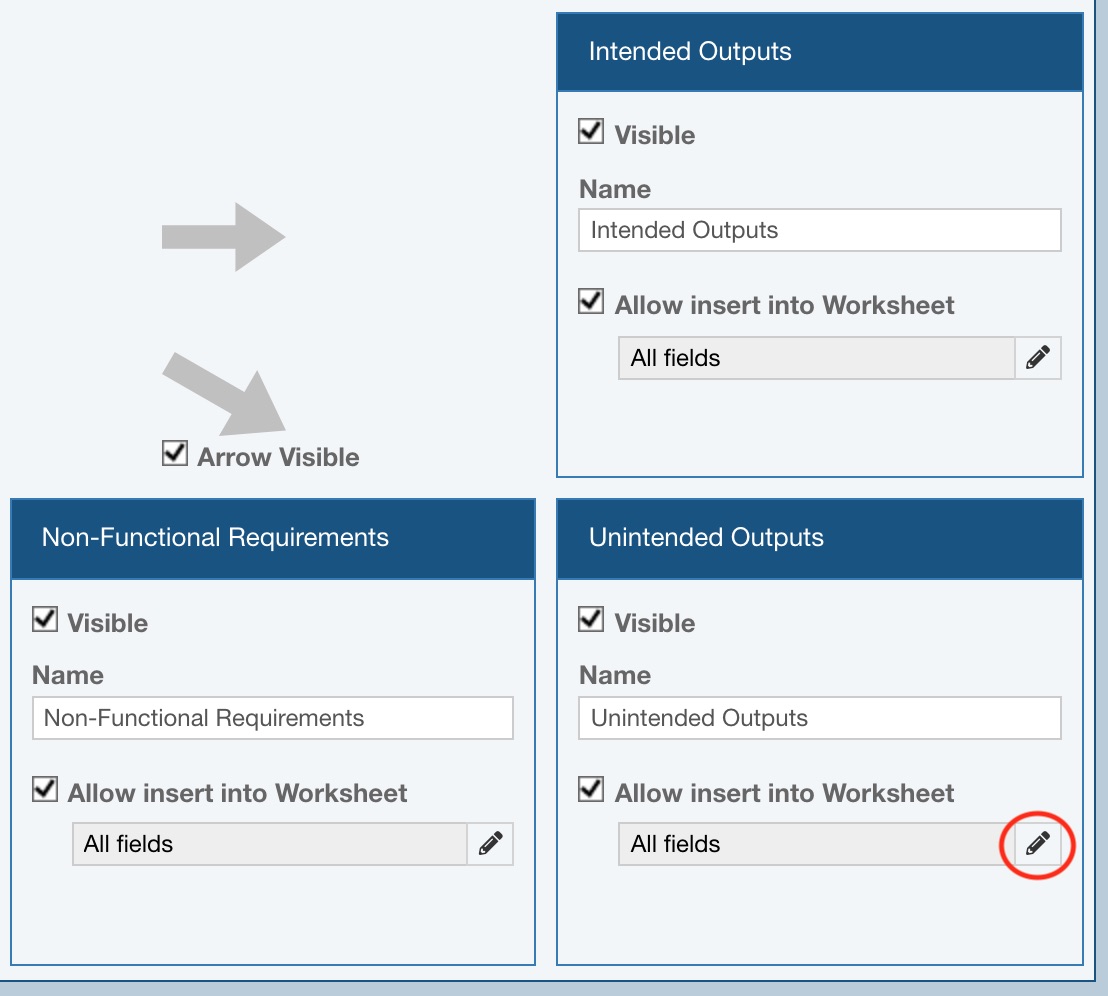
For each element, you can choose whether it will be visible on the worksheet using the Visible checkbox. You can also provide a custom Name for each element.
Additionally, you can use the Customize P-Diagram Name and Arrow Visible checkboxes to make final changes to the P-Diagram display.
When entering FMEA data, you can optionally insert P-Diagram data as described at the end of this section. You can control if data from an element can be inserted into the FMEA Worksheet using the Allow insert into Worksheet checkbox.
You can also specify which fields on the FMEA Worksheet can accept the data from the P-Diagram element using the control below the Allow insert into Worksheet checkbox.
Click the control button.
The Select Worksheet Fields dialog appears.
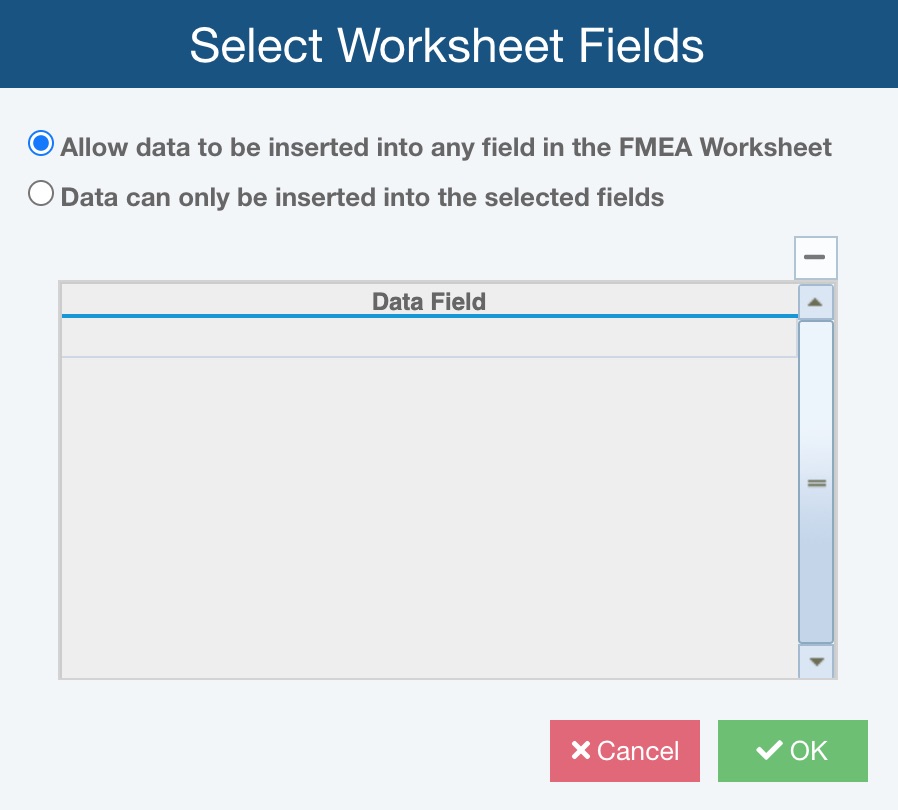
You can leave the default setting, Allow data to be inserted into any field in the FMEA Worksheet, or limit the fields by choosing Data can only be inserted into the selected fields.
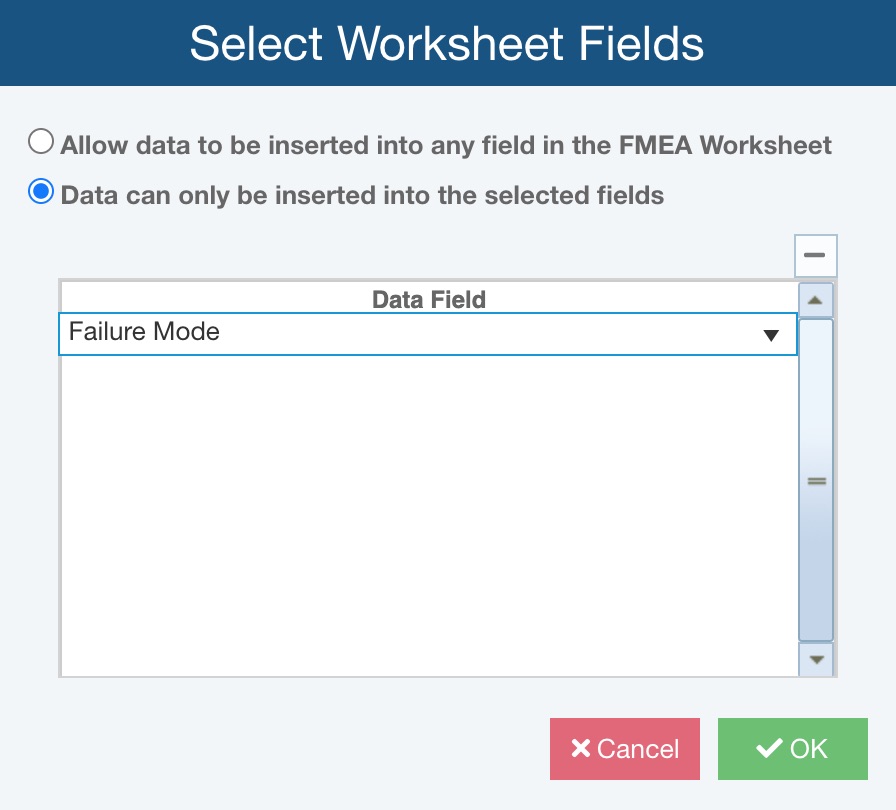
If you choose Data can only be inserted into the selected fields, use the dropdown list to choose the applicable FMEA fields where the data can be inserted.
The final step to customize the P-Diagram name is completed on the customized P-Diagram worksheet. When finished, click Close or Save and Close.
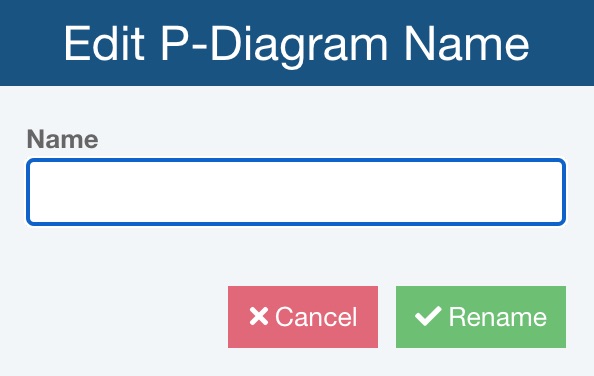
By default, the P-Diagram name is the same as the selected Subsystem Name. If you selected Customize P-Diagram Name, then a pencil icon will be available on the P-Diagram Worksheet to allow you to rename the P-Diagram.
To edit the name, click the pencil icon and on the Edit P-Diagram Name dialog, enter the preferred custom Name and click Rename.
4. For each element of the P-Diagram, add relevant content. Click in the empty row at the bottom of any element table and type to enter content and press Tab or Enter to complete it. Use the element toolbar buttons to delete or to move content up or down.

5. Any newly added P-Diagram content will show the red mark in the upper left corner, which indicates that the data in the field has not yet been saved. To save content, click Save in the P-Diagram worksheet toolbar.
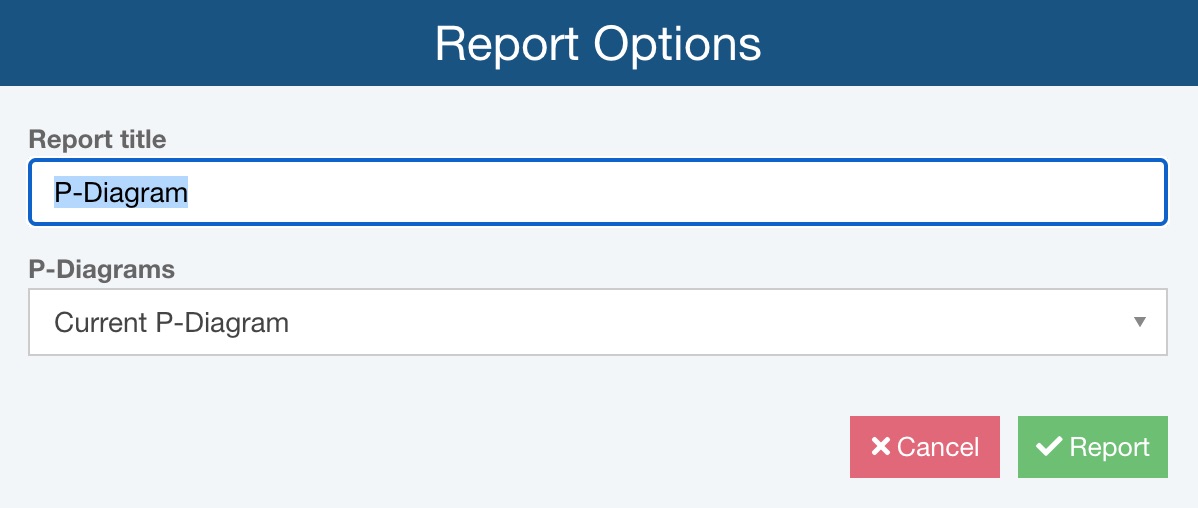
6. If you wish to print the P-Diagram, click Report in the sidebar.
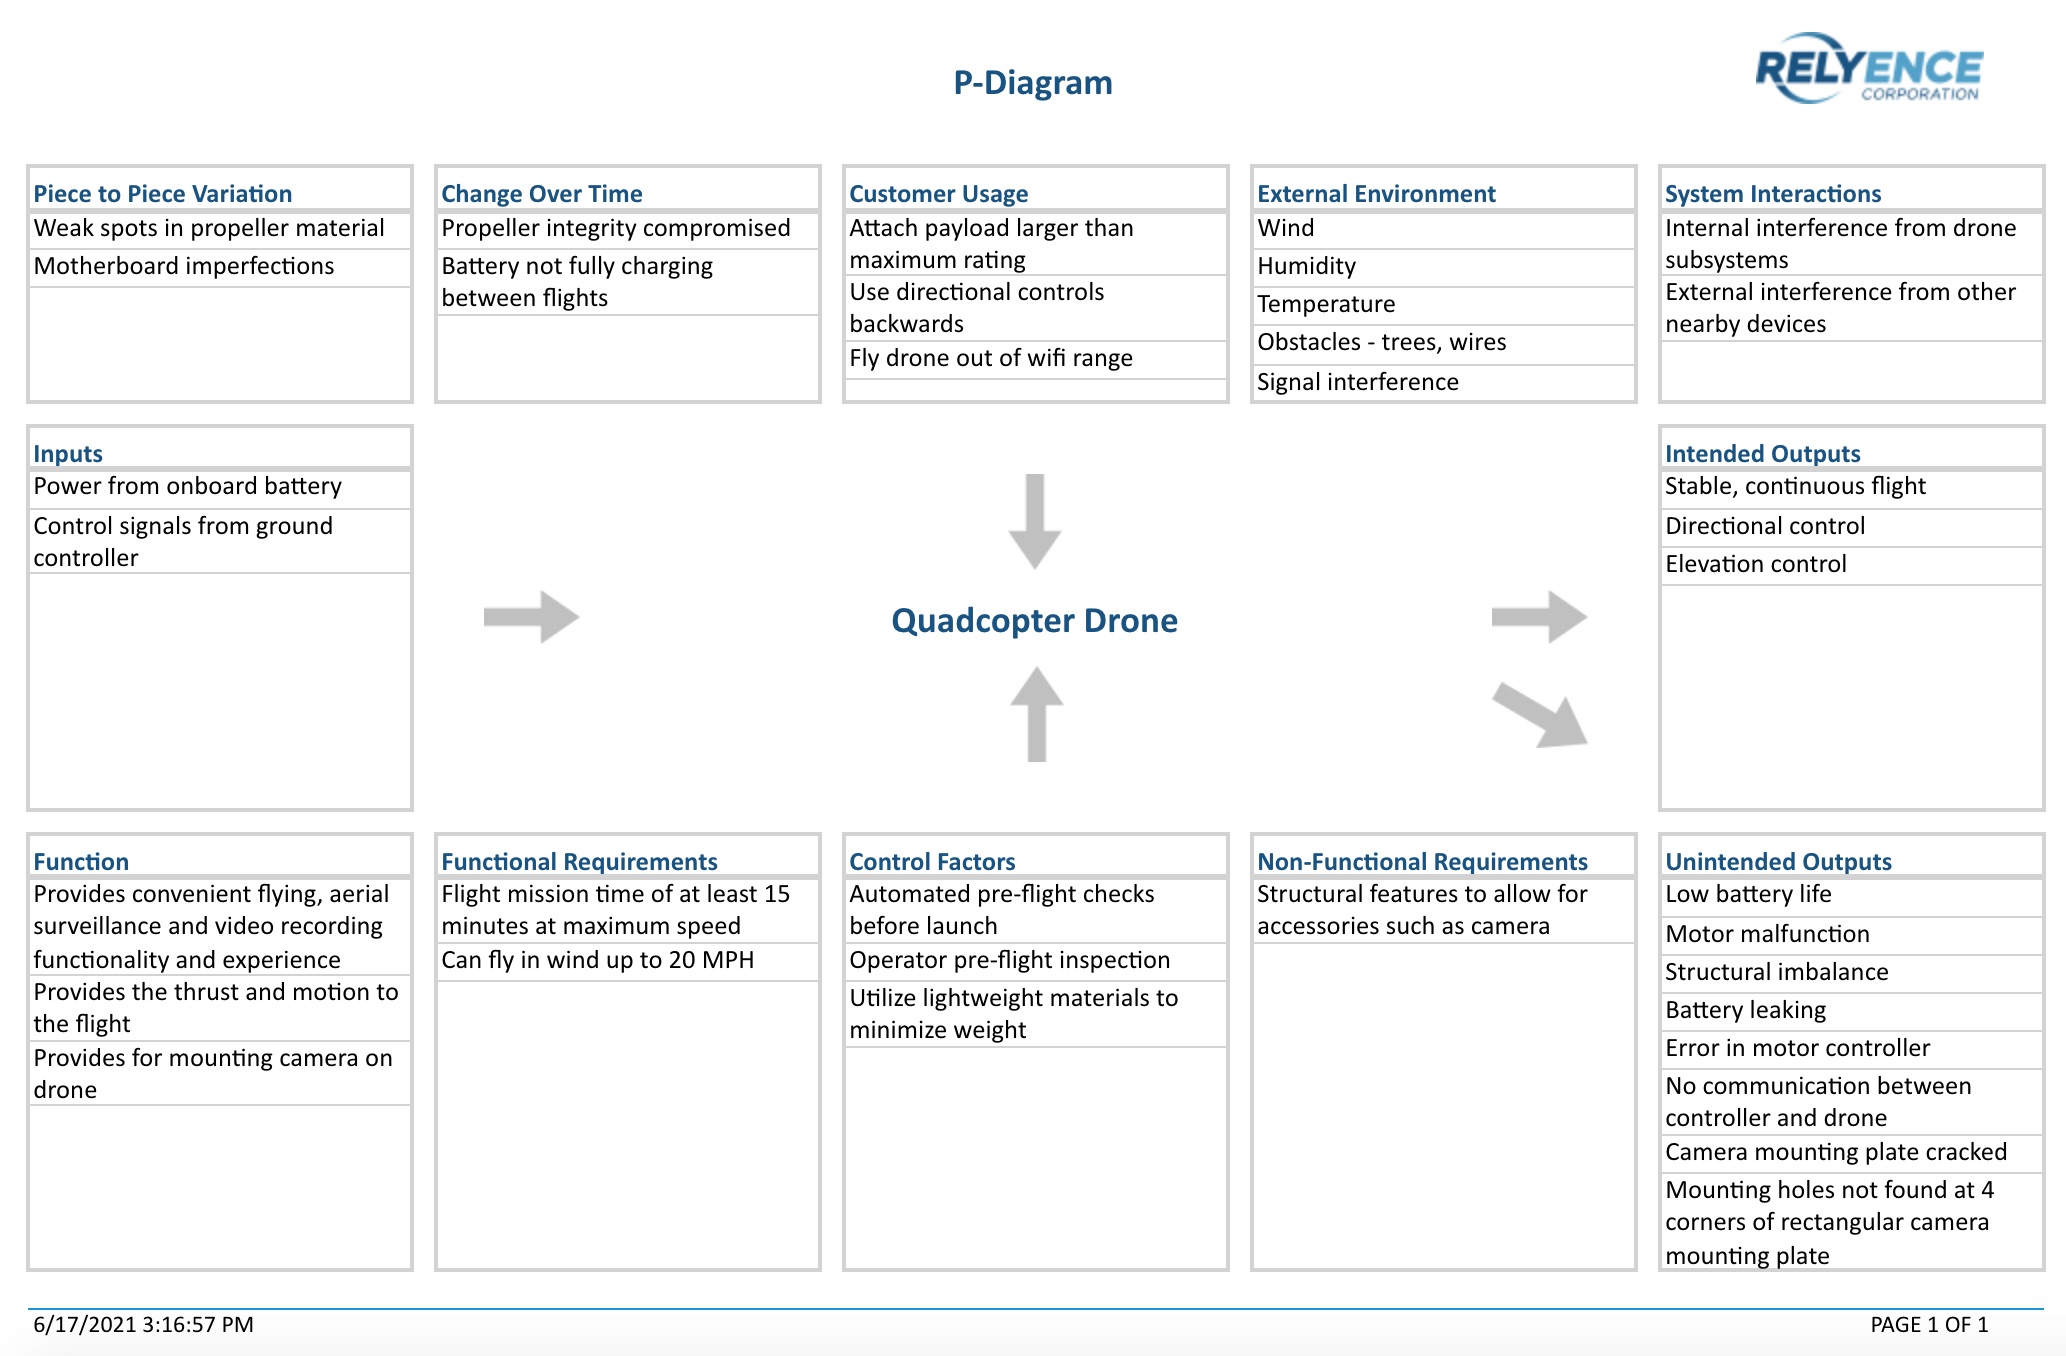
The Report Options dialog appears. Confirm or enter the Report title and P-Diagrams and click Report.
The P-Diagram report appears in a new browser tab. Review, save or print the report and close the report tab when finished.
Note that you can use the P-Diagram data to help streamline data entry on your FMEA Worksheet.
1. Select a cell in the column where you would like to add new data from the P-Diagram. For example, to enter a new Failure Mode into your FMEA Worksheet, select a cell in the Failure Mode column.
2. In the toolbar, click Insert and then P-Diagram Data.
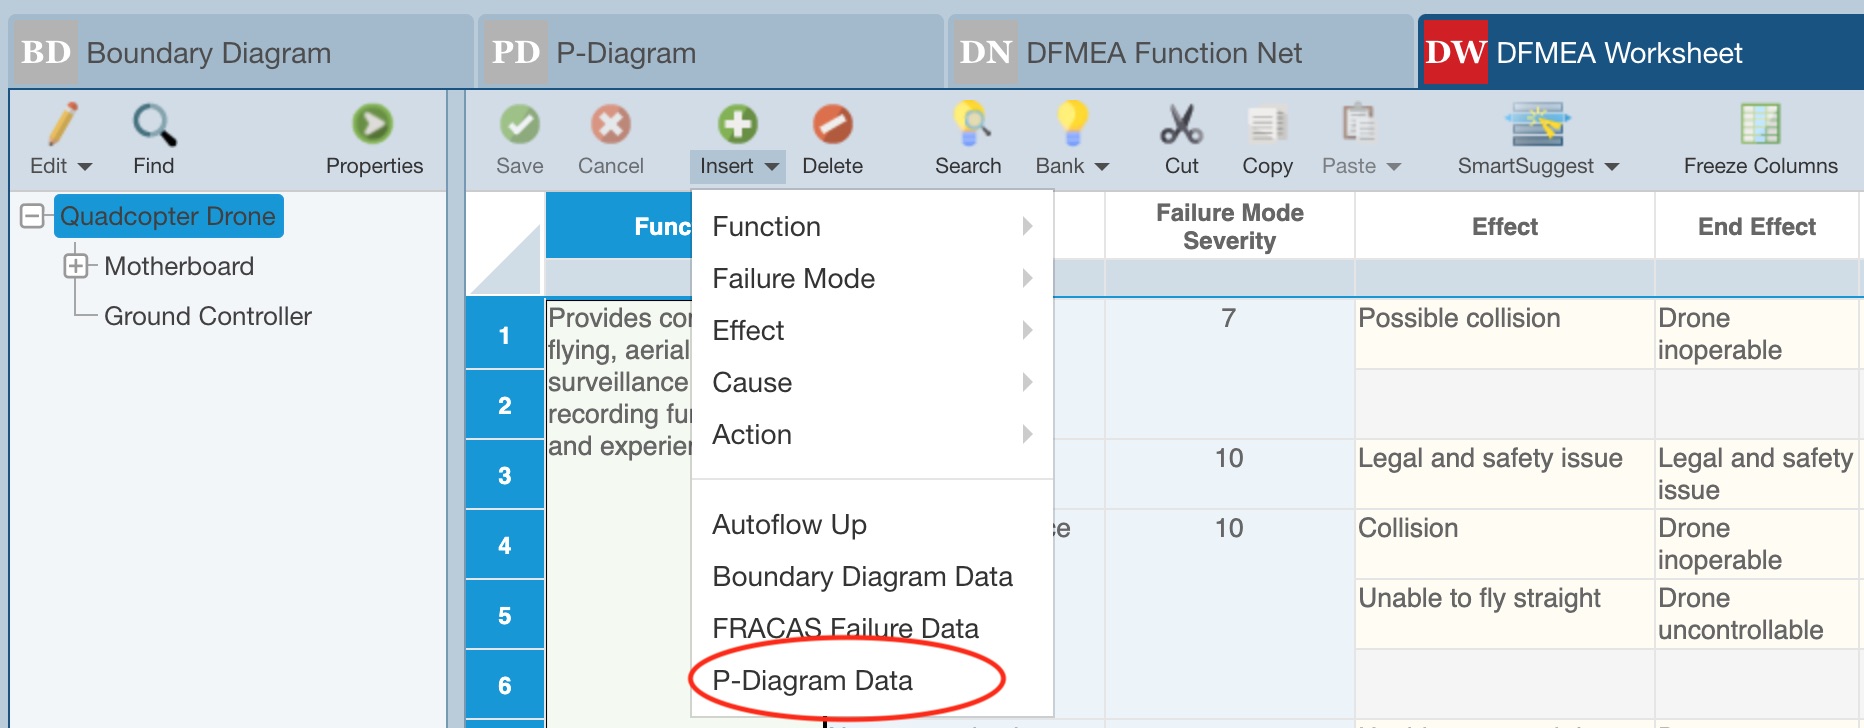
The Insert from P-Diagram dialog appears.
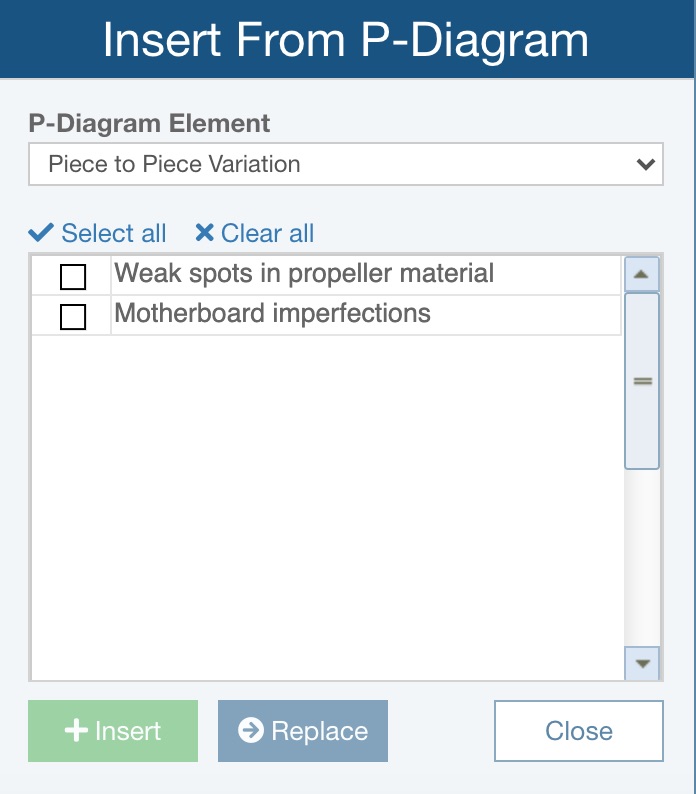
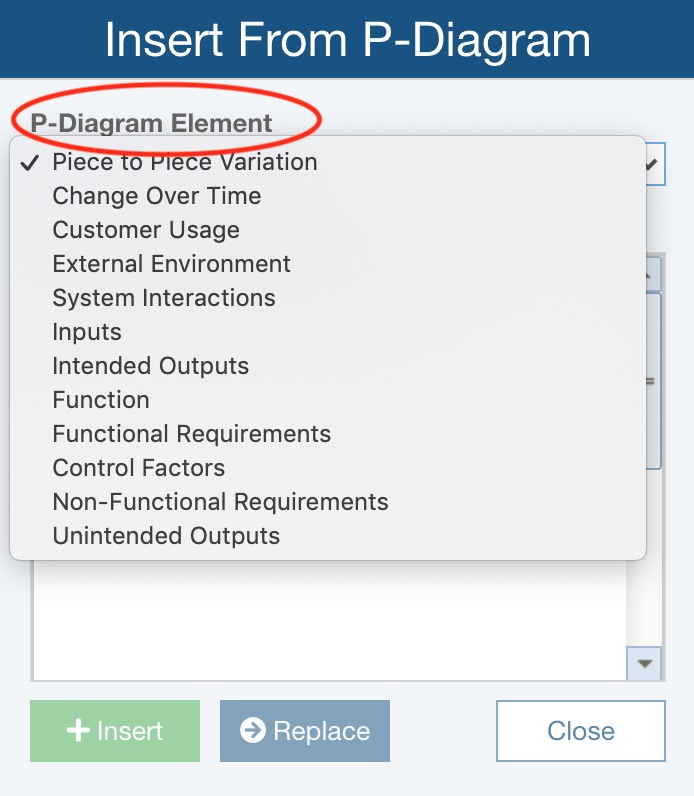
3. Select the appropriate P-Diagram Element. Available P-Diagram Element choices are based on the P-Diagram customization described above; only those marked with Allow insert into Worksheet will be shown in the list. Also, if the data for any of the P-Diagram Elements is set to be inserted to only specified fields, a Limited Insert warning will appear and indicate to which FMEA Worksheet fields the P-Diagram Element data can be inserted.
4. Click to select one or more rows containing the data to be added.
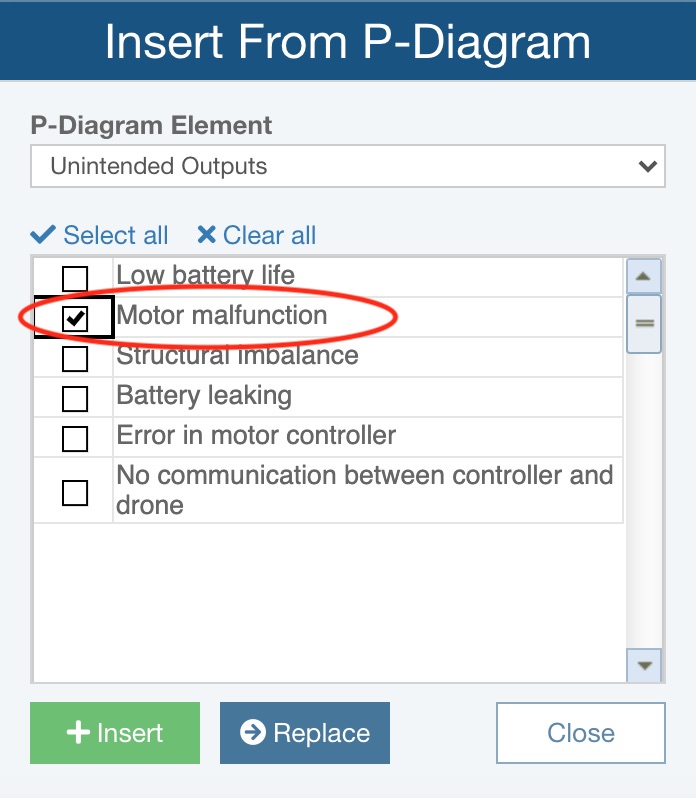
5. Click Insert to add a new record or Replace to replace the existing record.
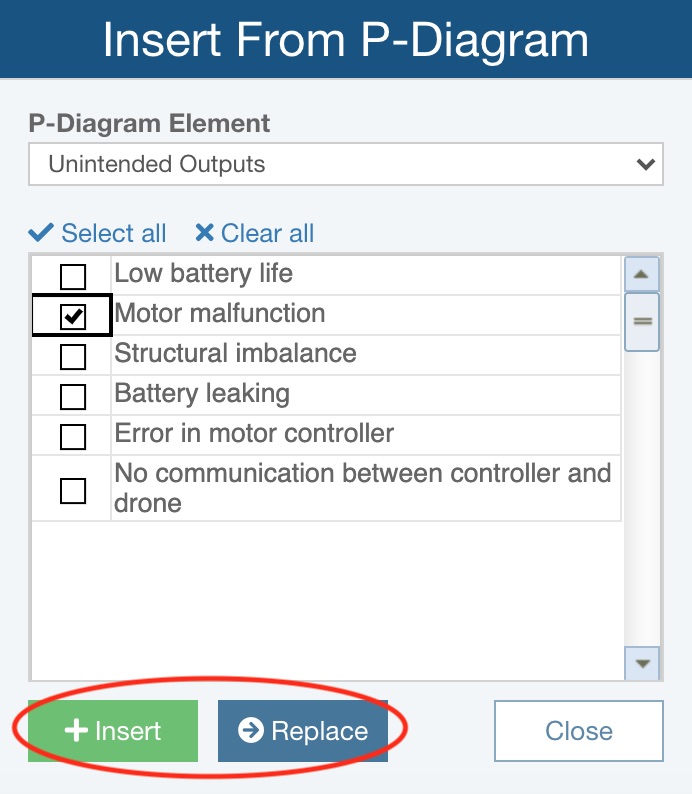
Note that if Insert and Replace are both disabled, it indicates that you cannot add the type of P-Diagram data to the FMEA Worksheet field selected. Any such limitations are specified when customizing the P-Diagram, as described above. If there are any such limitations, details can be confirmed by hovering the cursor over the information icon.
Step 4: Create DFMEA Nets (Function Nets and/or Failure Nets)
Note: While working on the Function Nets and/or Failure Nets for your system, you can add Functions, Focus Failures (Failure Modes), Effects and Causes; these DFMEA elements are then also added to the DFMEA Worksheet. Or, you can enter details like Function, Failure Mode, Effect, and Cause directly on the DFMEA Worksheet and then return to the Failure Nets and Function Nets to connect Functions, Modes, Effects and Causes, as needed.
Creating DFMEA Function Nets and Failure Nets Before Data is Added to the DFMEA Worksheet
Use these steps if you're starting with the Function Nets and Failure Nets with a blank DFMEA Worksheet. Or, use the steps that follow if you're building the Function Nets and Failure Nets after DFMEA Worksheet data has been added.
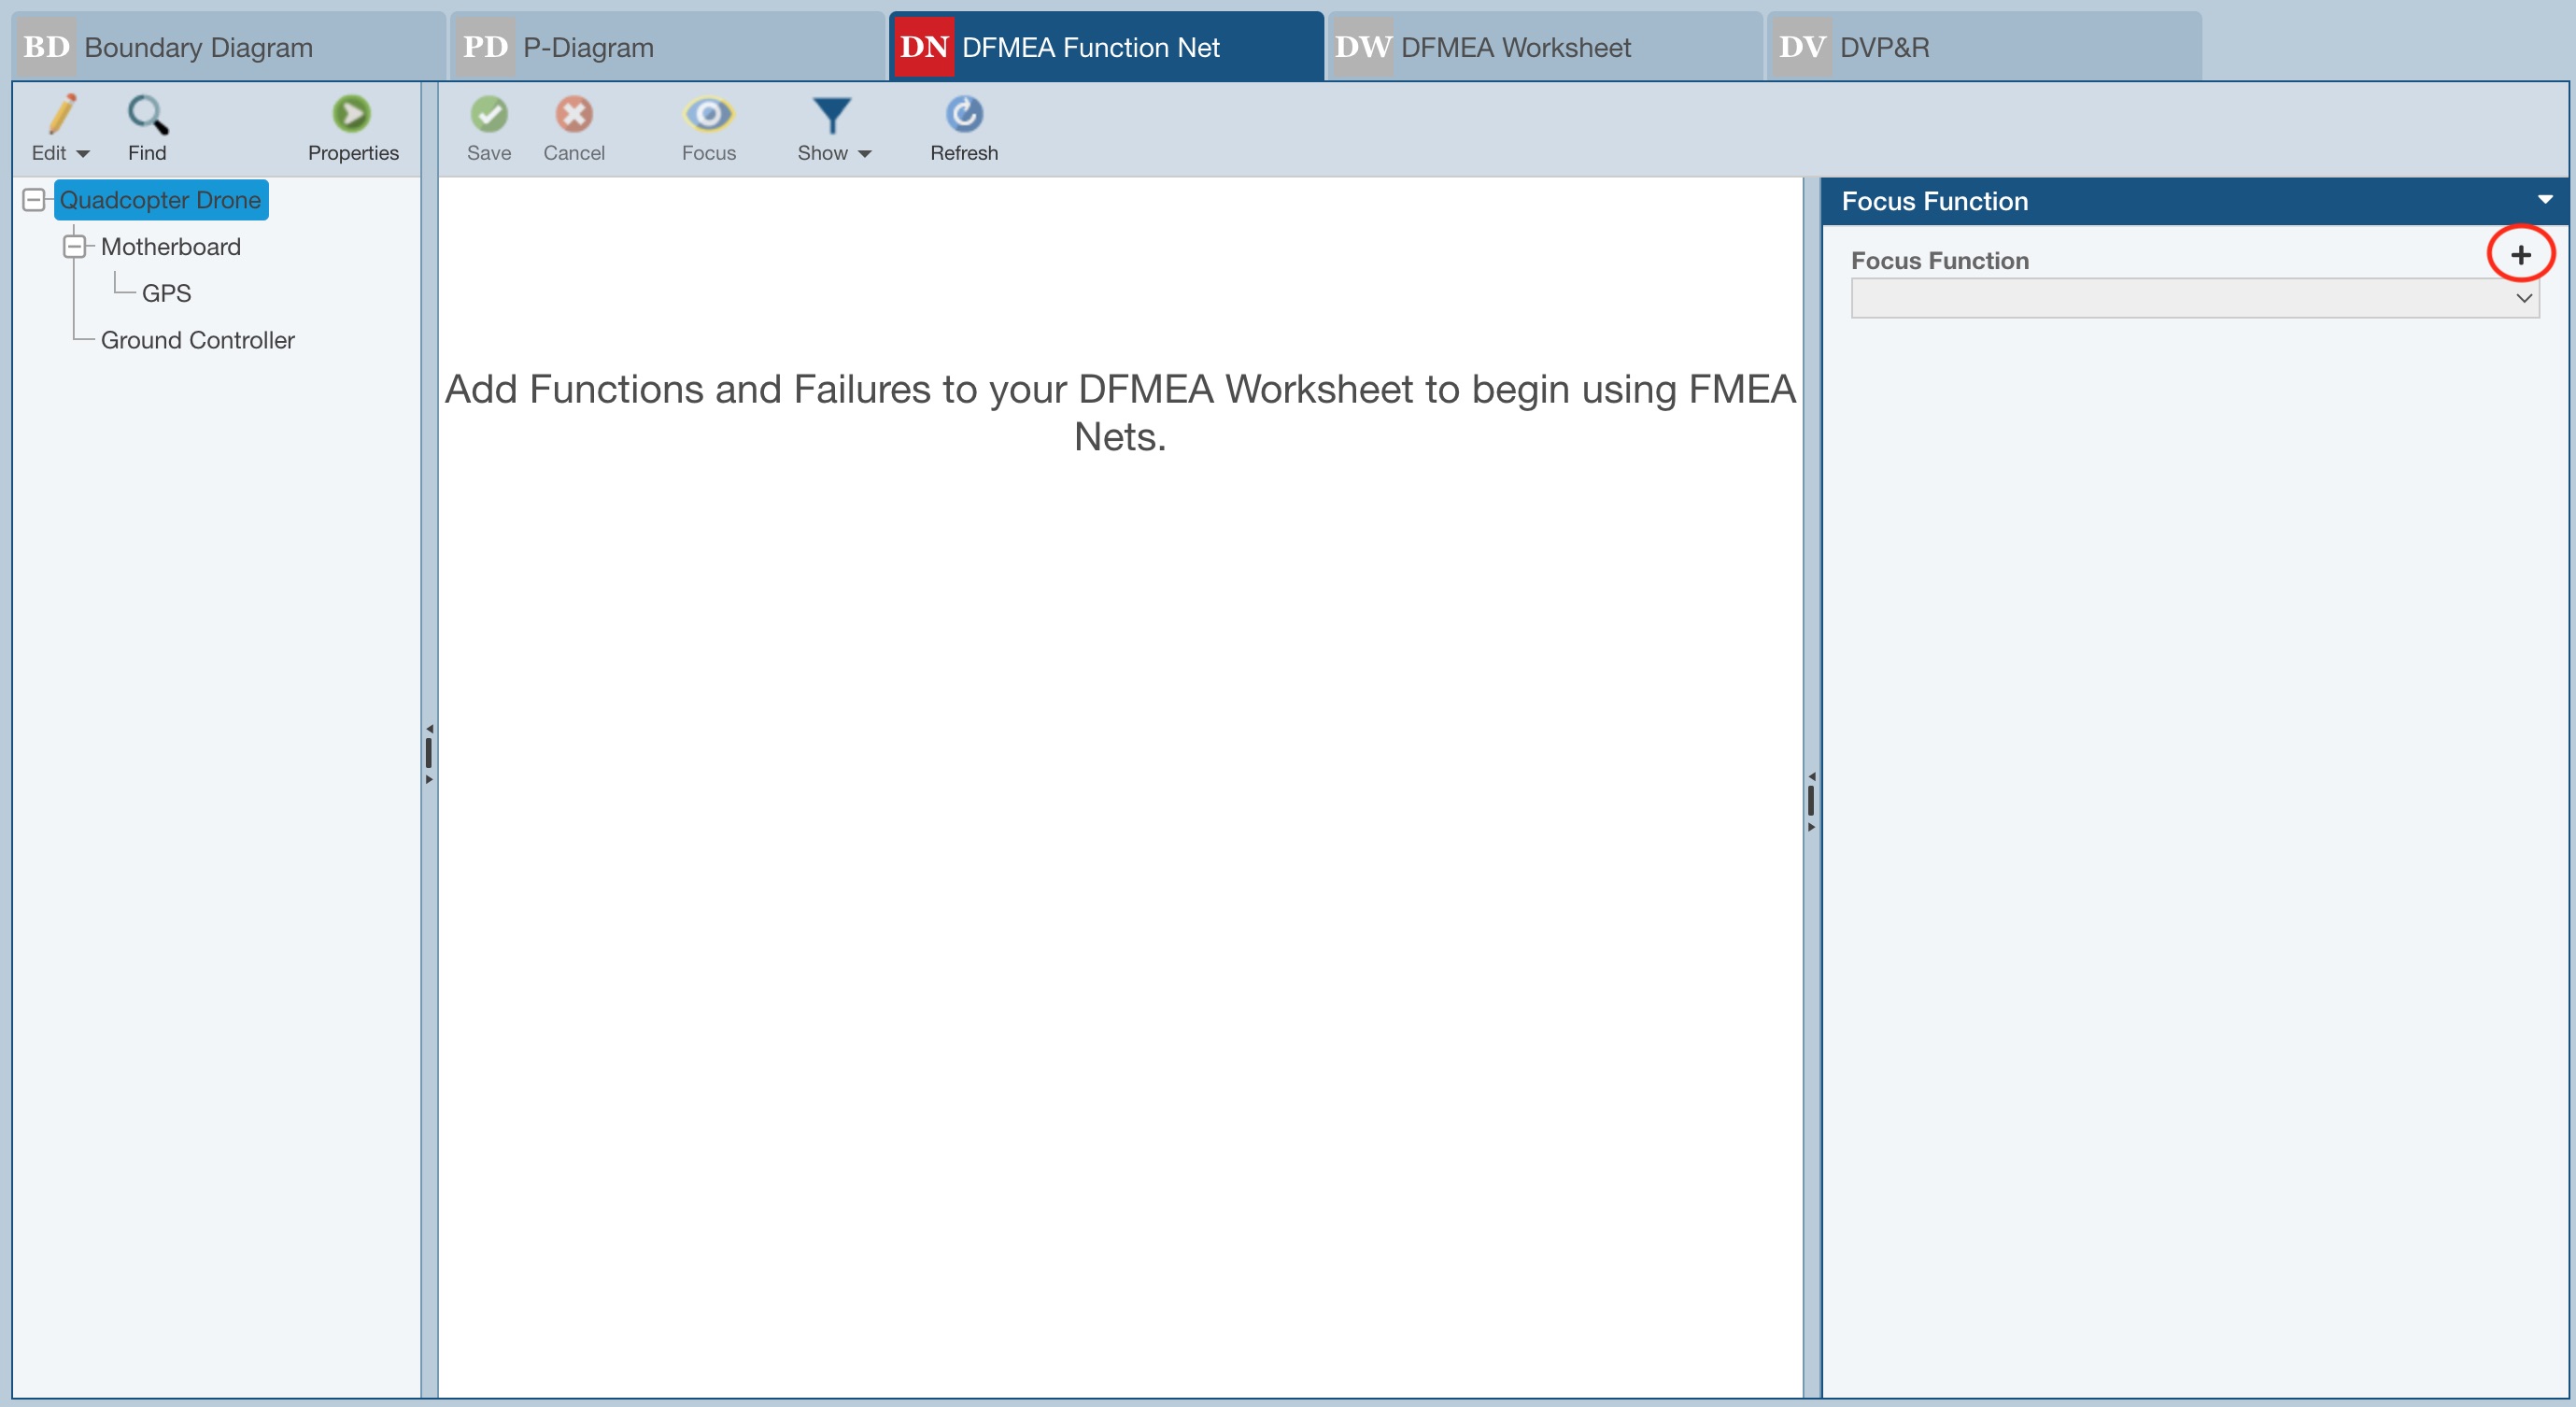
If no Functions and Failures (Failure Modes) exist on the DFMEA Worksheet for the selected Analysis Tree item, you'll see the note indicating Add Functions and Failures to your DFMEA Worksheet to begin using FMEA Nets.
![]()
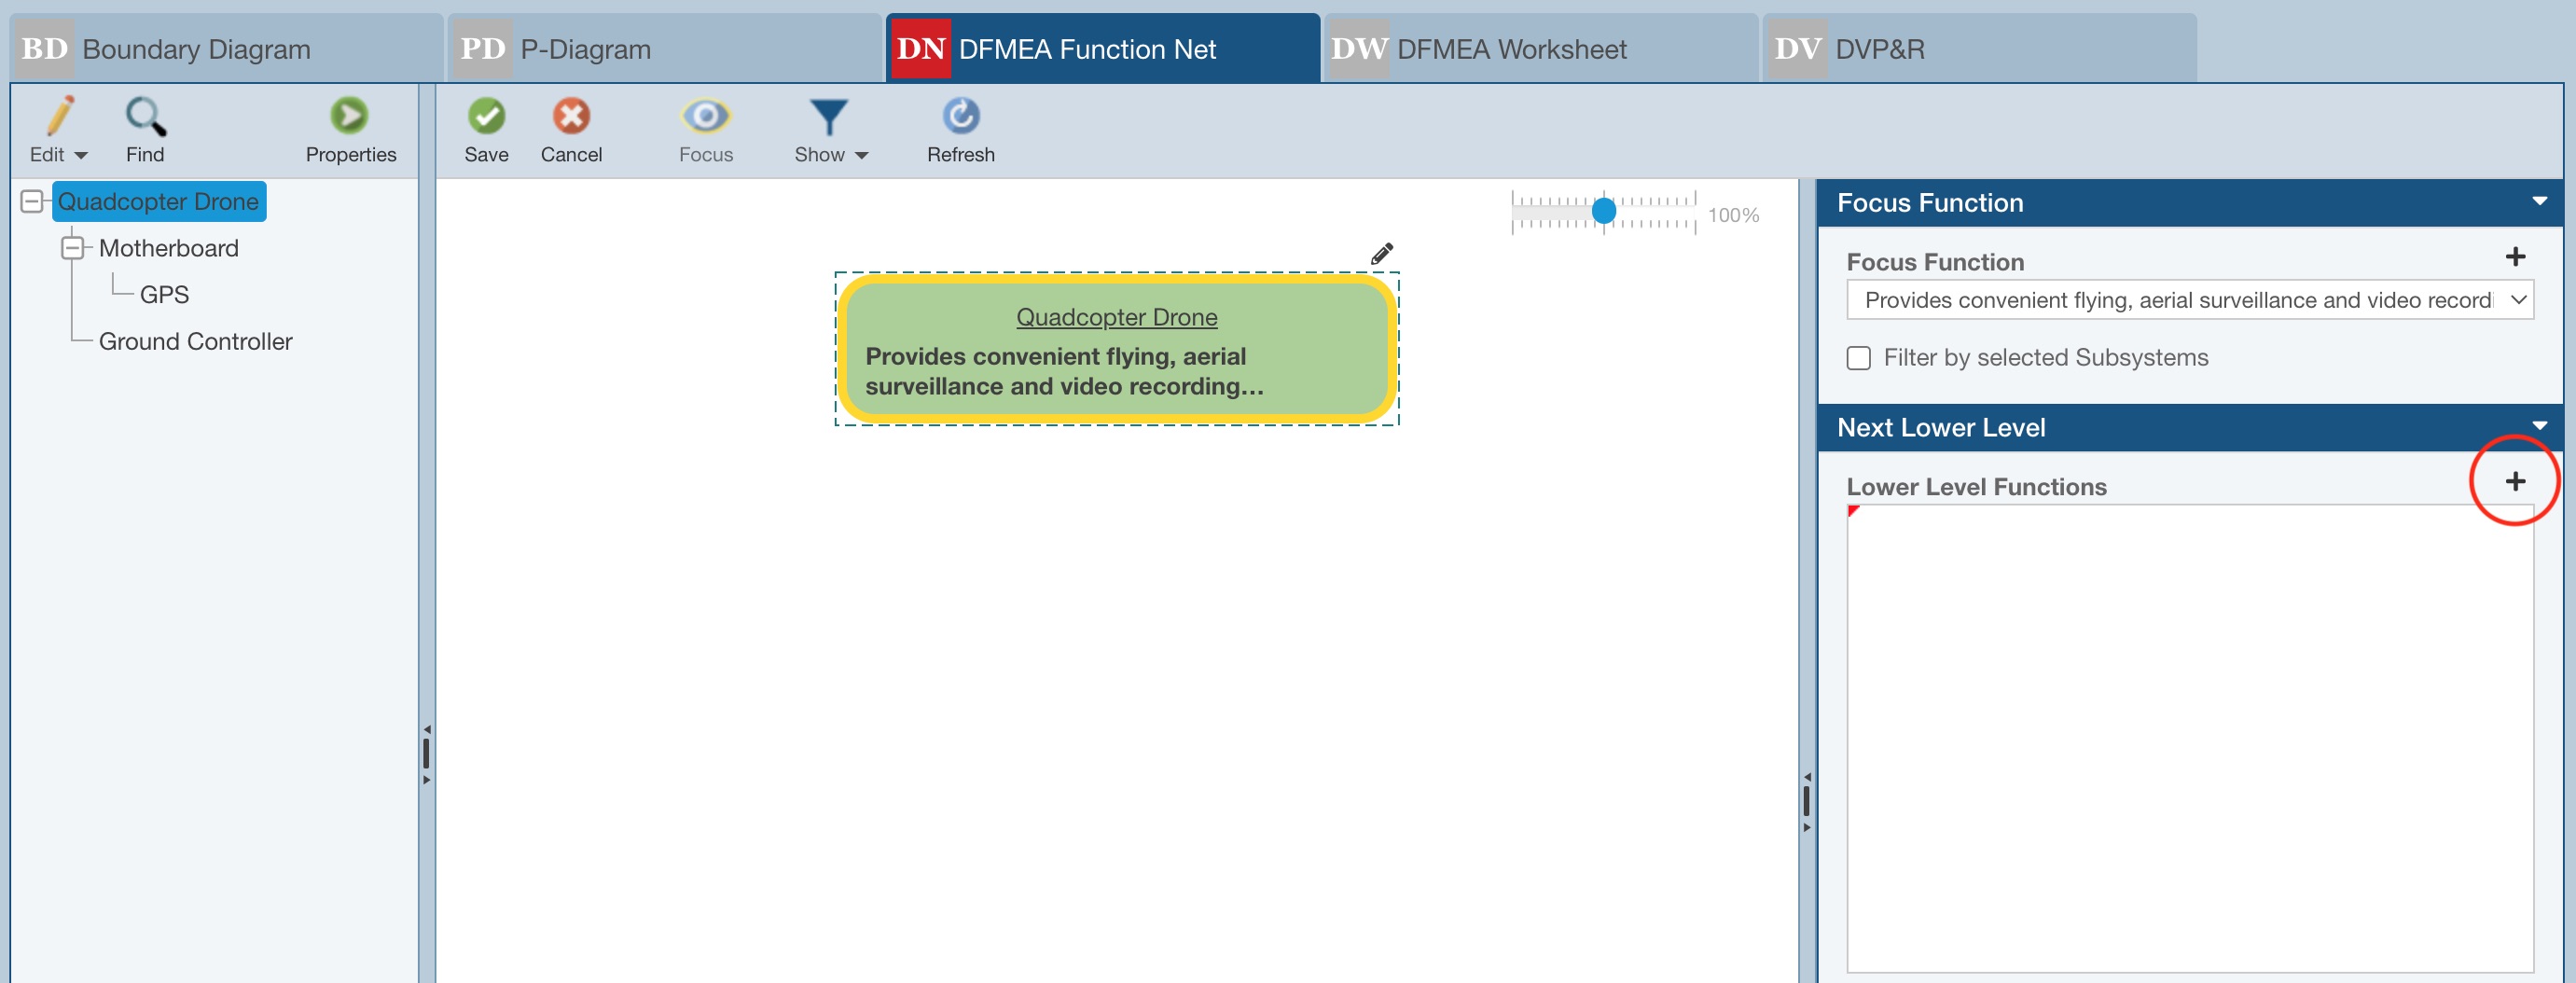
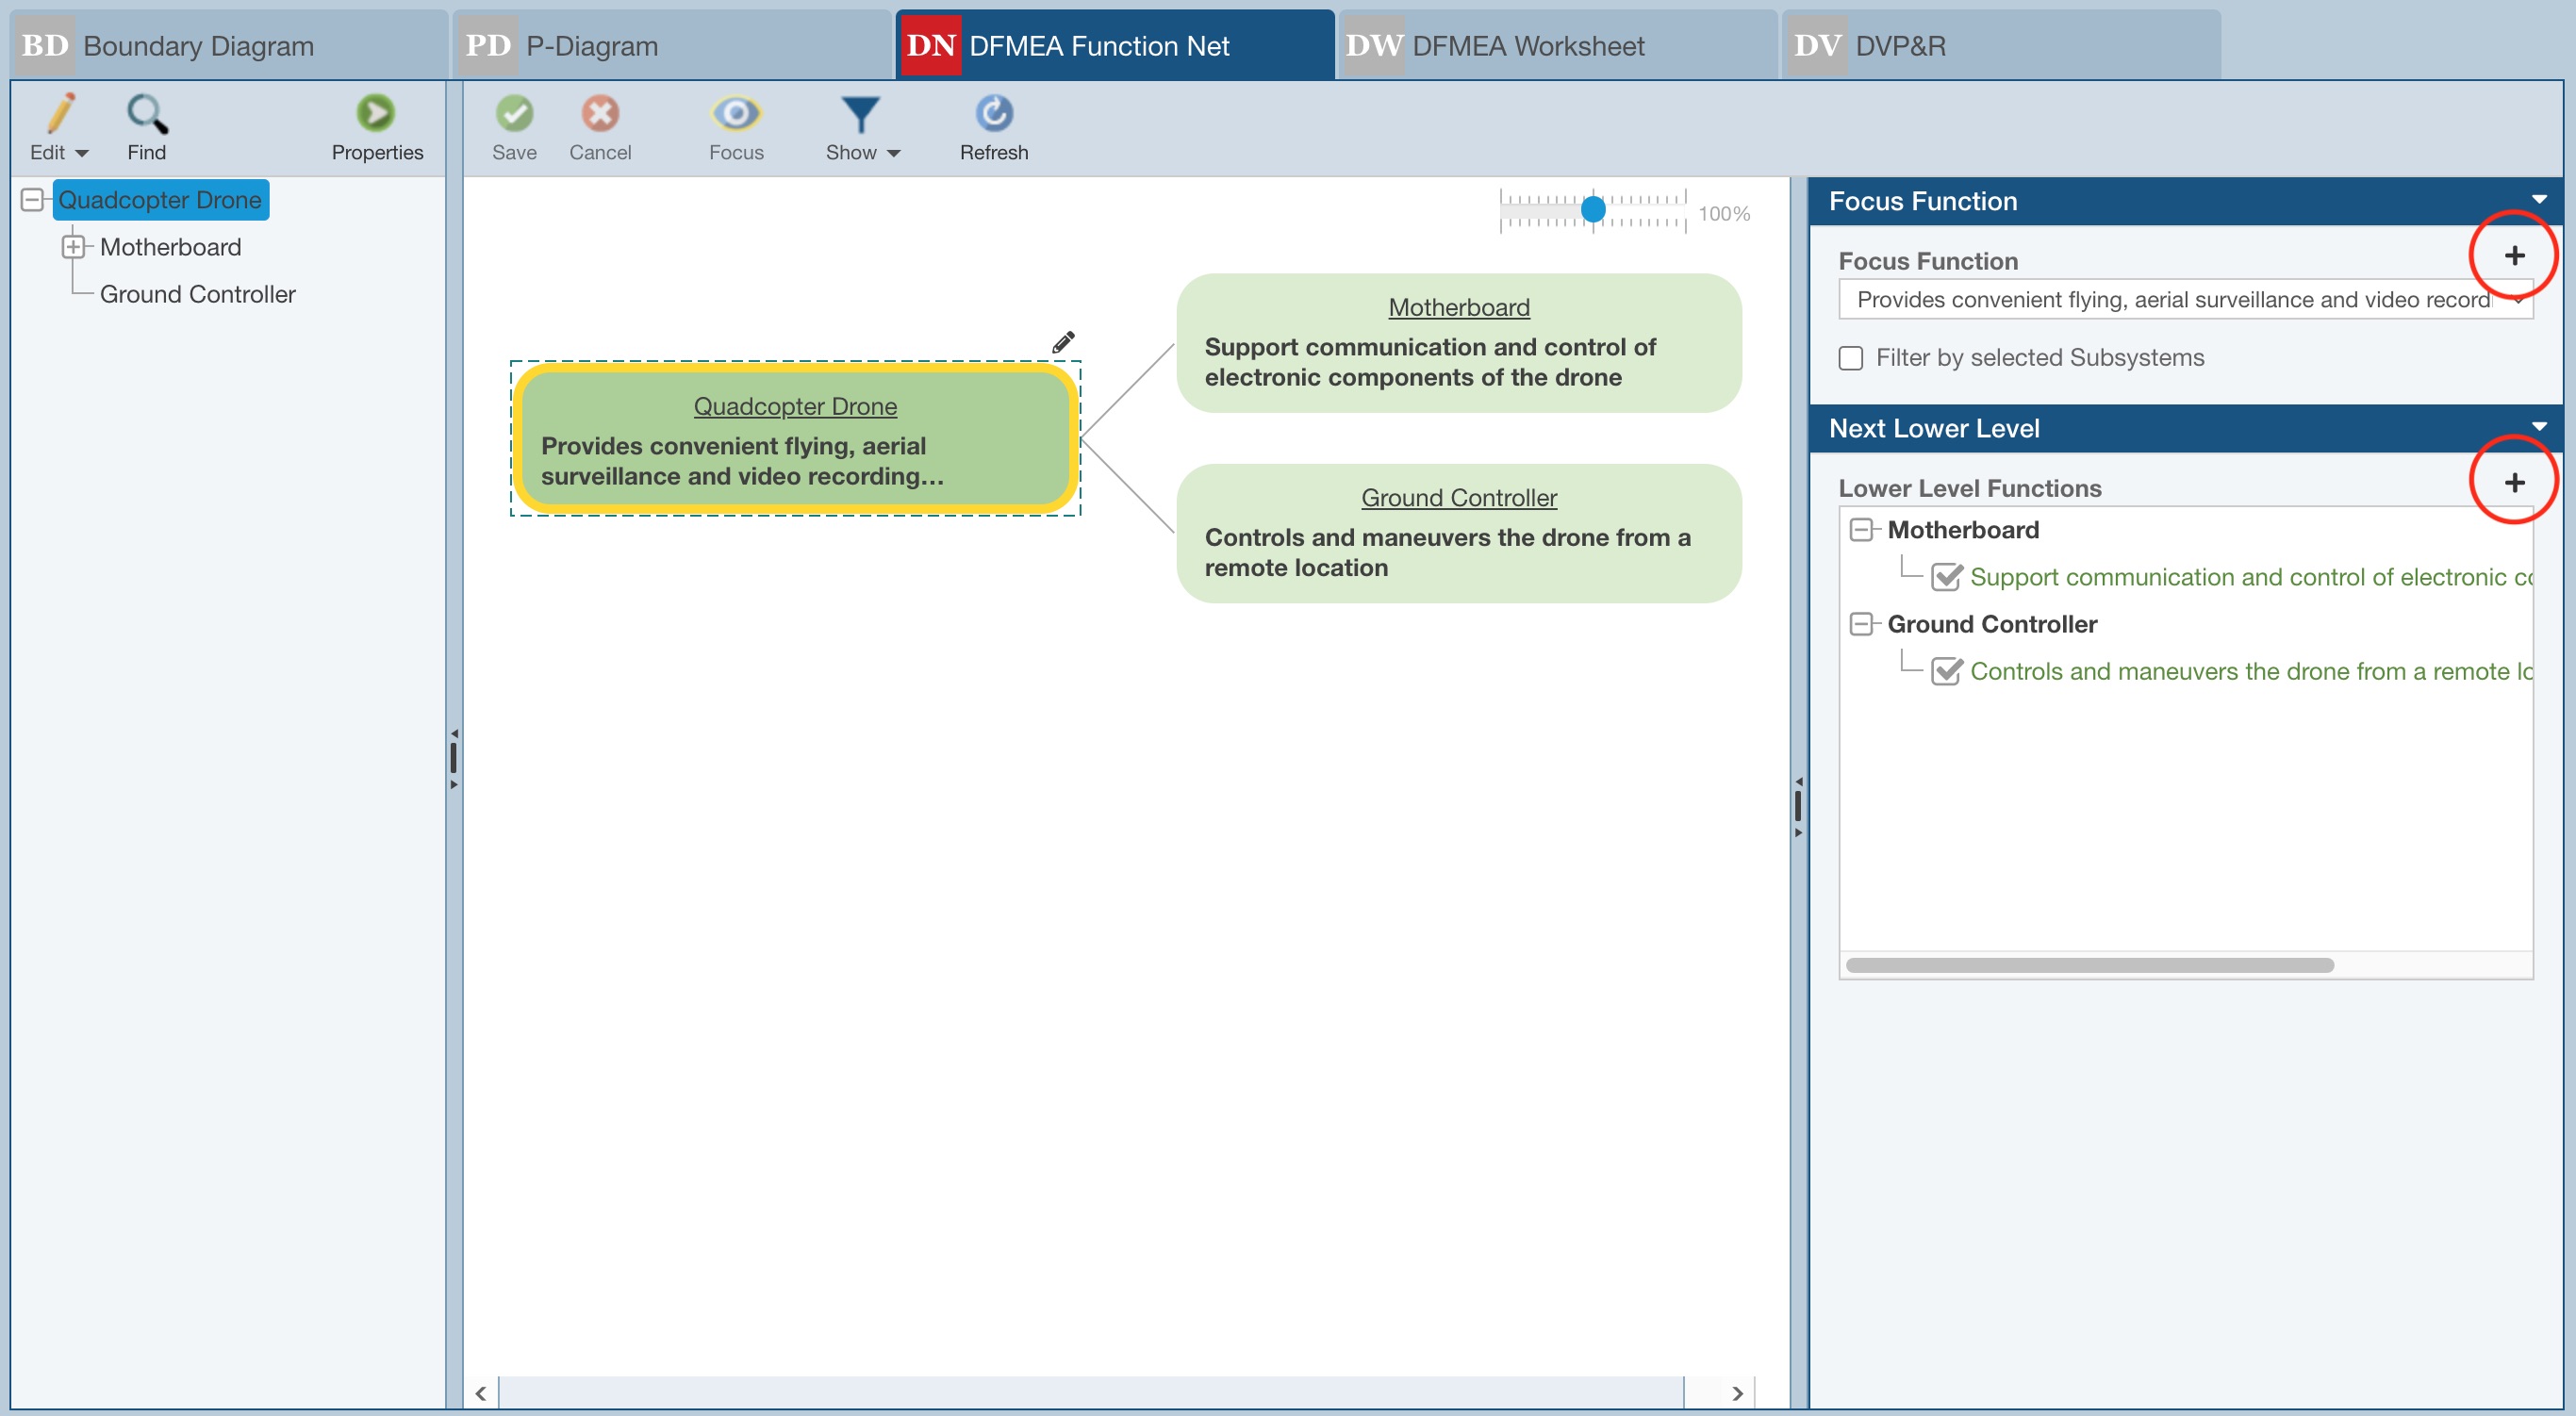
1. If you prefer to add the Functions and Failures via the FMEA Nets tab, you can start by adding the Focus Function to the selected Analysis Tree item by using the Add button in the Focus Function pane.
2. On the Add Focus Function dialog, enter the text for the Focus Function and click OK.
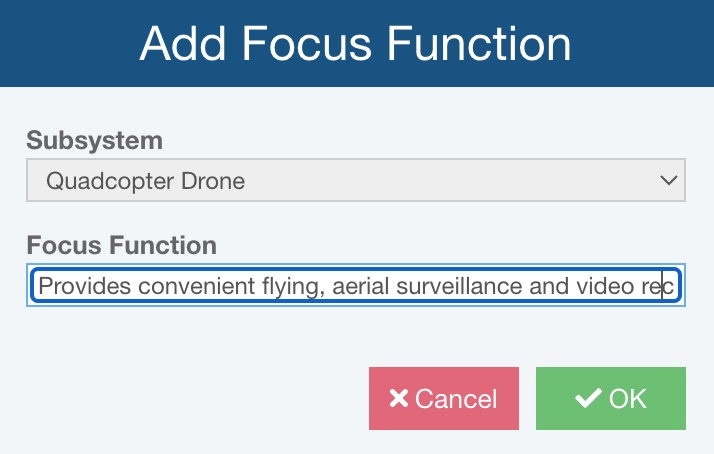
The Focus Function is added to the DFMEA Nets tab.
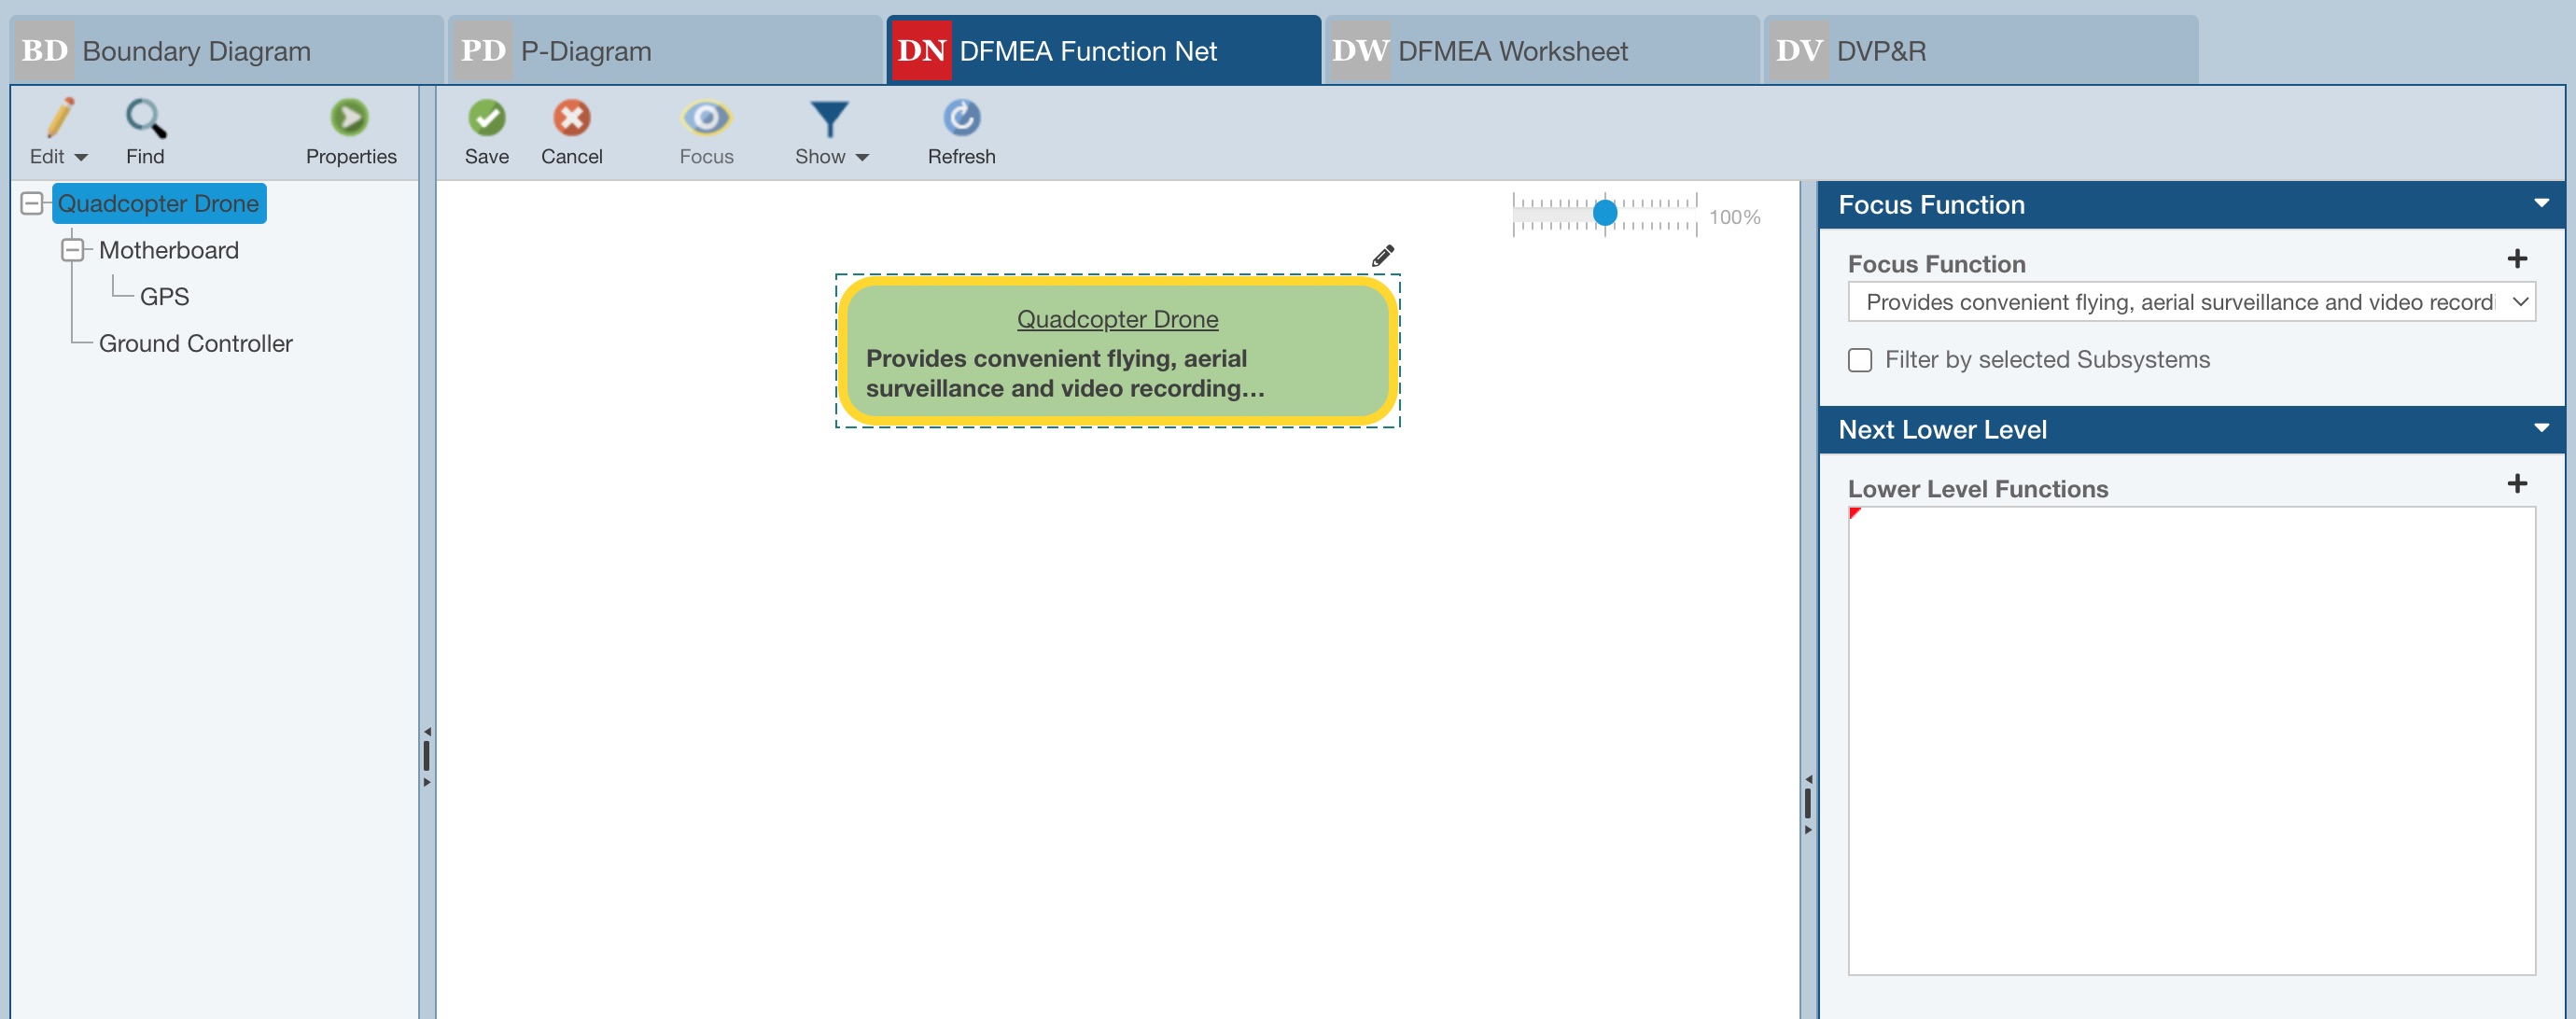
3. If needed, use the Add button to add a Lower Level Function.
Add the Lower Level Function details on the Add Lower Level Function dialog and click OK.
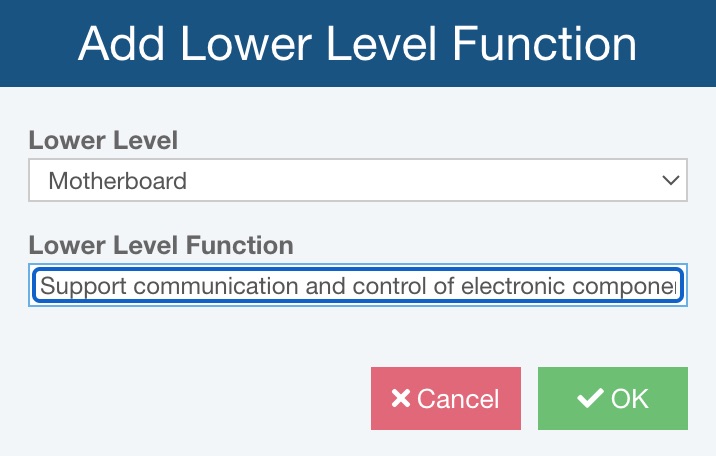
The Lower Level Function is added to the DFMEA Nets tab.
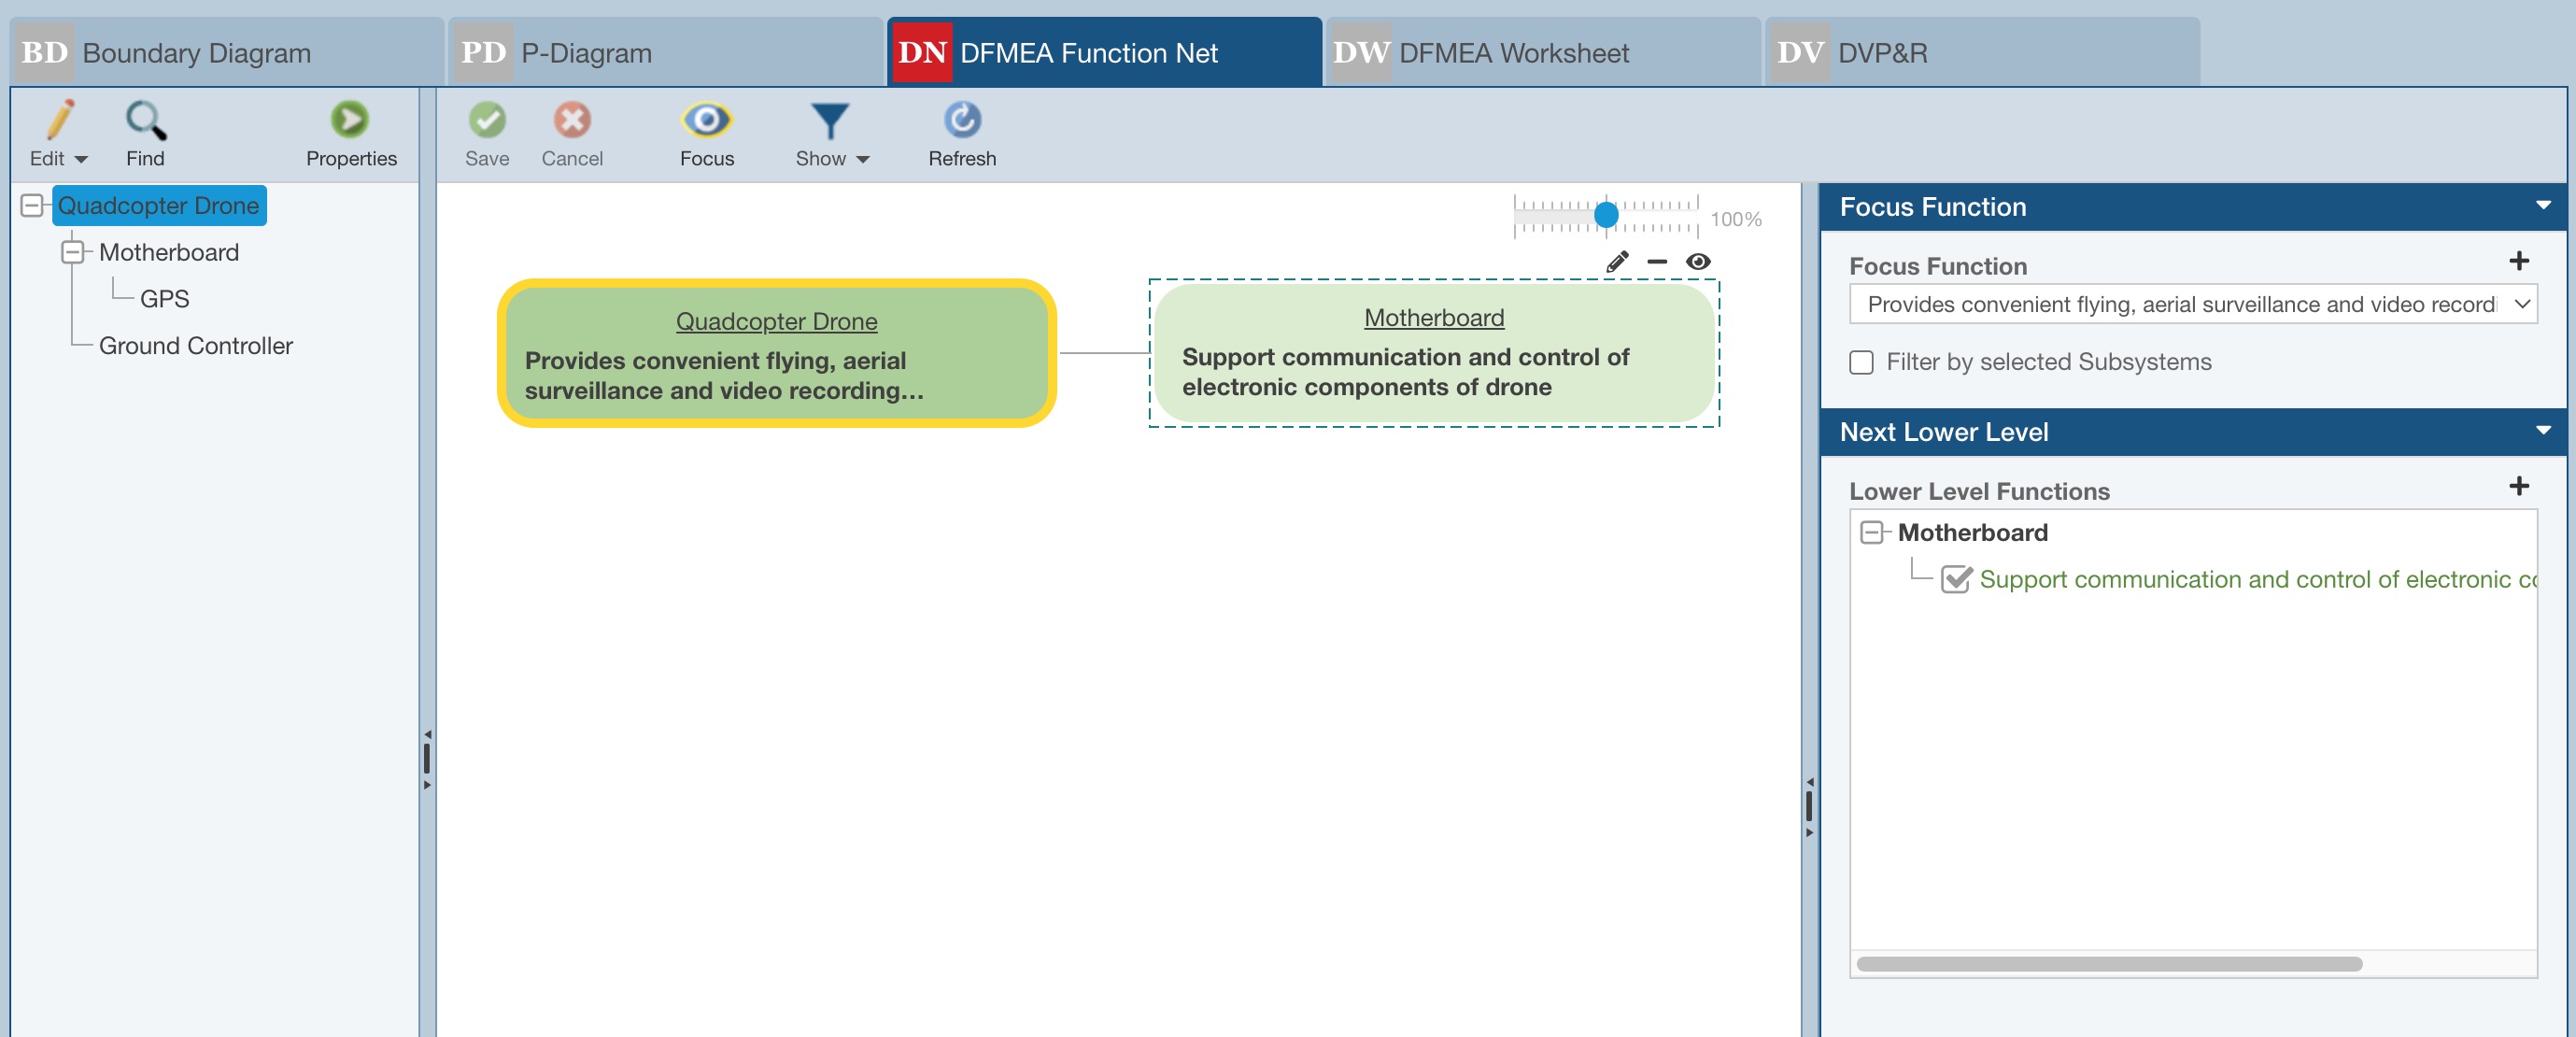
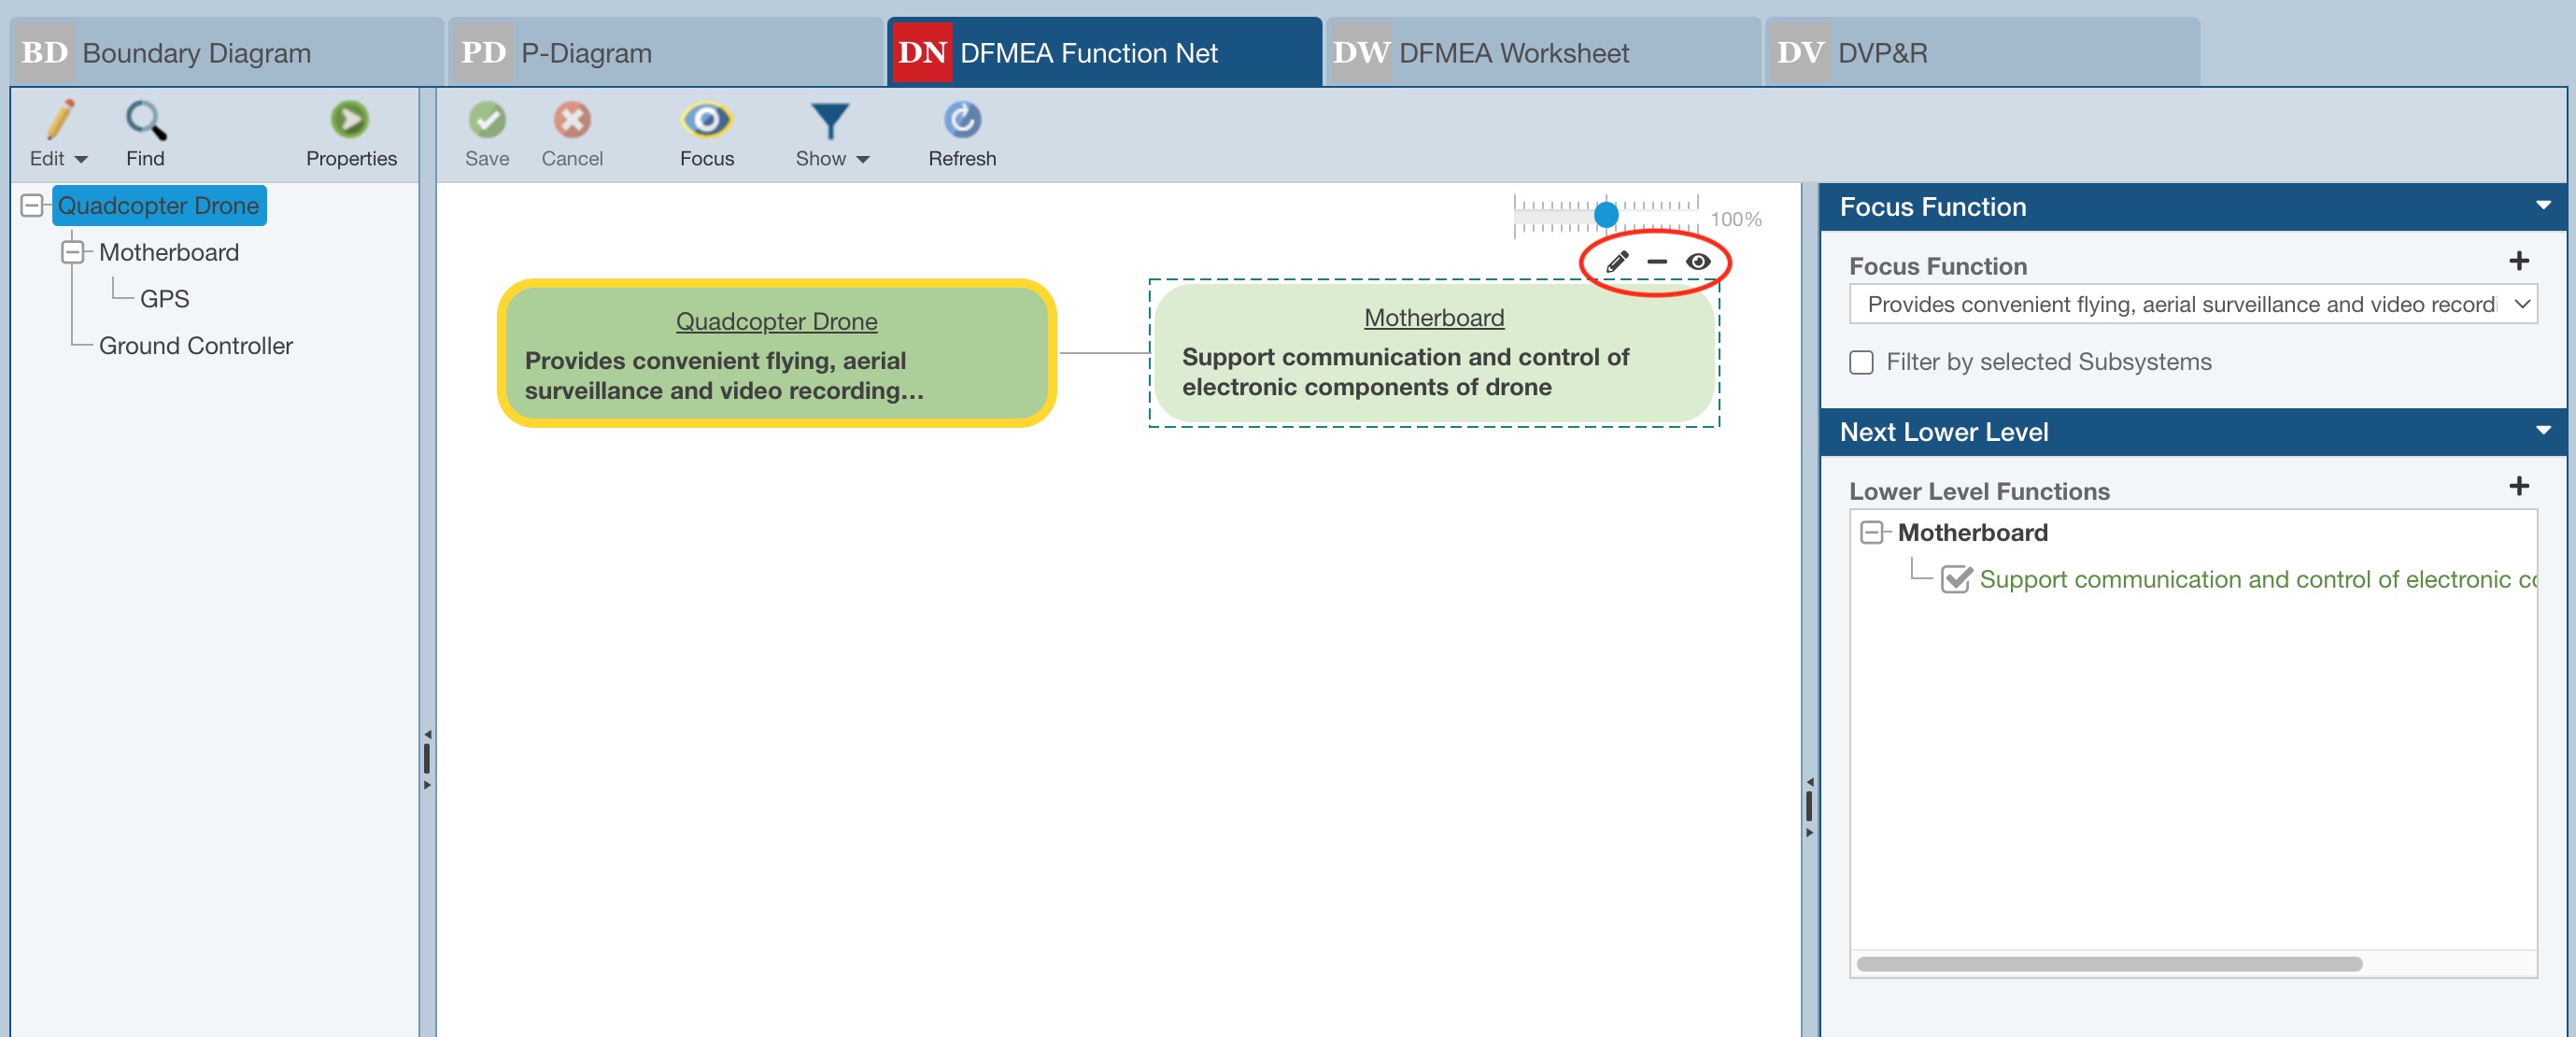
Note that you can use the Edit, Remove, and Focus buttons to edit the text for the function, remove the function, or make the selected function the Focus Function on the DFMEA Nets tab.
Also note that as Function data is added to the DFMEA Function Net tab, corresponding Function data and related details are added to the DFMEA Worksheet as shown in the example below.
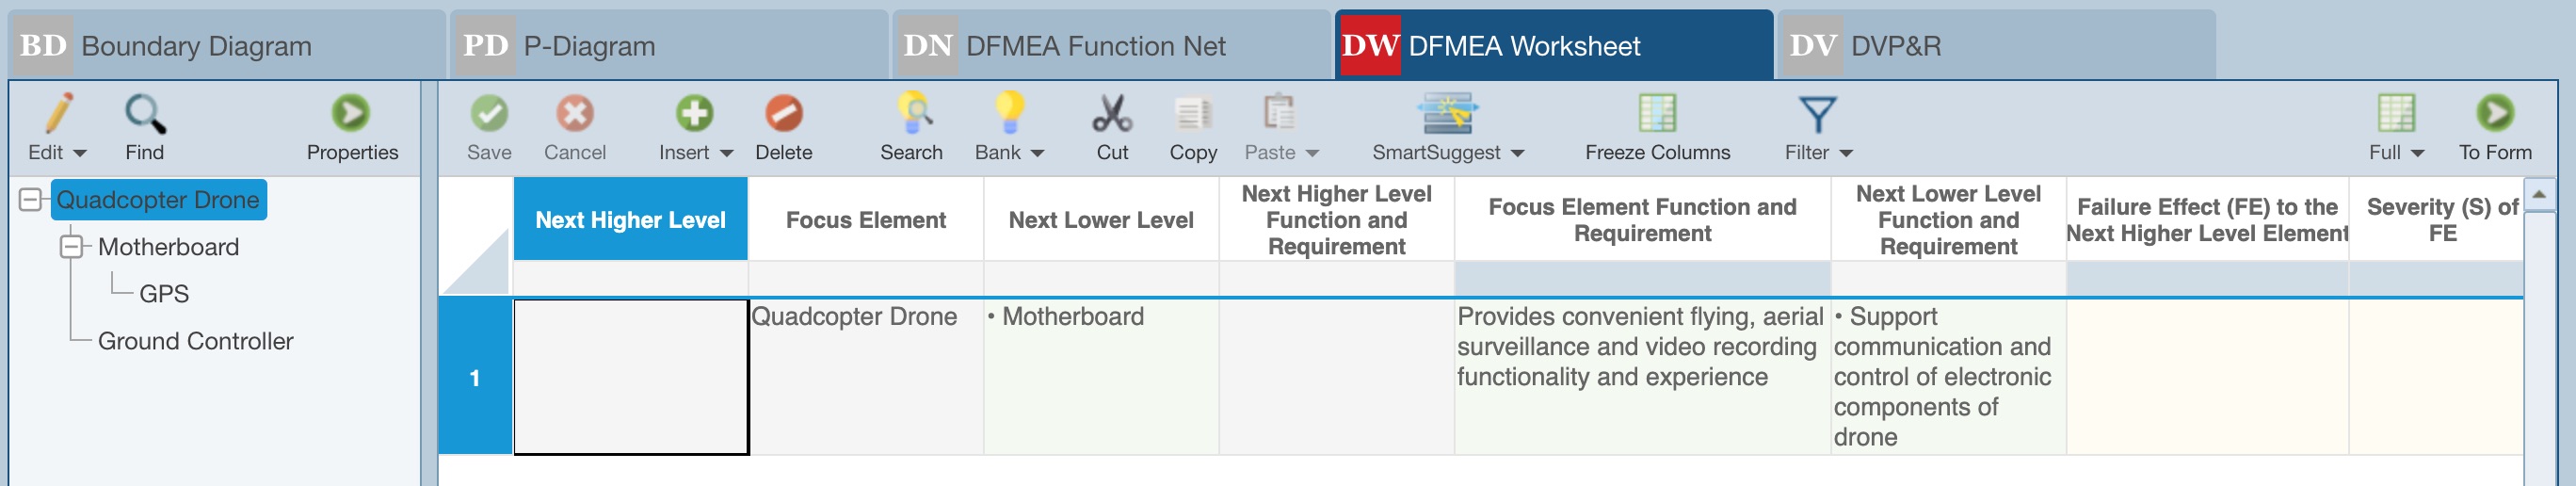
Continue adding necessary Function data for the various items in the Analysis Tree.
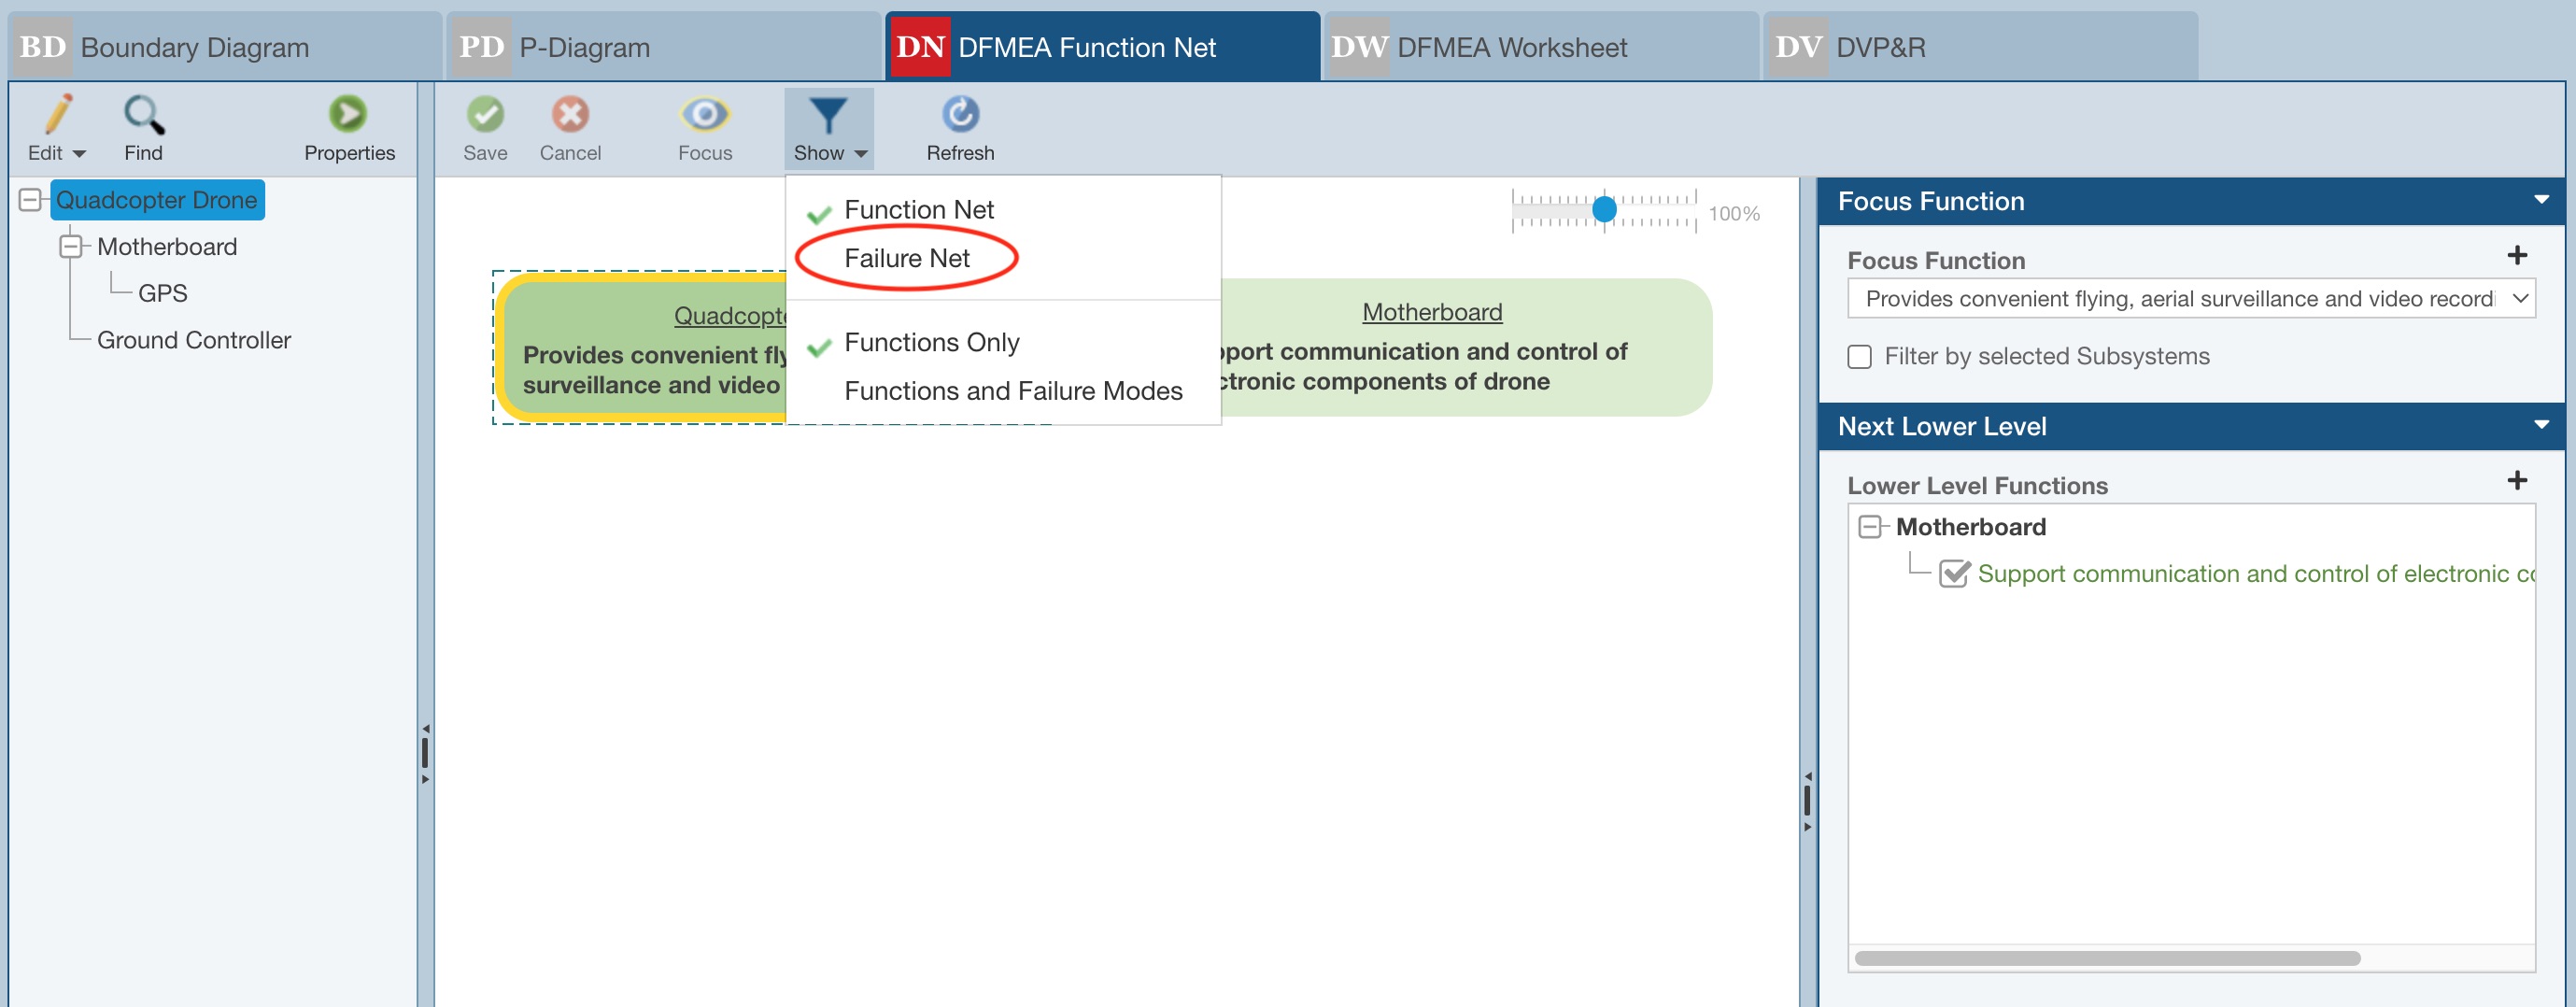
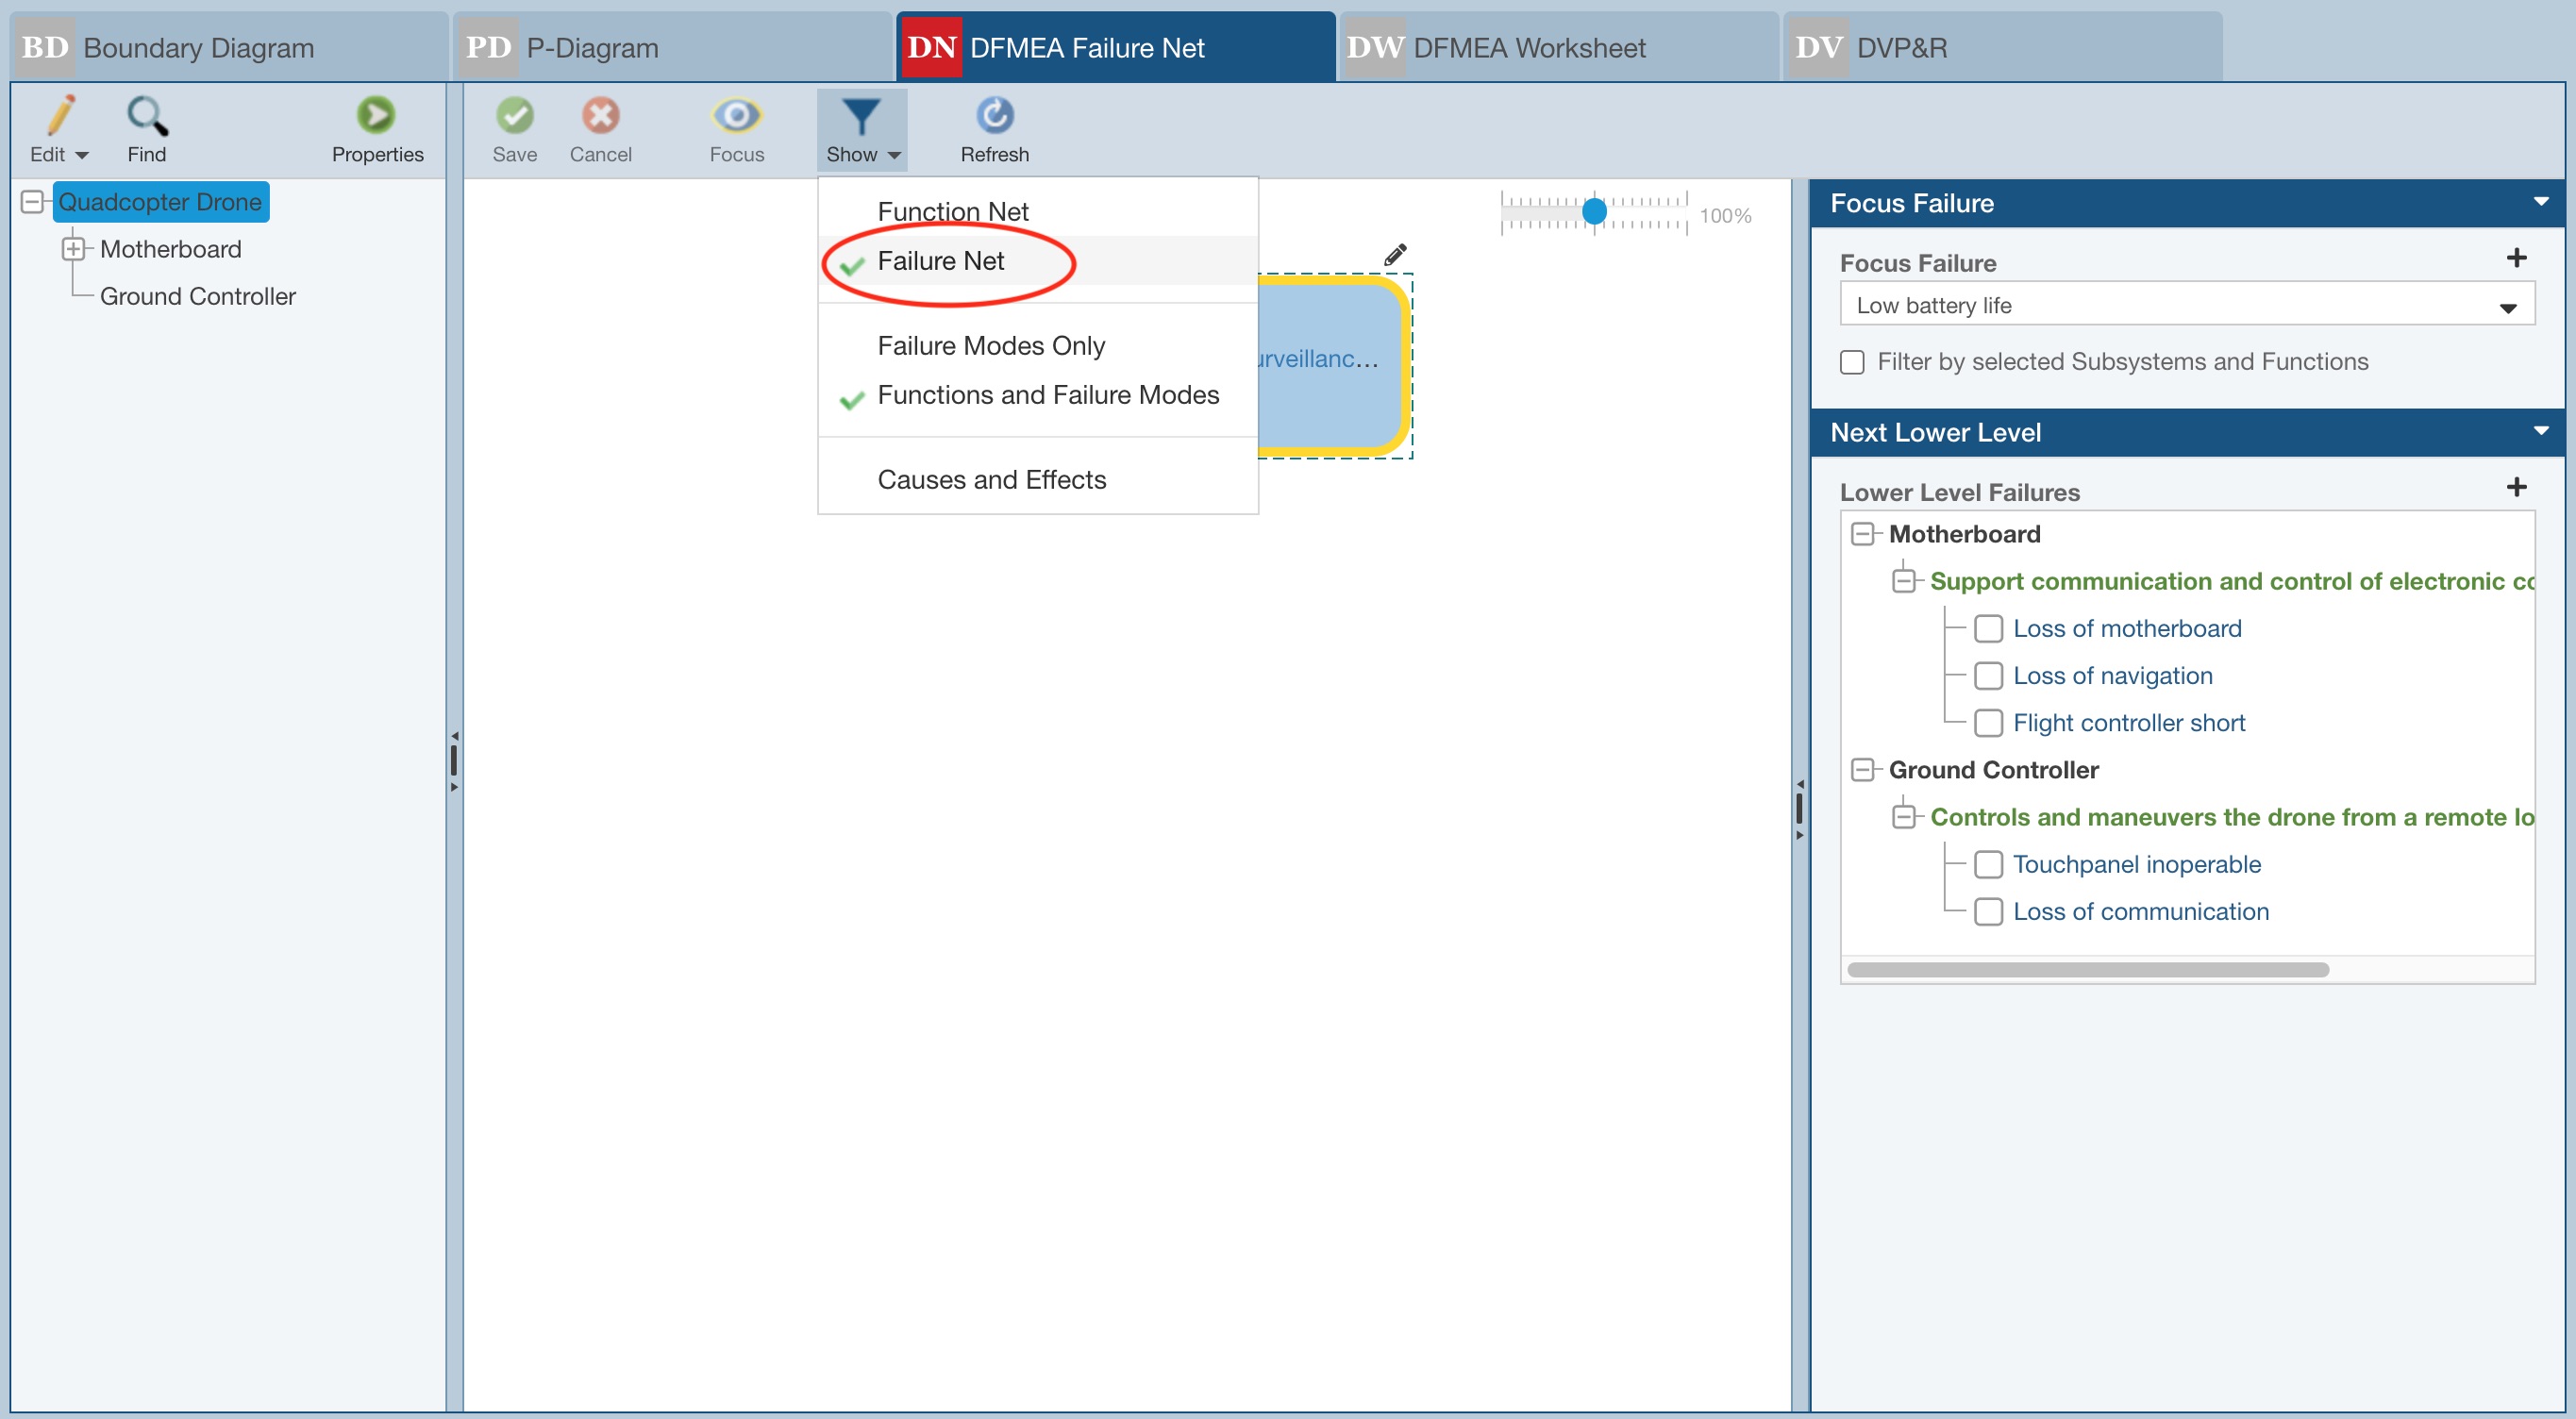
4. To move to the Failure Nets, from the top toolbar, click Show and Failure Net.
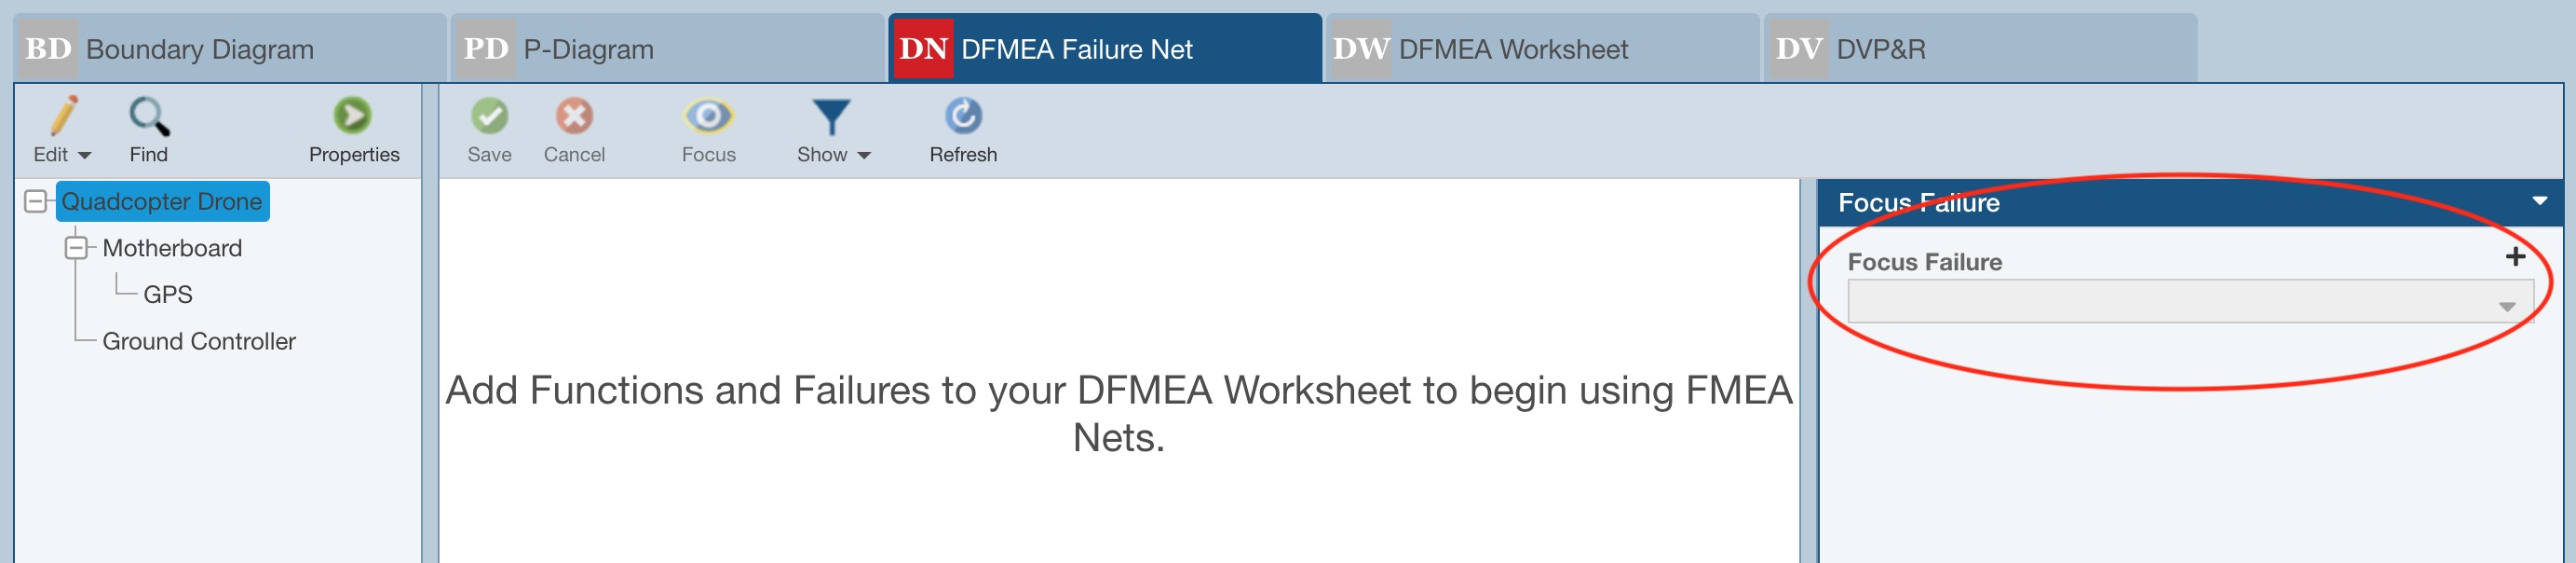
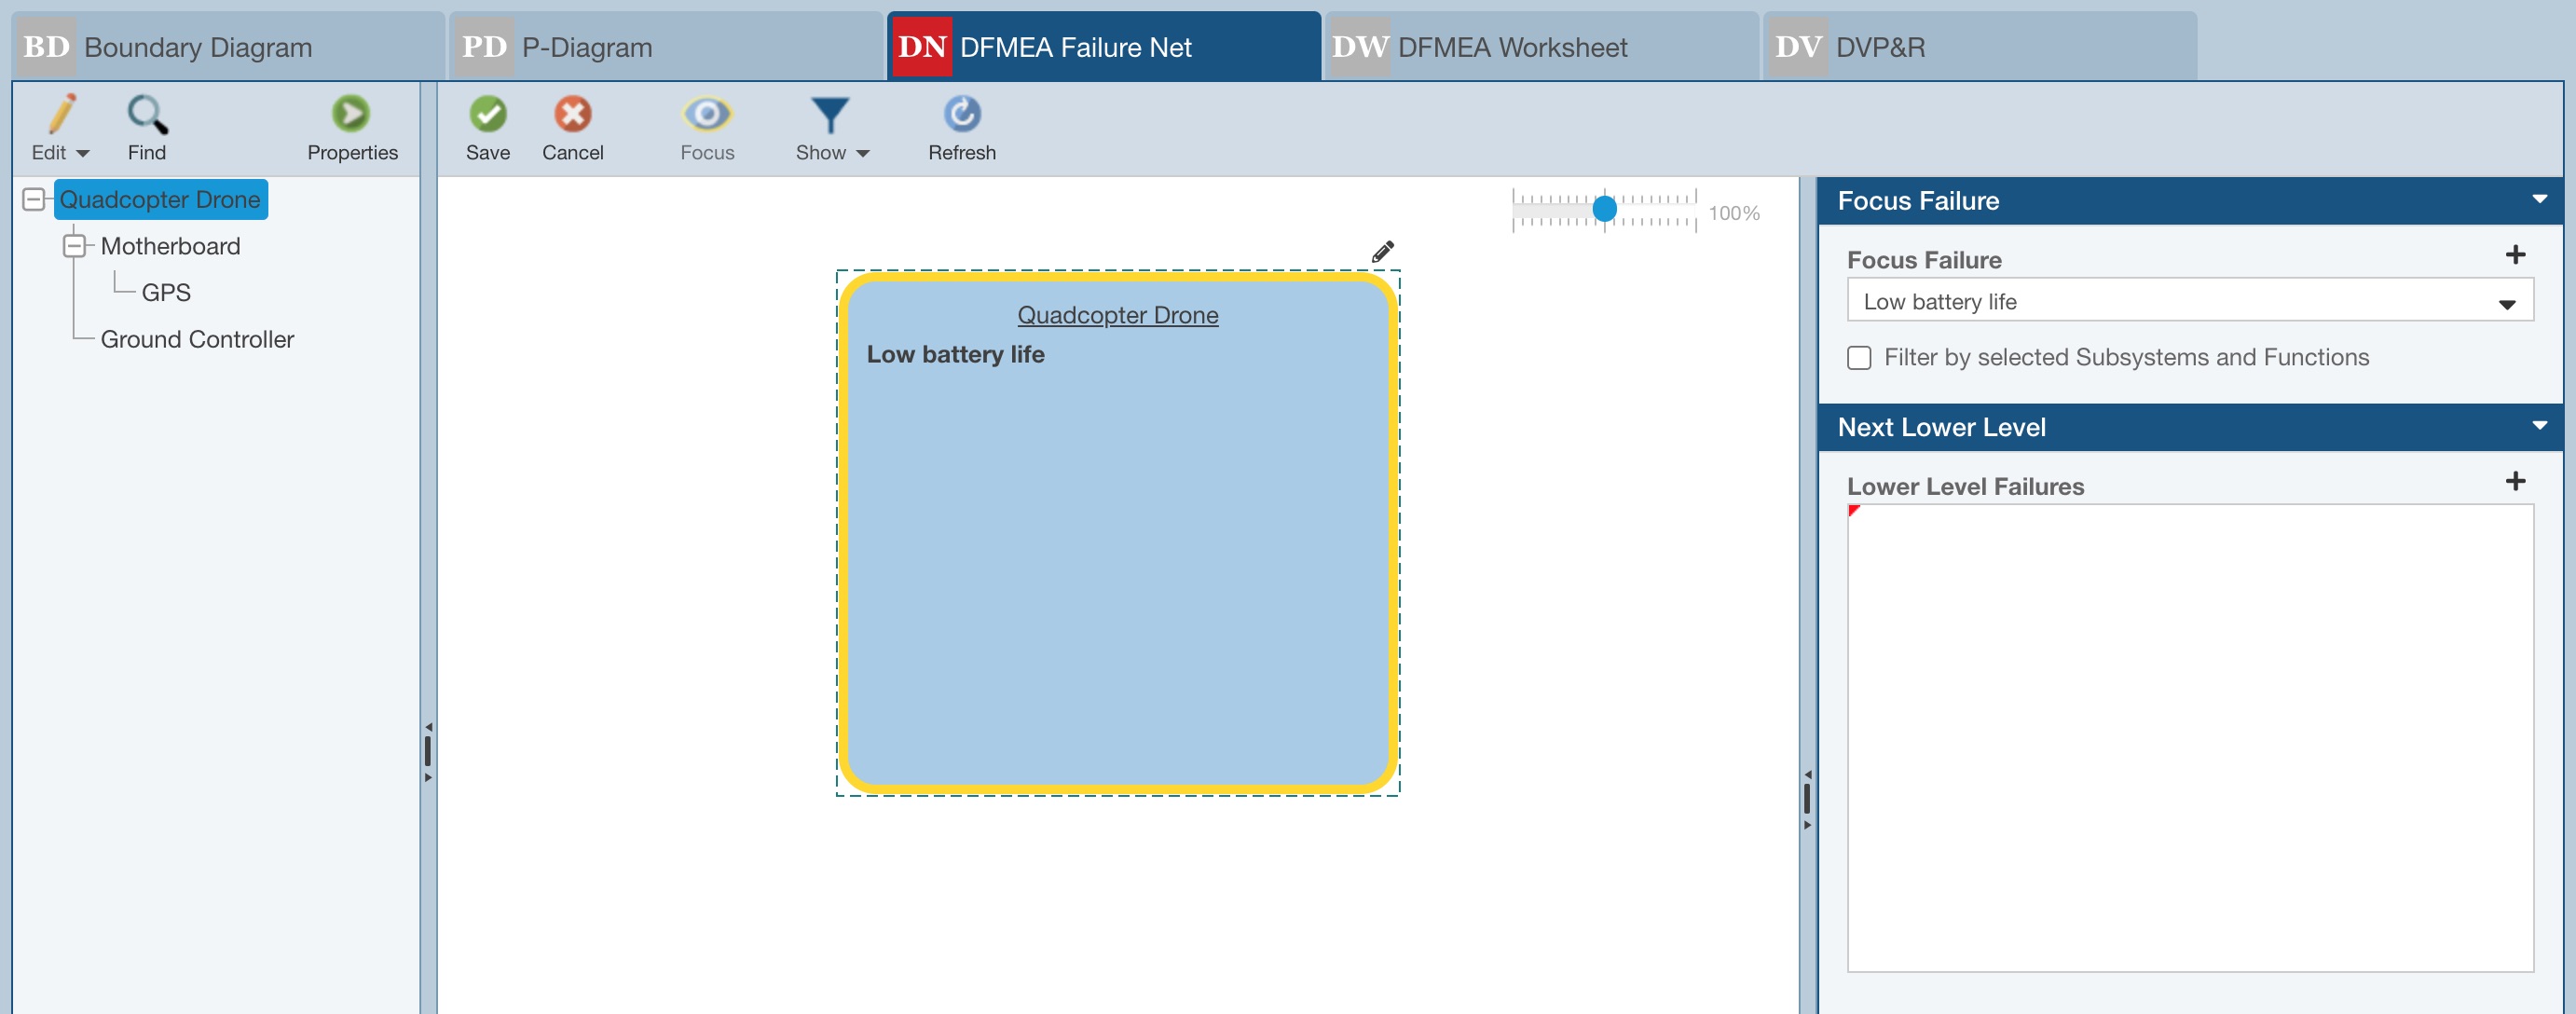
When no Failures (Failure Modes) exist on the DFMEA Worksheet for the selected Analysis Tree item, you'll see the note indicating Add Functions and Failures to your DFMEA Worksheet to begin using FMEA Nets.
Then, use the Add button to add a Focus Failure, or Failure Mode.
On the Add Focus Failure dialog, add the Focus Failure details and click OK.
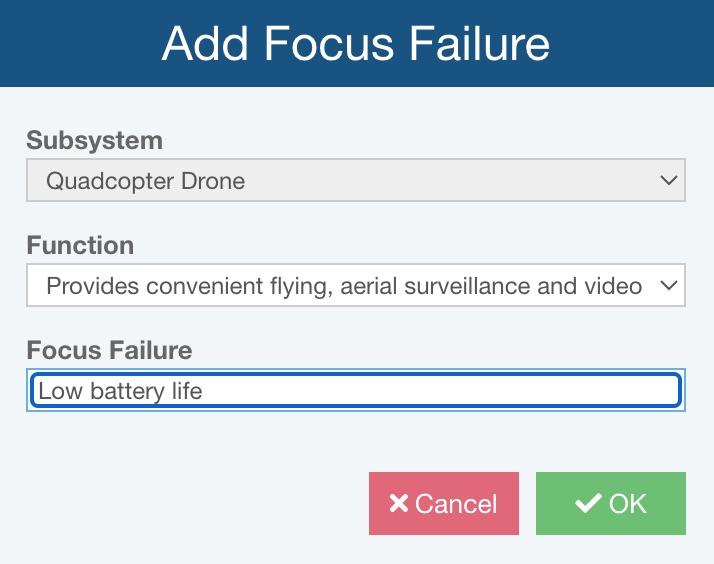
The new Focus Failure is added to the Failure Net.
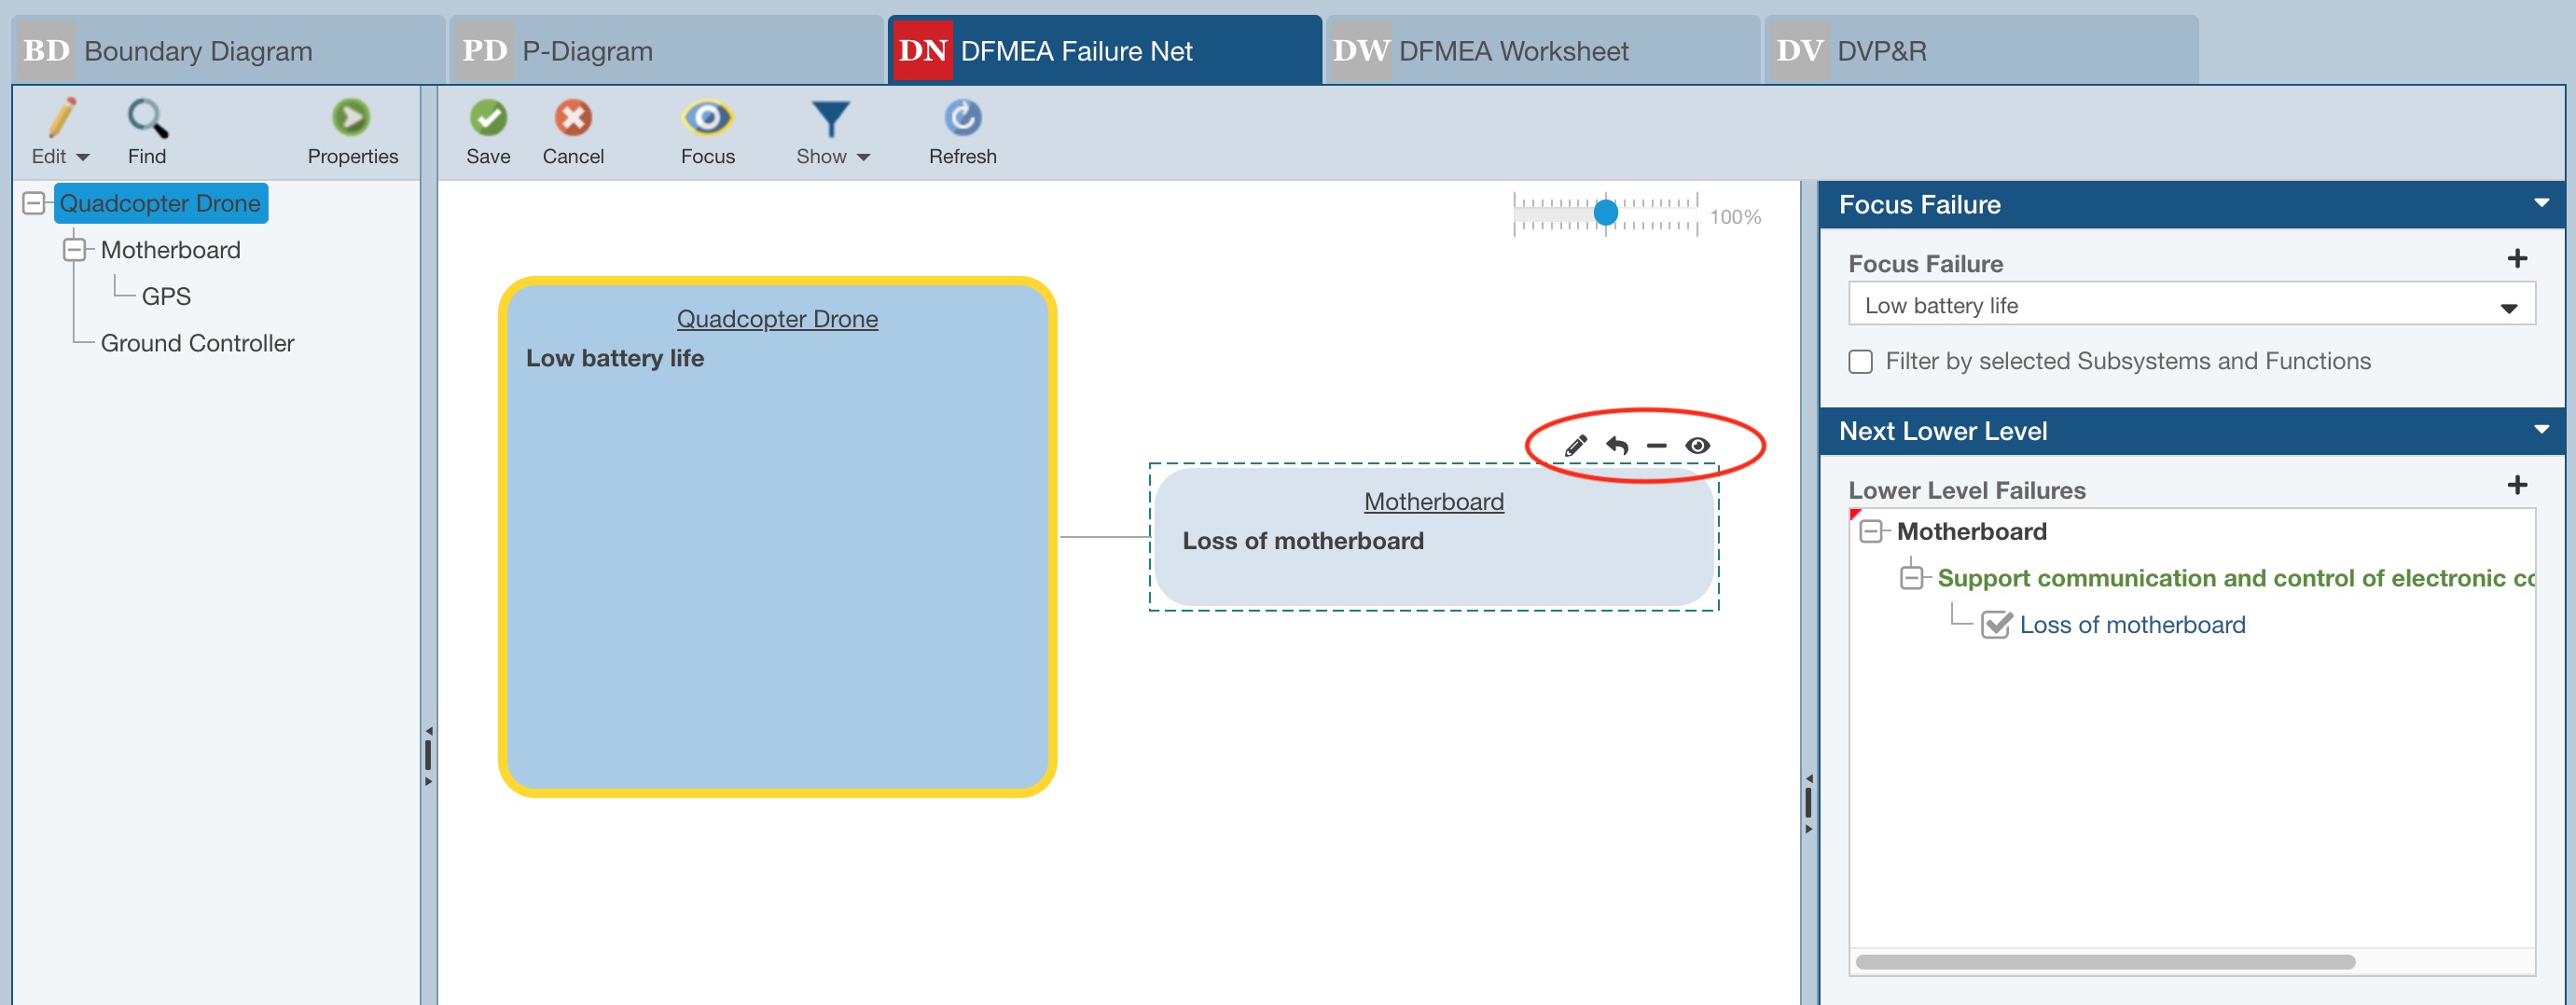
Similar to adding Lower Level Functions or Higher Level Functions, as described above, you can add Lower Level Failures and Higher Level Failures in a similar fashion from the DFMEA Failure Net tab.
Note that you can use the Edit, Add, Remove, and Focus buttons to edit the text for the Focus Failure, add the Failure as a Cause at the next higher level, remove the Failure, or make the selected Failure the Focus Failure on the DFMEA Nets tab.
Repeat any steps as needed to complete your Function Net and/or Failure Net. Note that Functions and Failures (Failure Modes) added in the Function Net and Failure Net are automatically added to the DFMEA Worksheet.
Creating DFMEA Function Nets and Failure Nets After Data is Added to the DFMEA Worksheet
If you're building the Function Nets and Failure Nets after DFMEA Worksheet data has been added, use these steps. Or use the previously highlighted steps if you're starting with the Function Nets and Failure Nets with a blank DFMEA Worksheet.
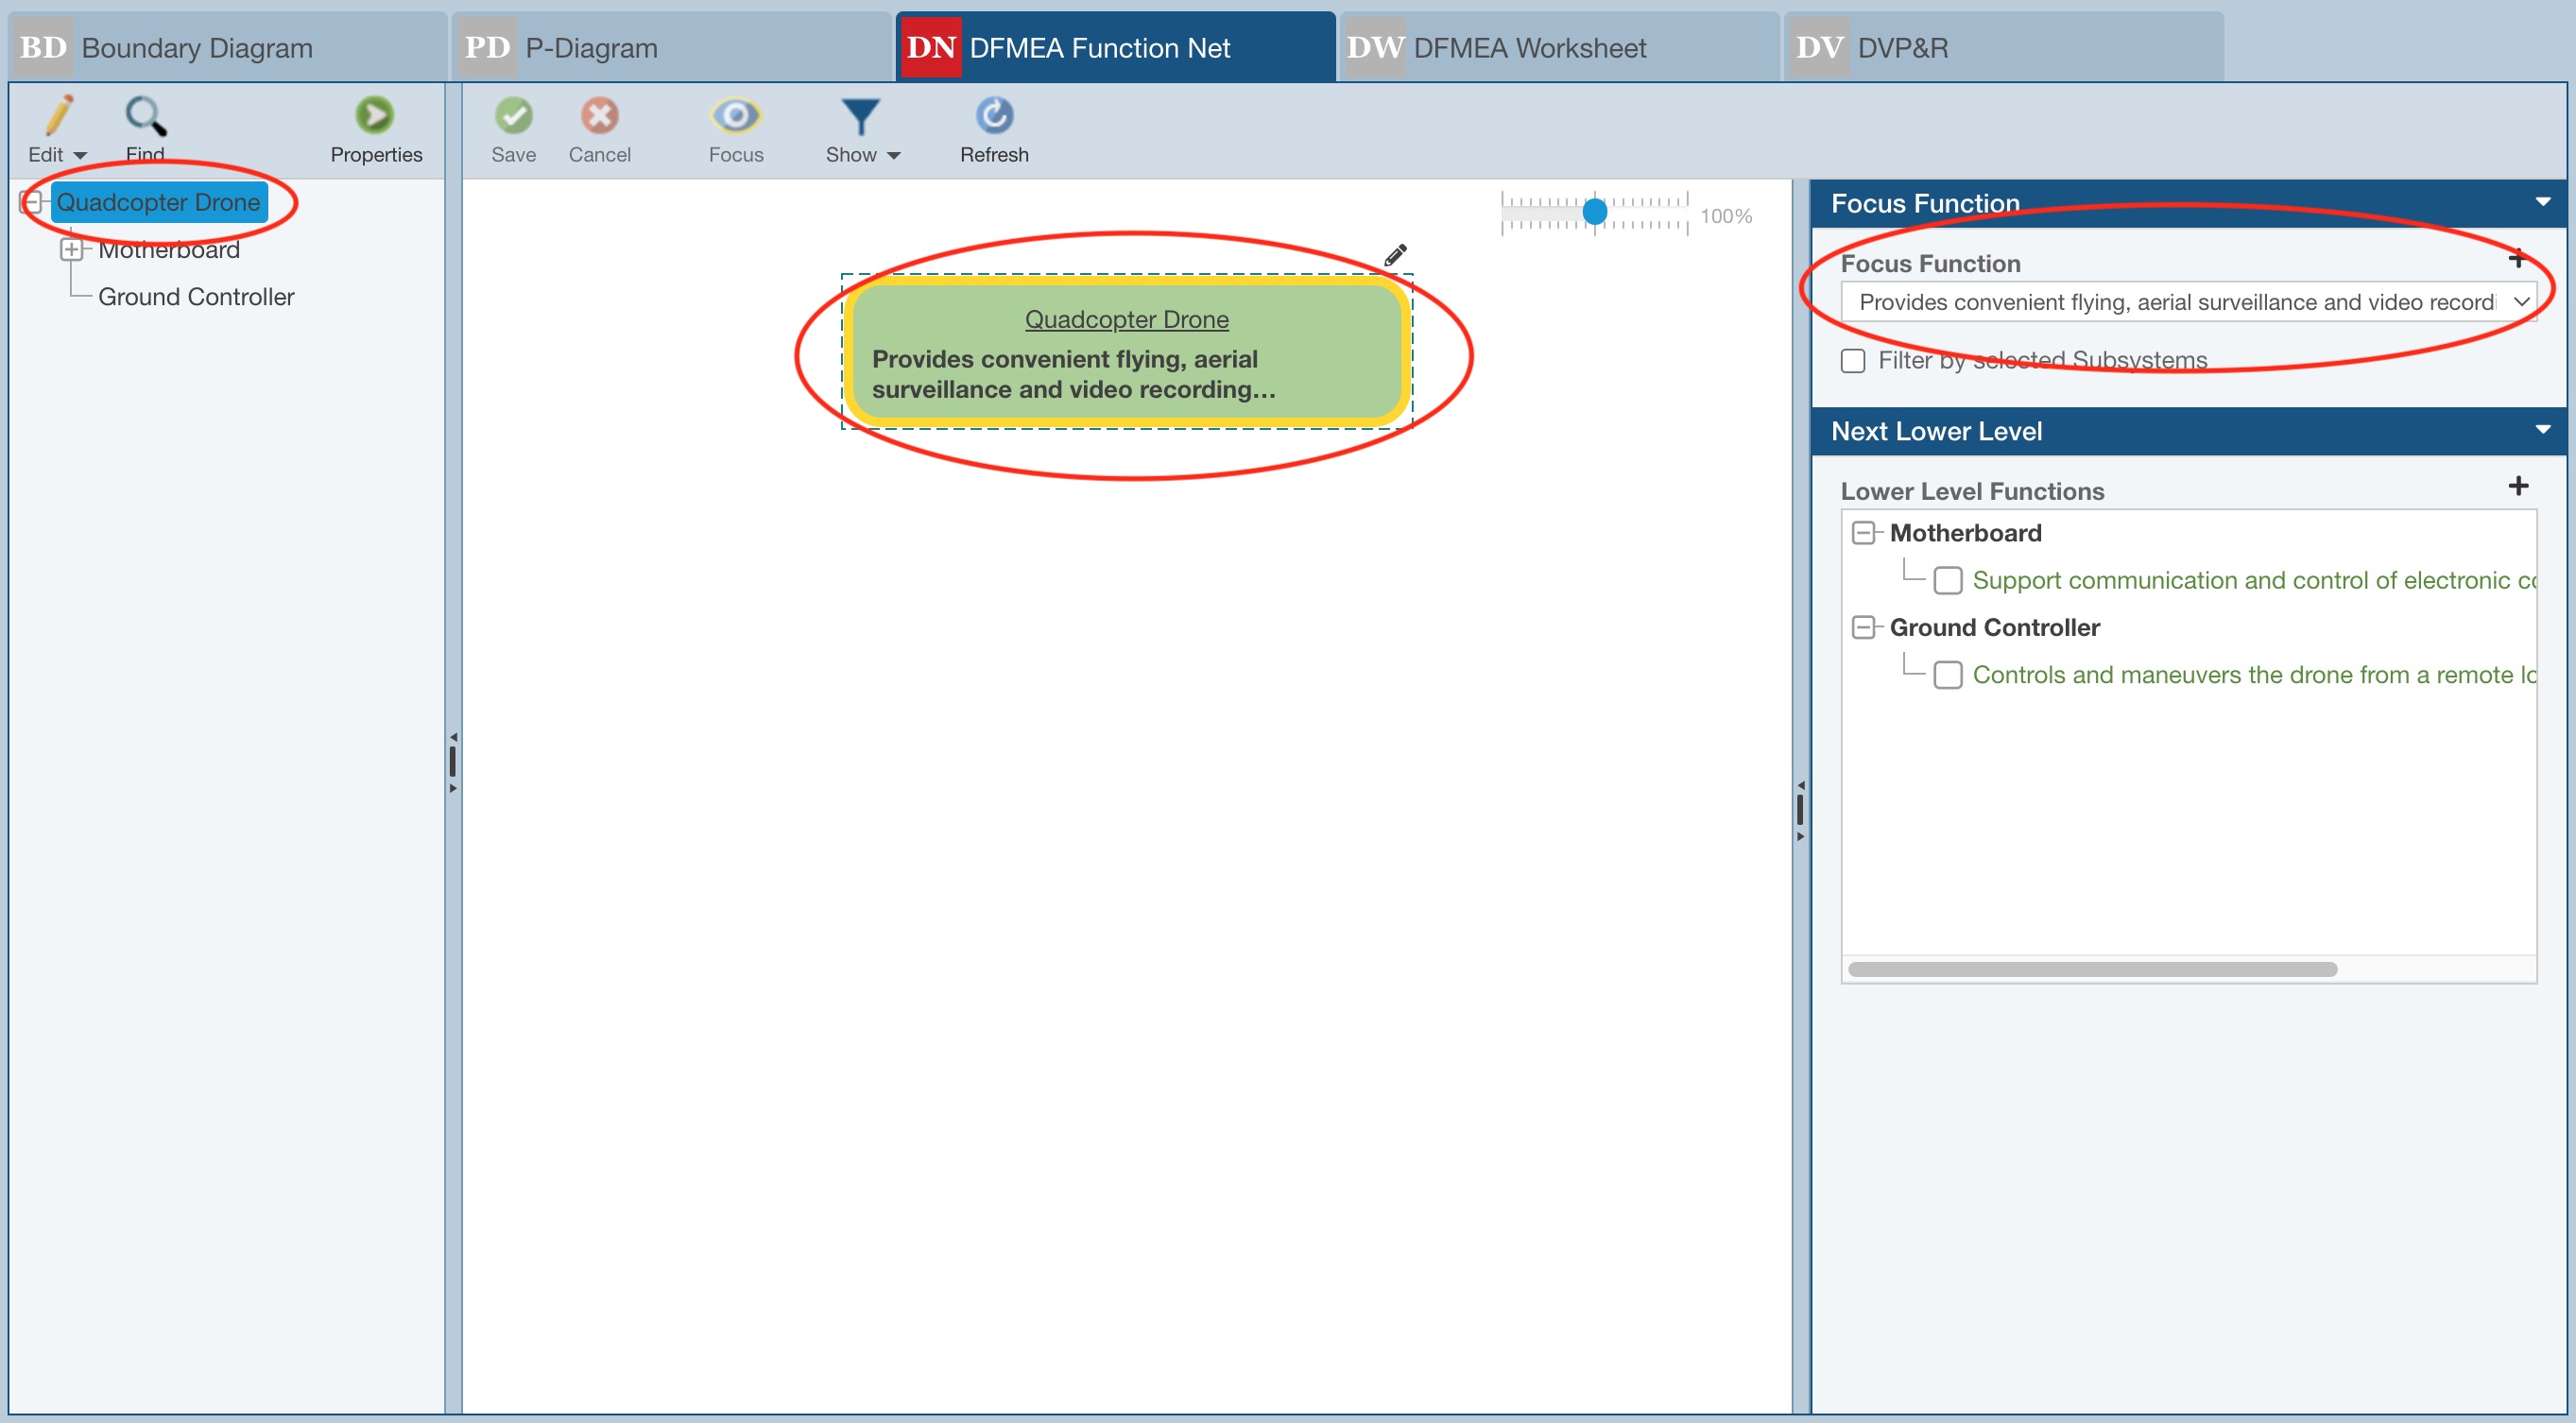
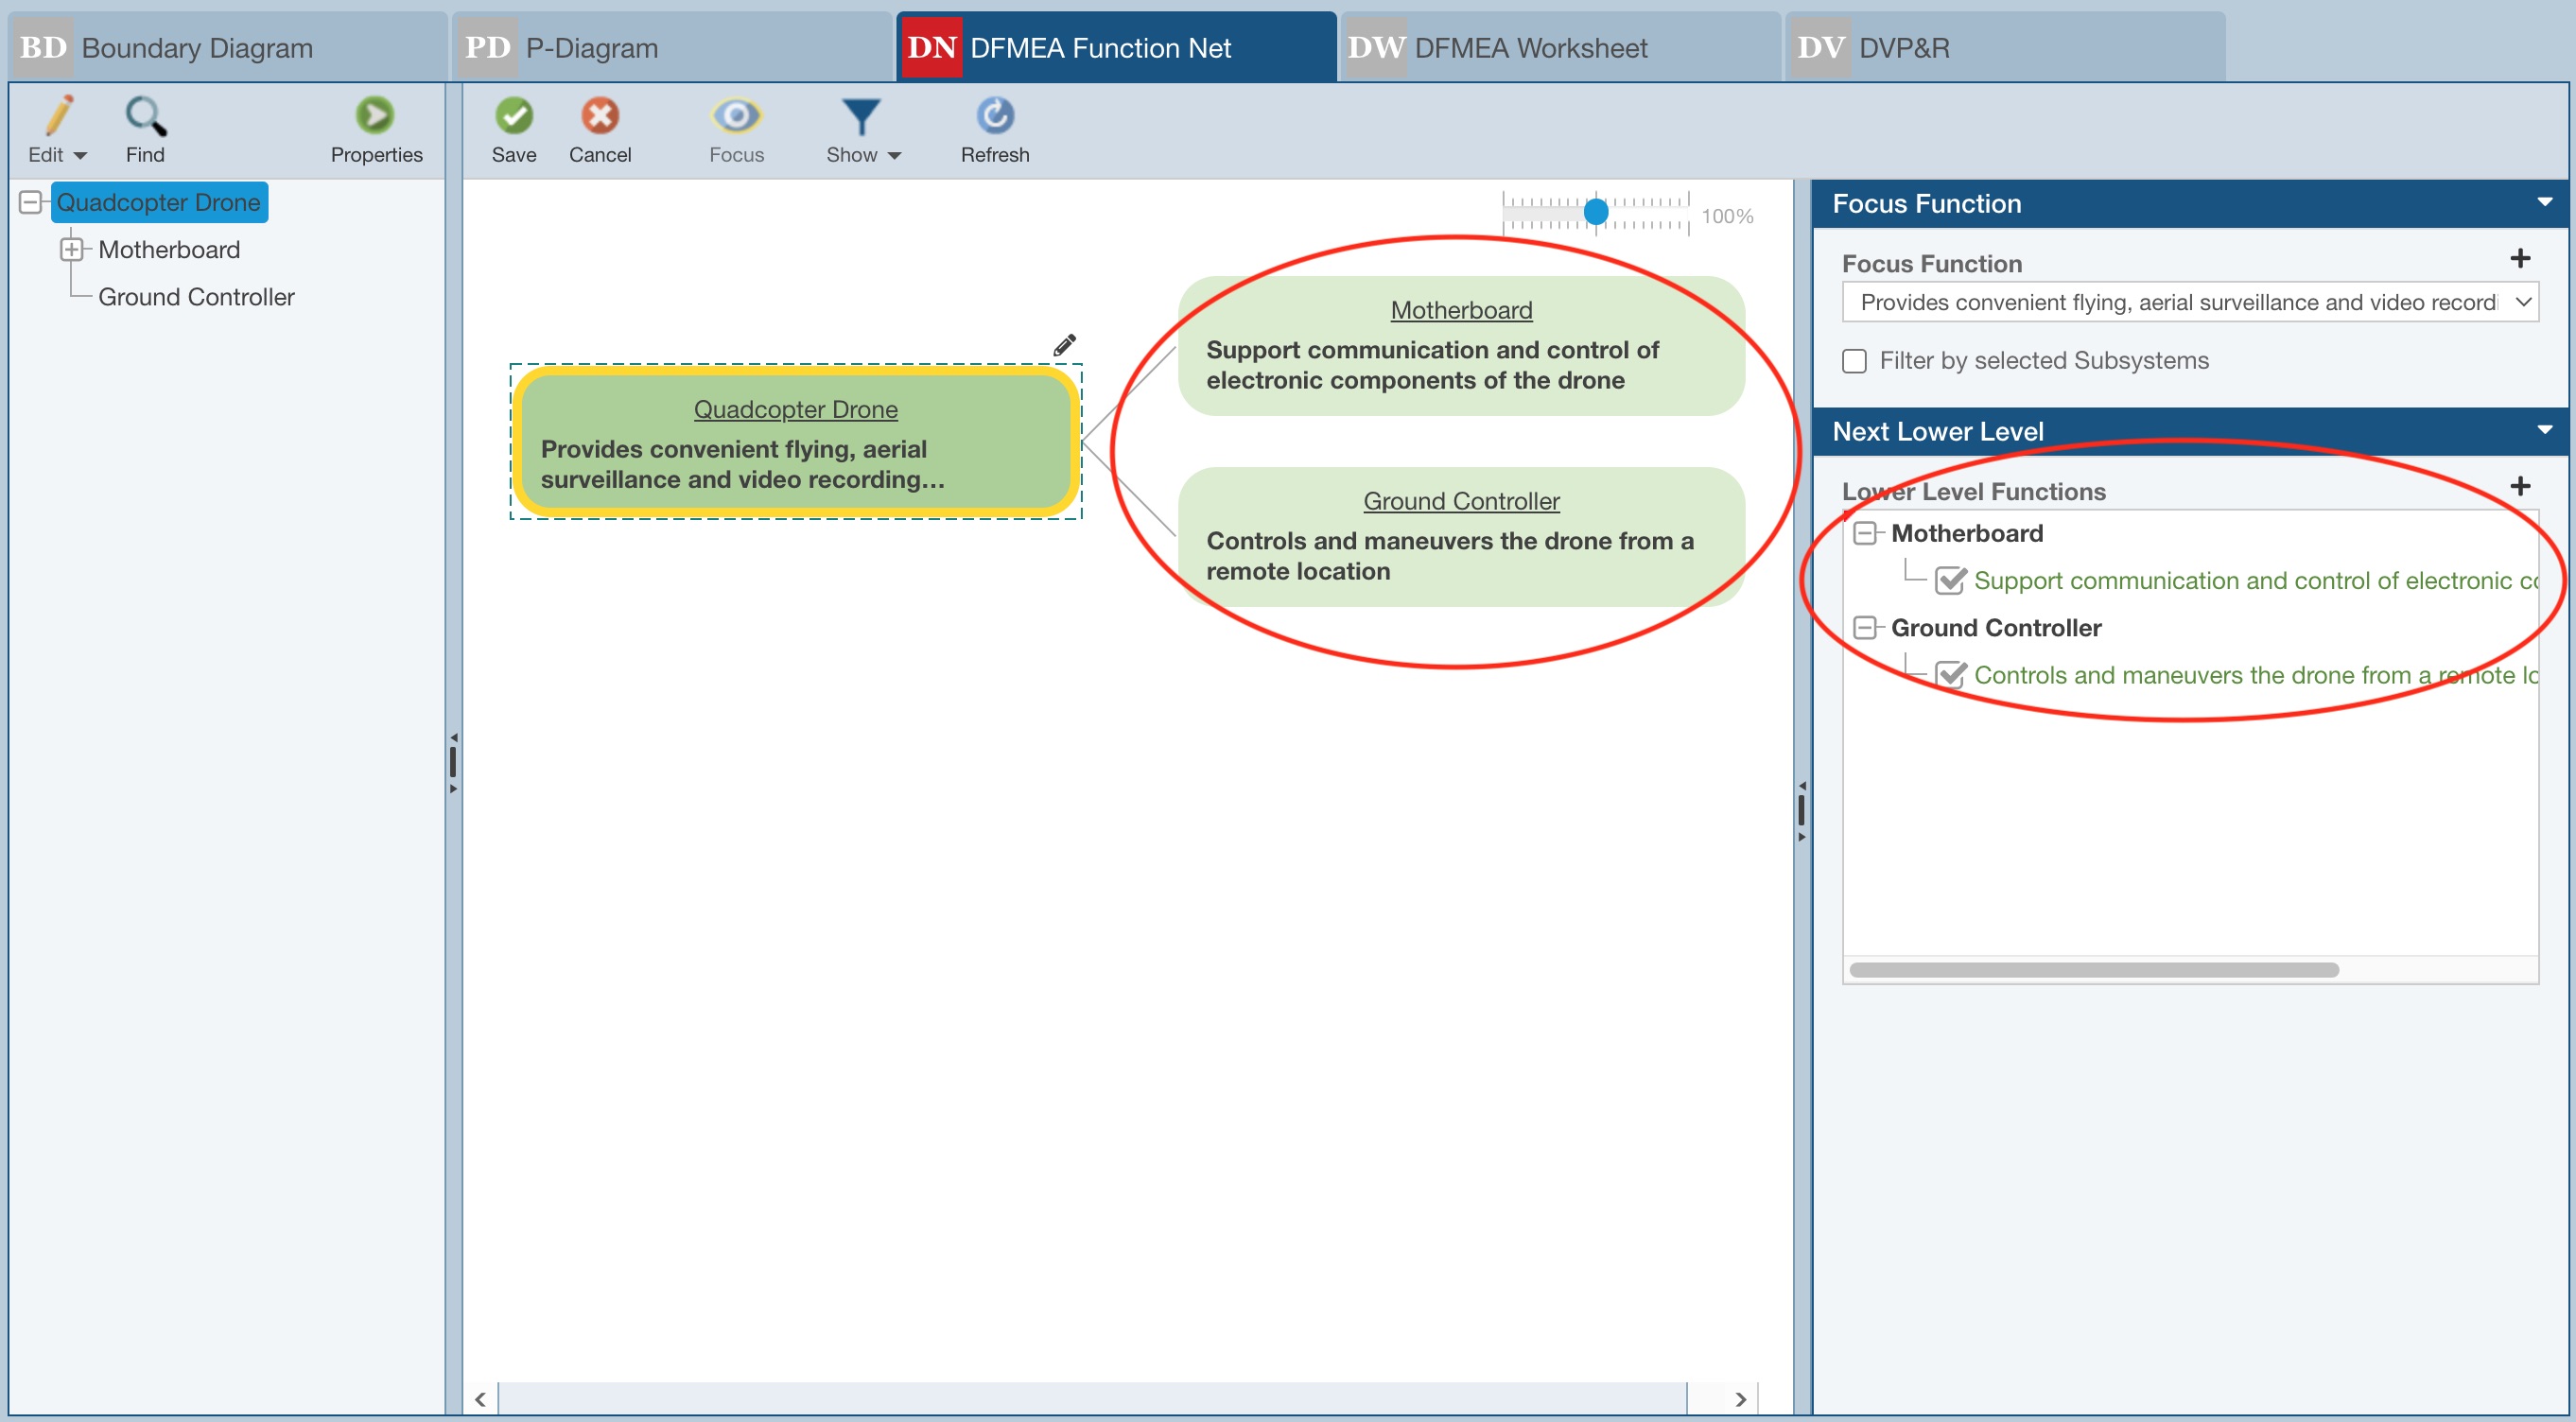
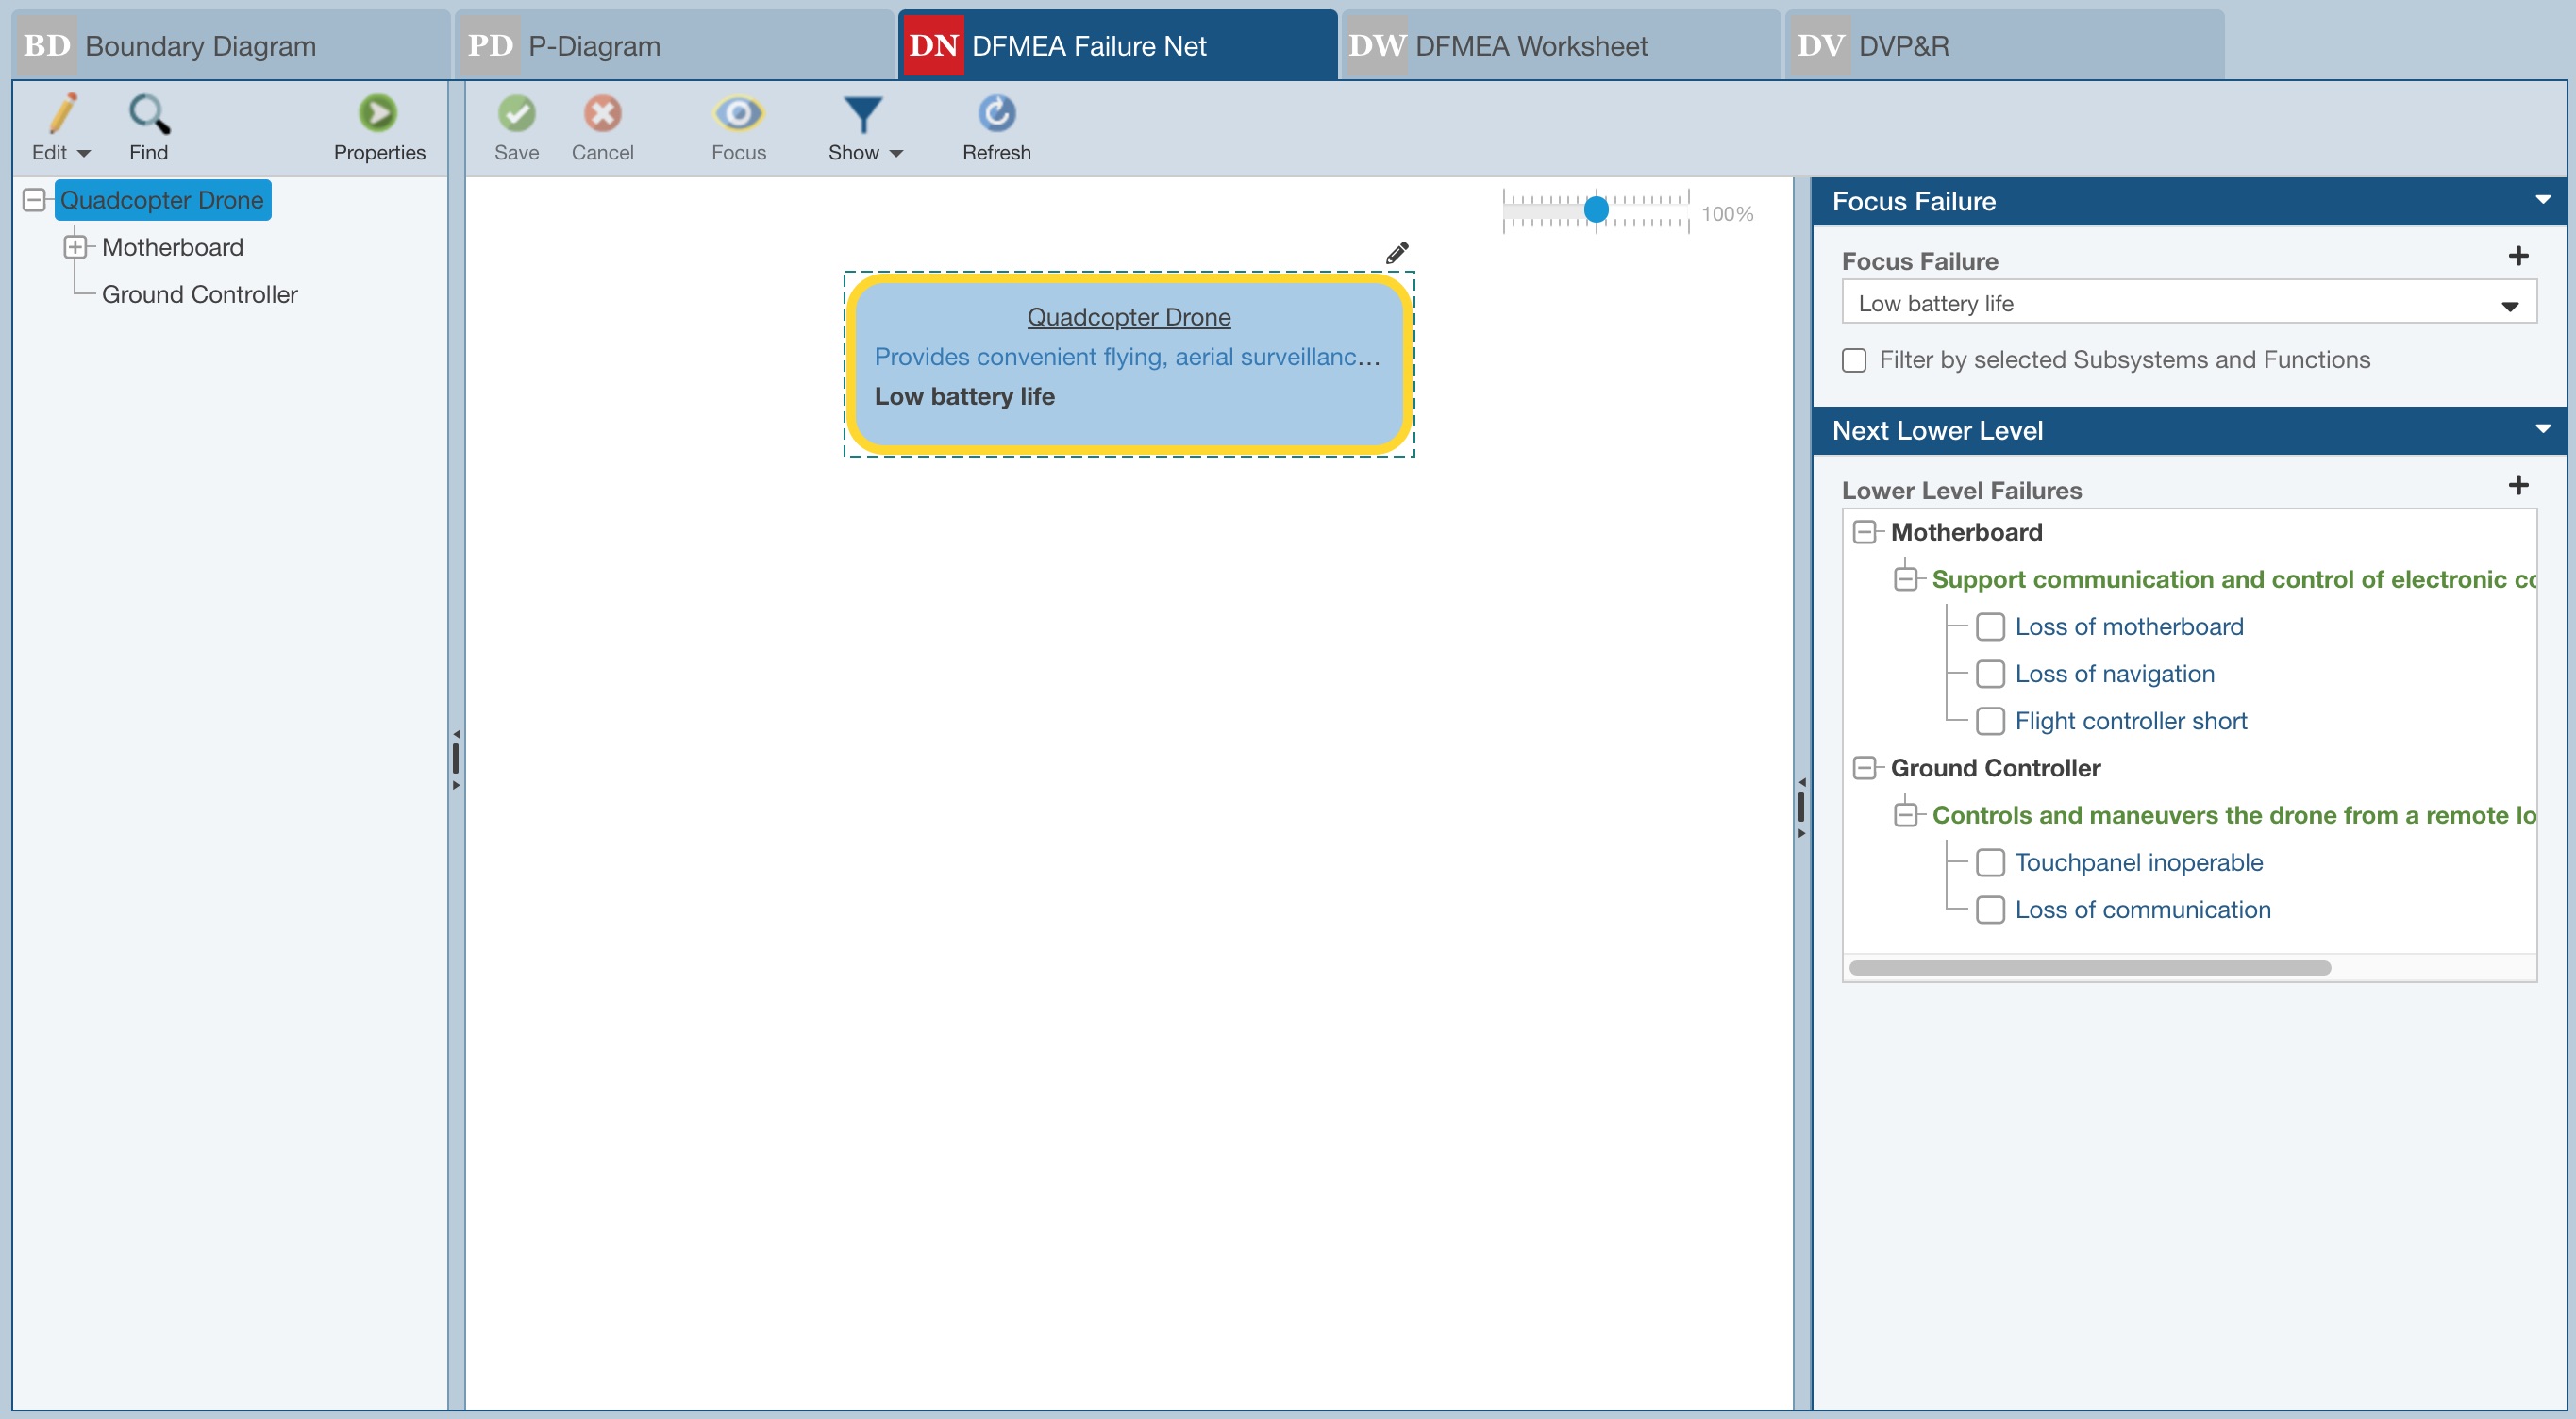
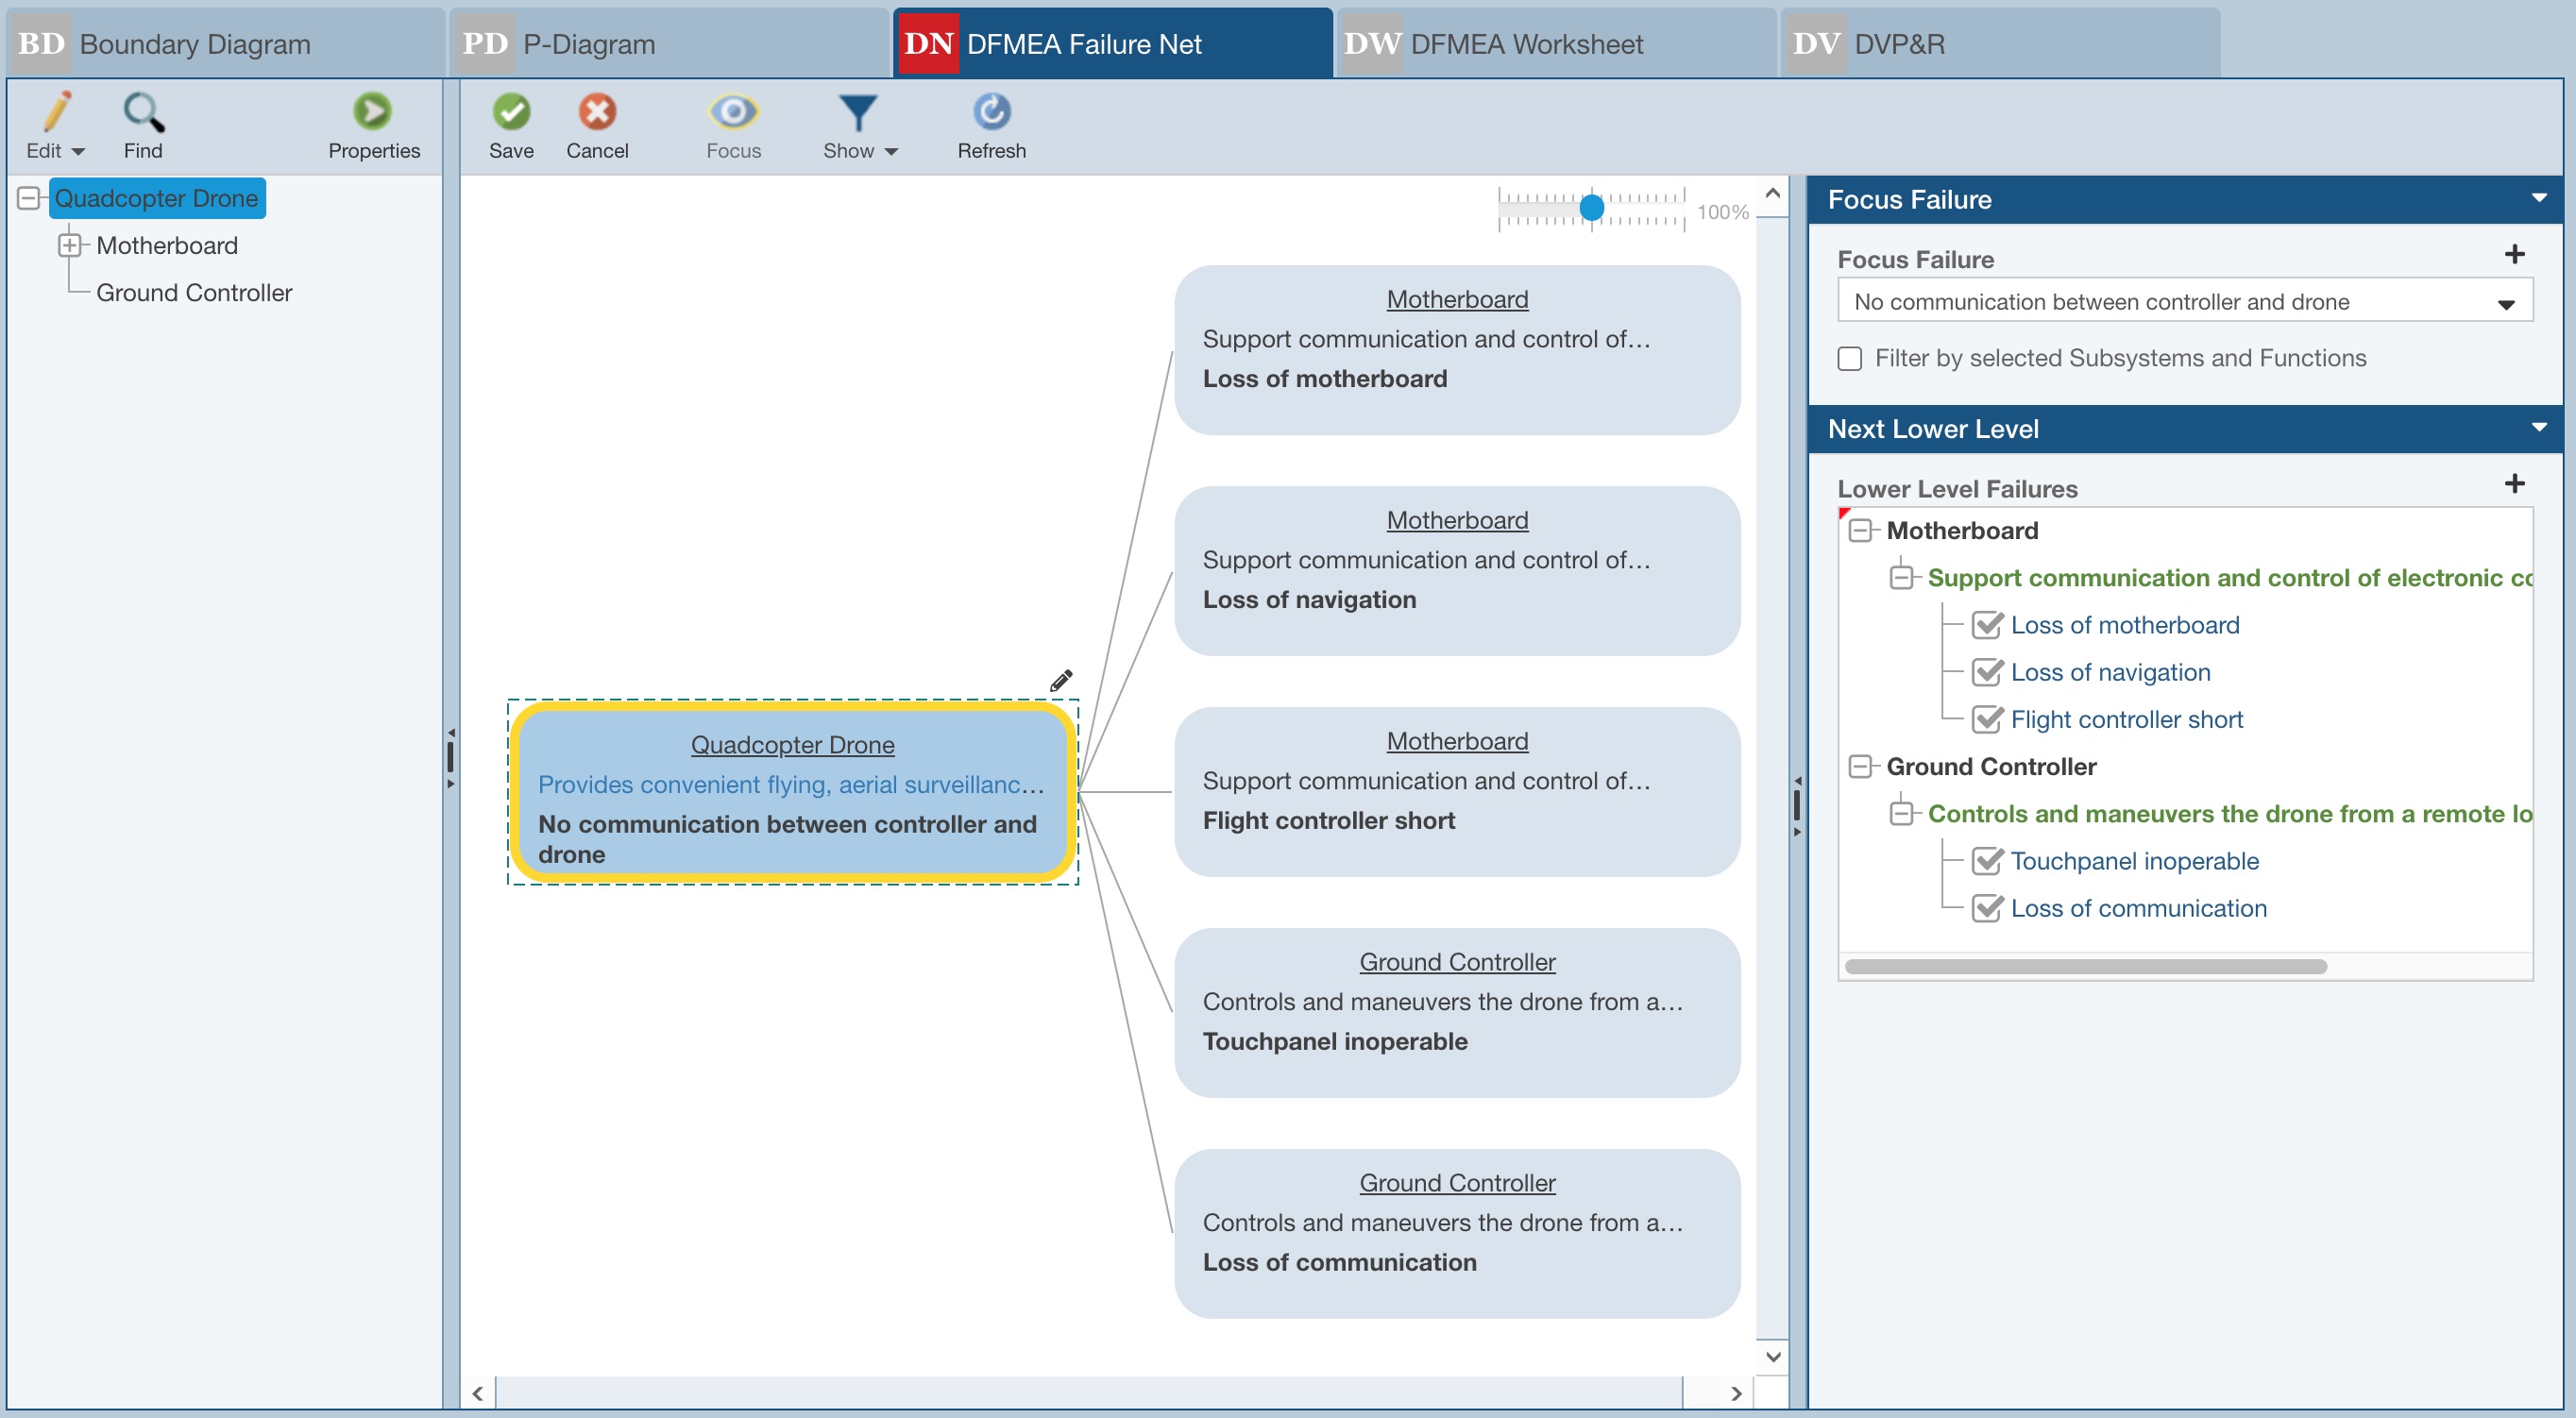
When DFMEA details have been entered on the DFMEA Worksheet, including Functions and Failure Modes (Focus Failures within DFMEA Nets), you'll see the Focus Function and related data for the item selected in the Analysis Tree.
1. For each Analysis Tree and Focus Function, identify and associate the appropriate Higher Level and/or Lower Level Functions by selecting them.
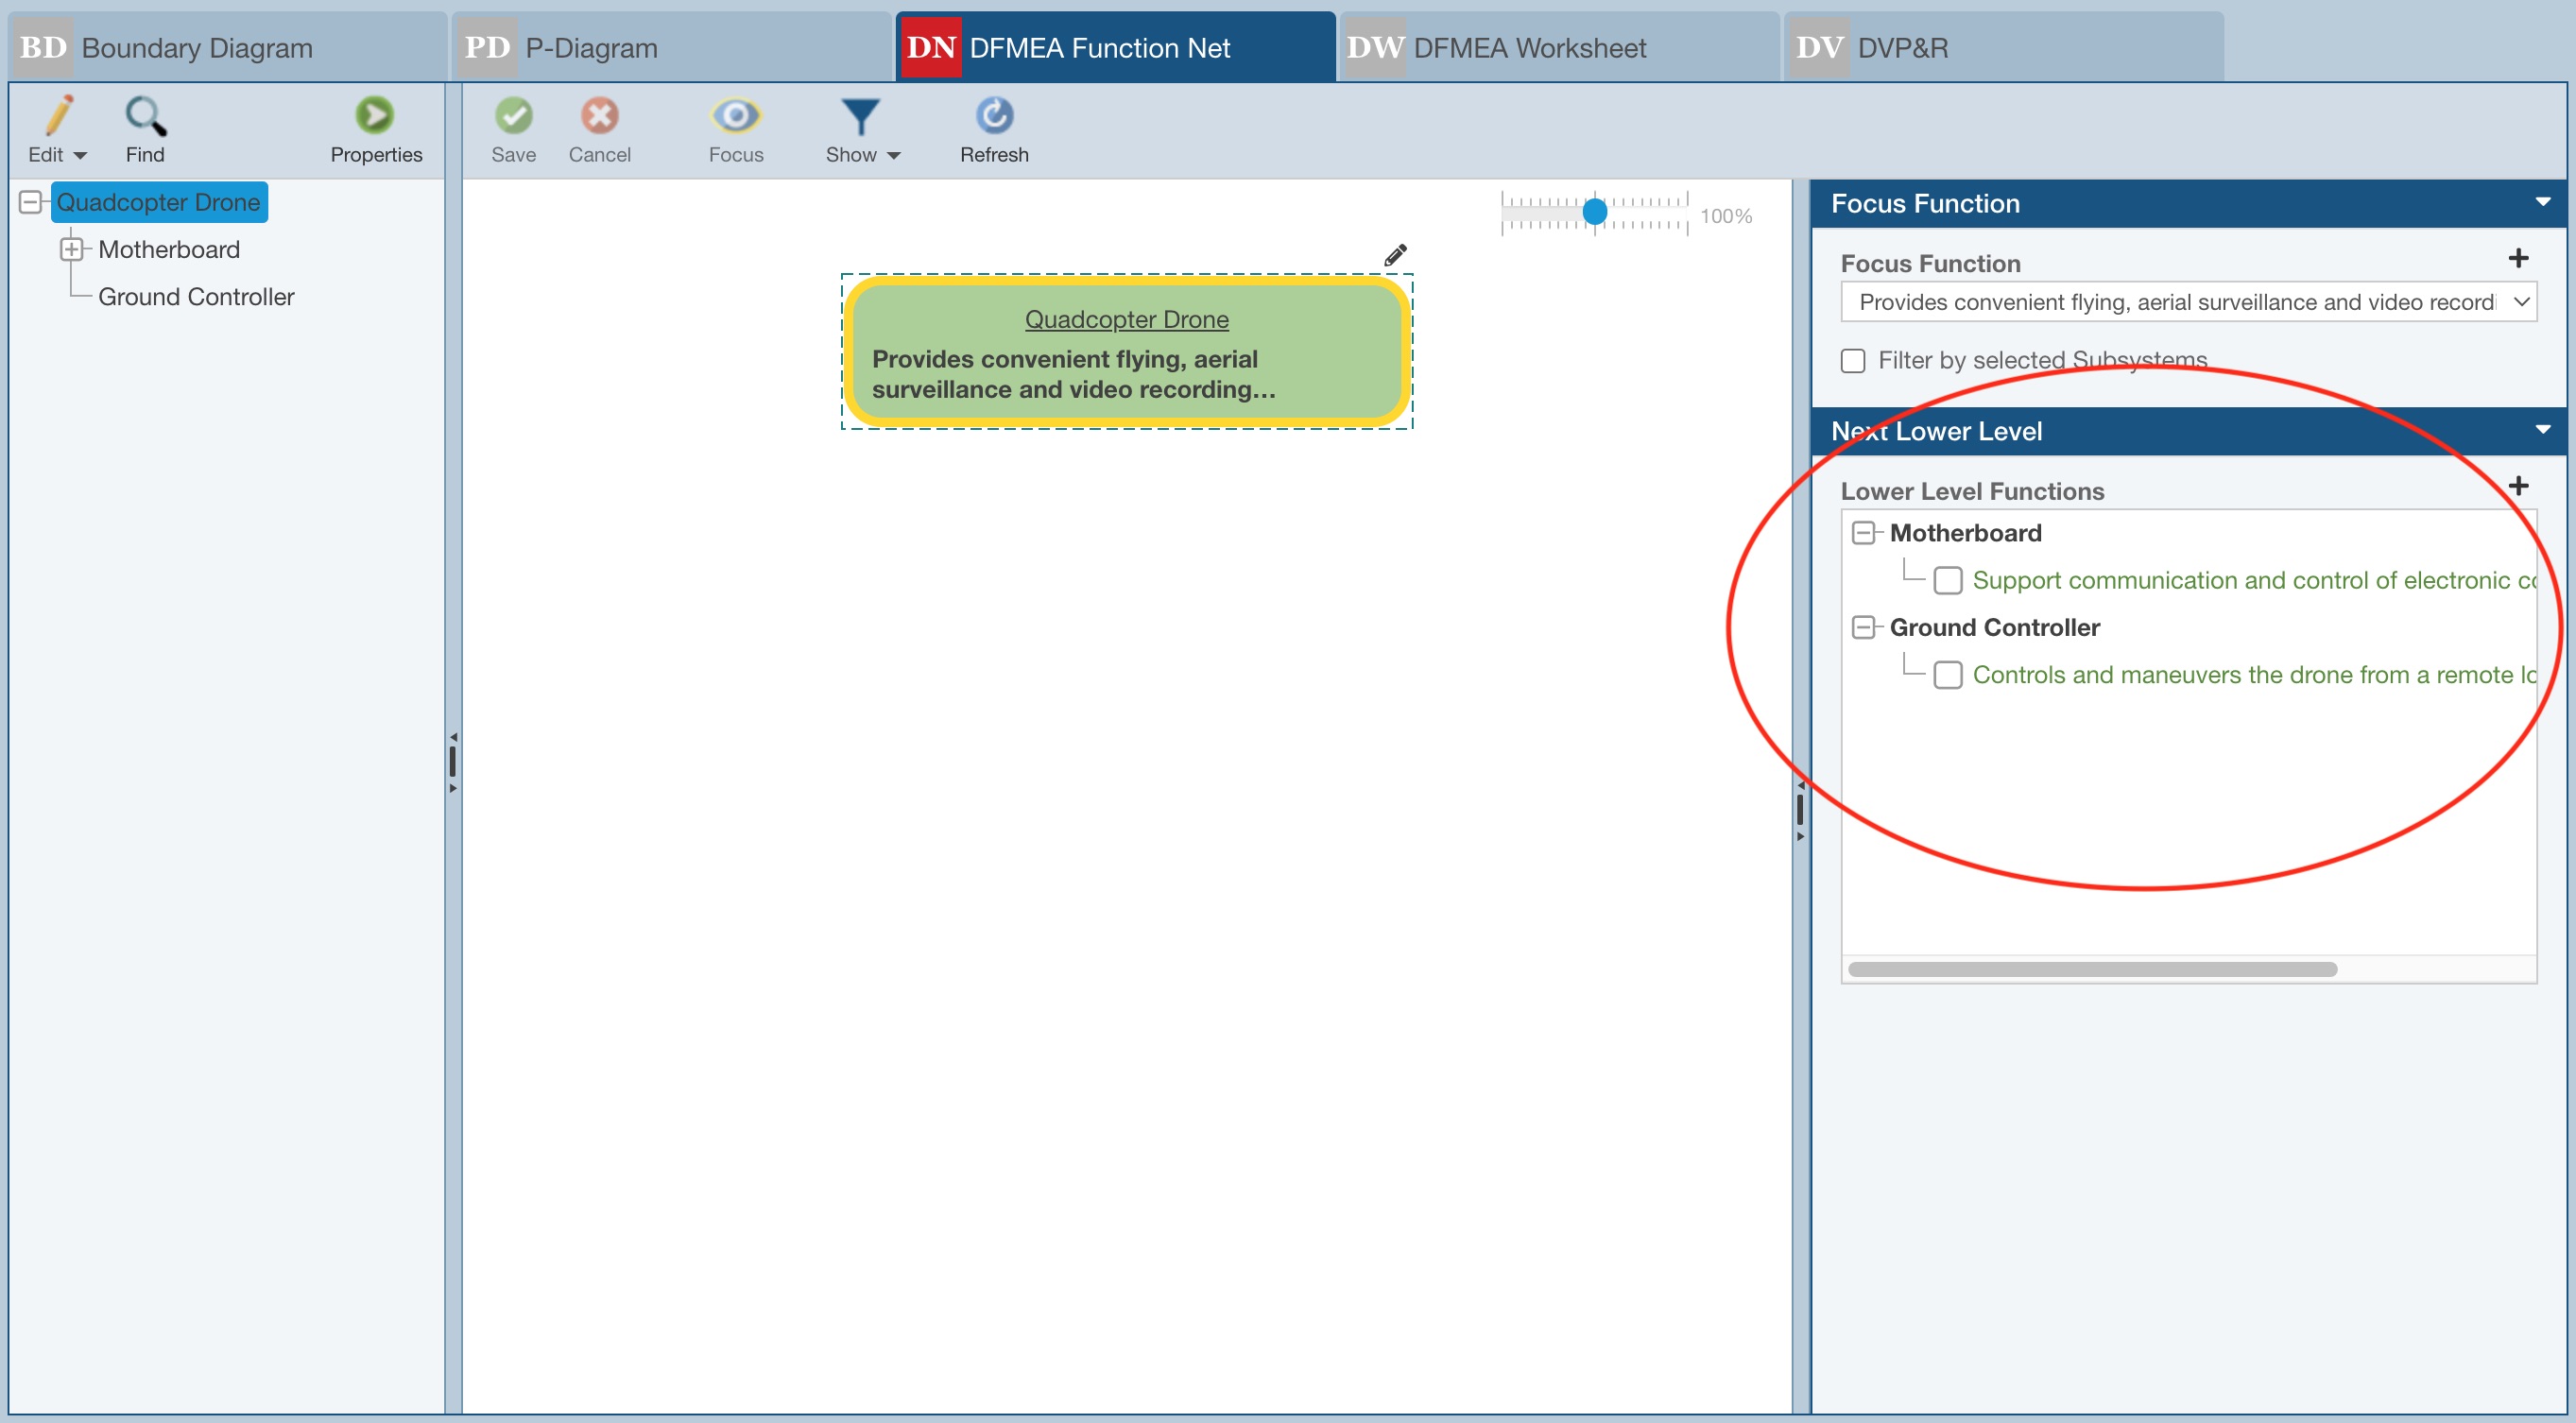
Once selected, they are shown in the Function Net.
2. Repeat for each Analysis Tree item and all applicable Focus Functions. To select an Analysis Tree item, click the Subsystem in the Analysis Tree pane. To choose a different Focus Function, select it from the list.
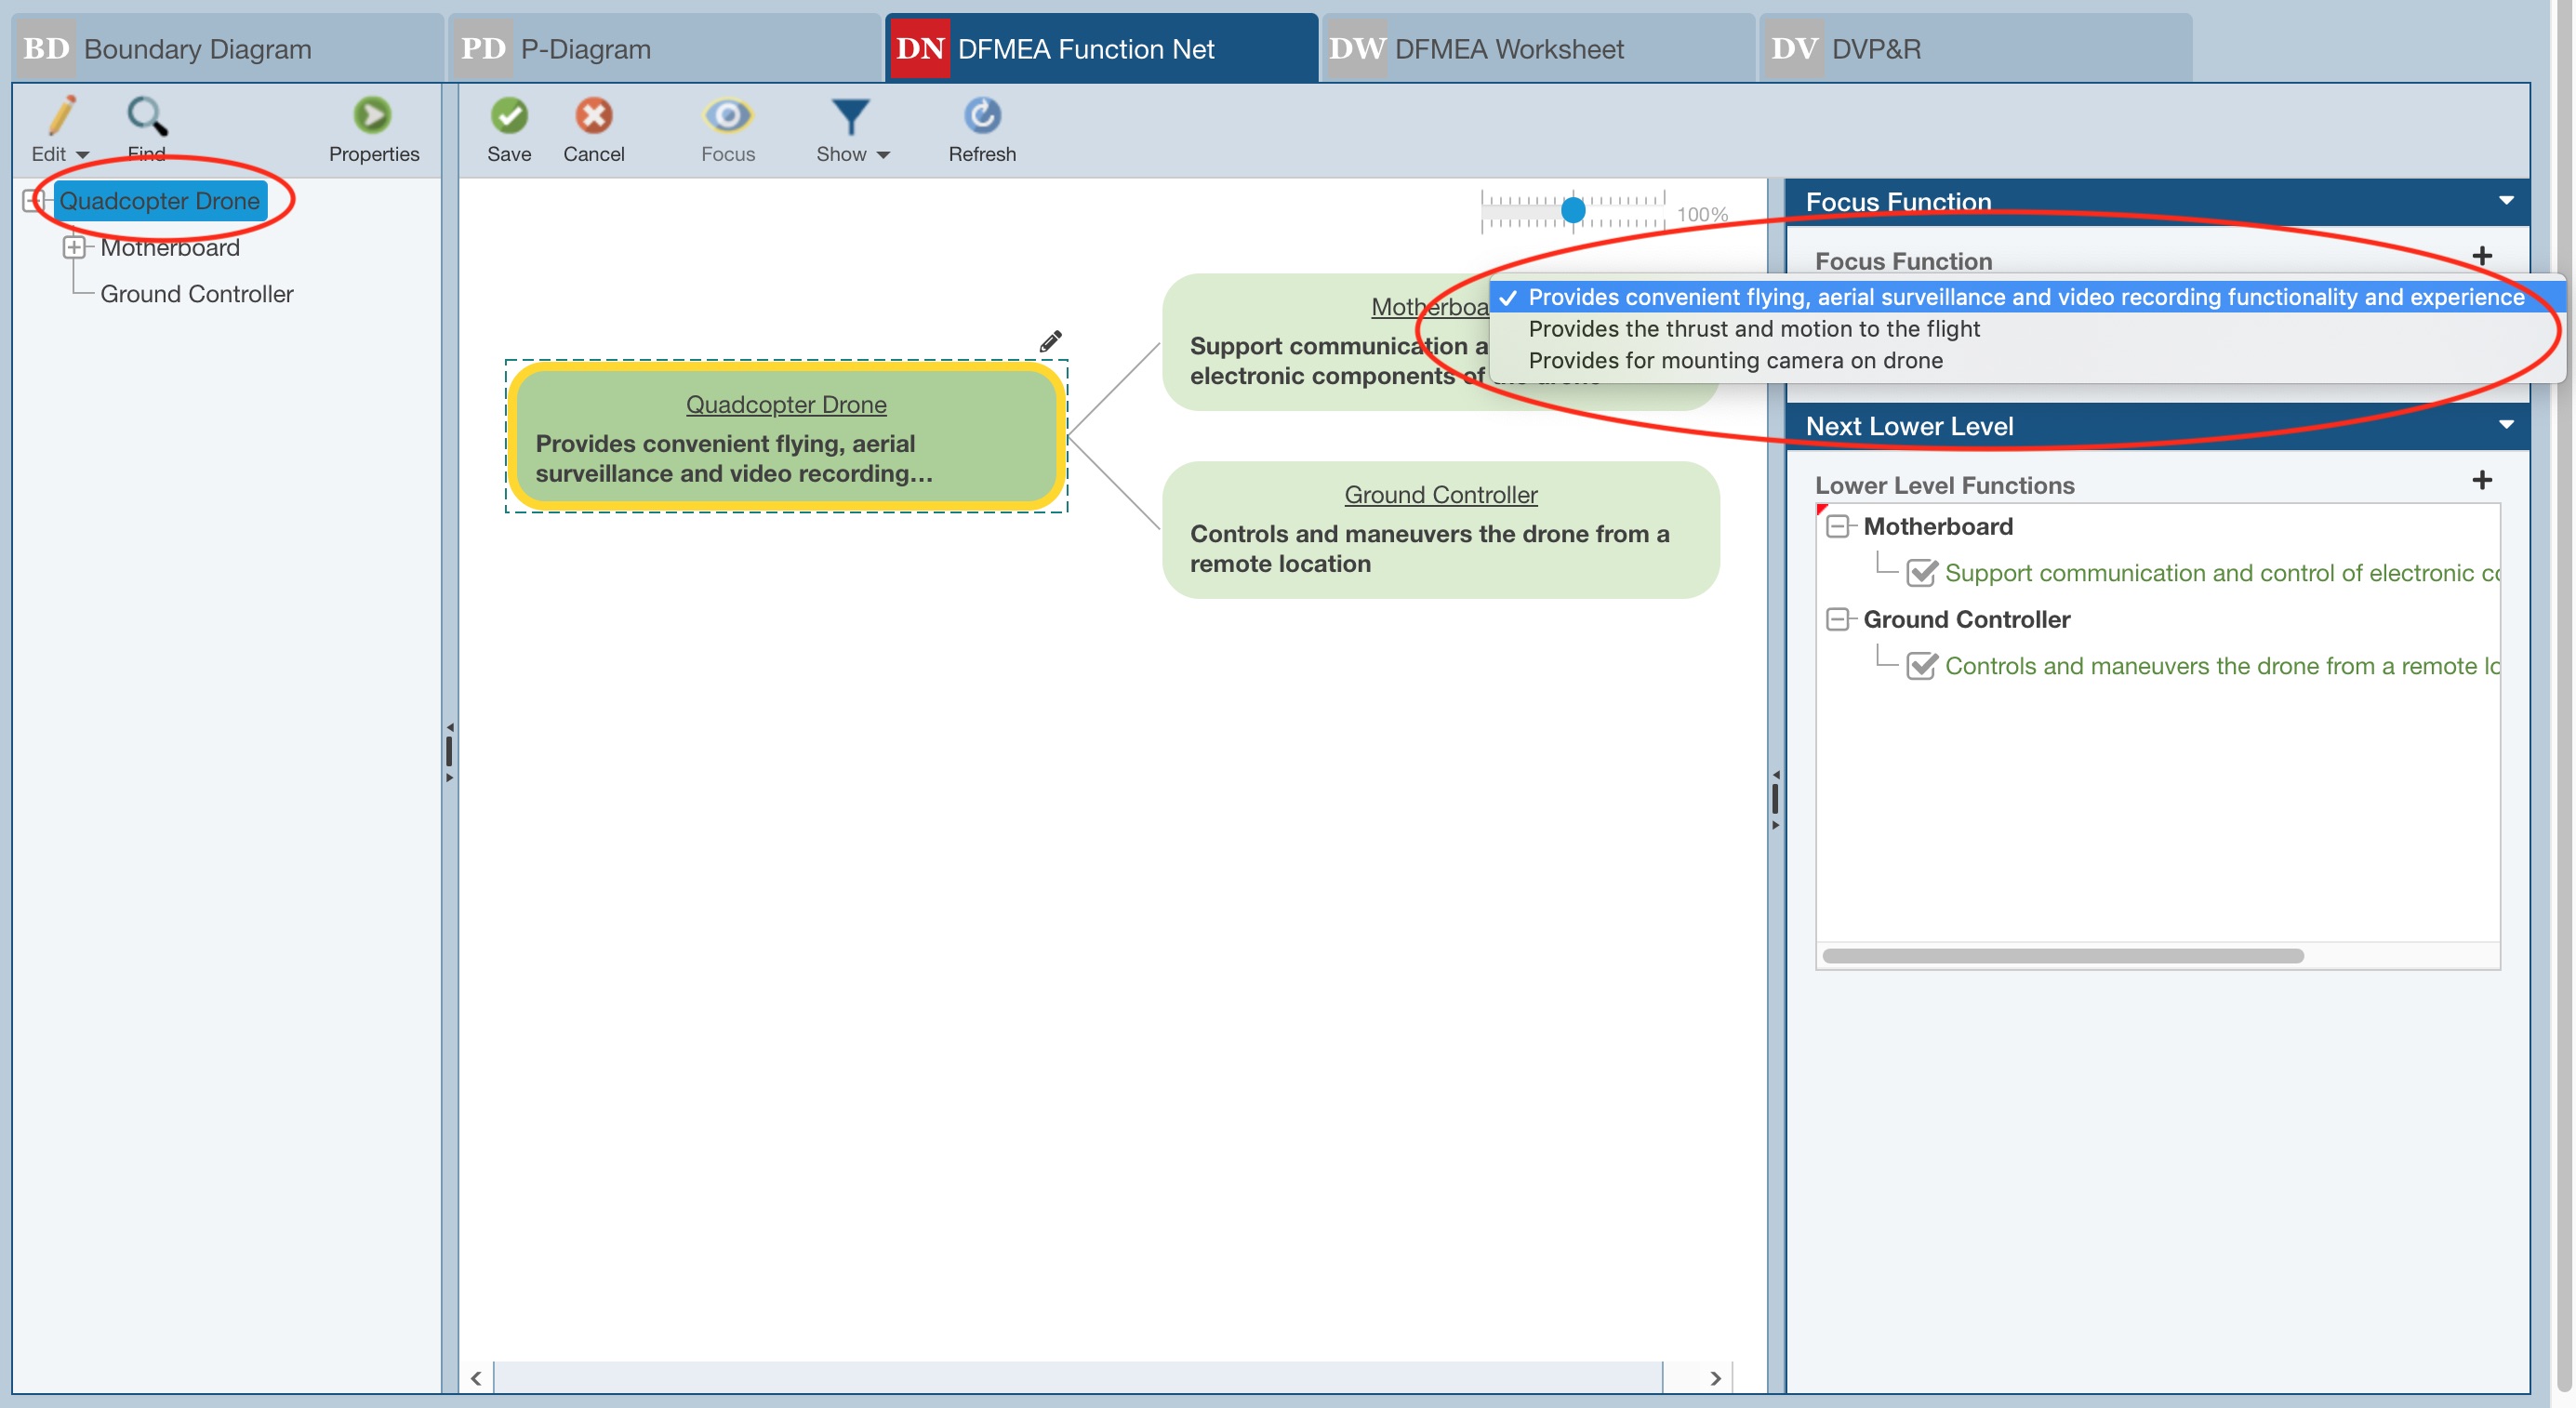
If an expected Focus Function or Next Higher Level Function or Next Lower Level Function does not exist, you can use the Add buttons to add it.
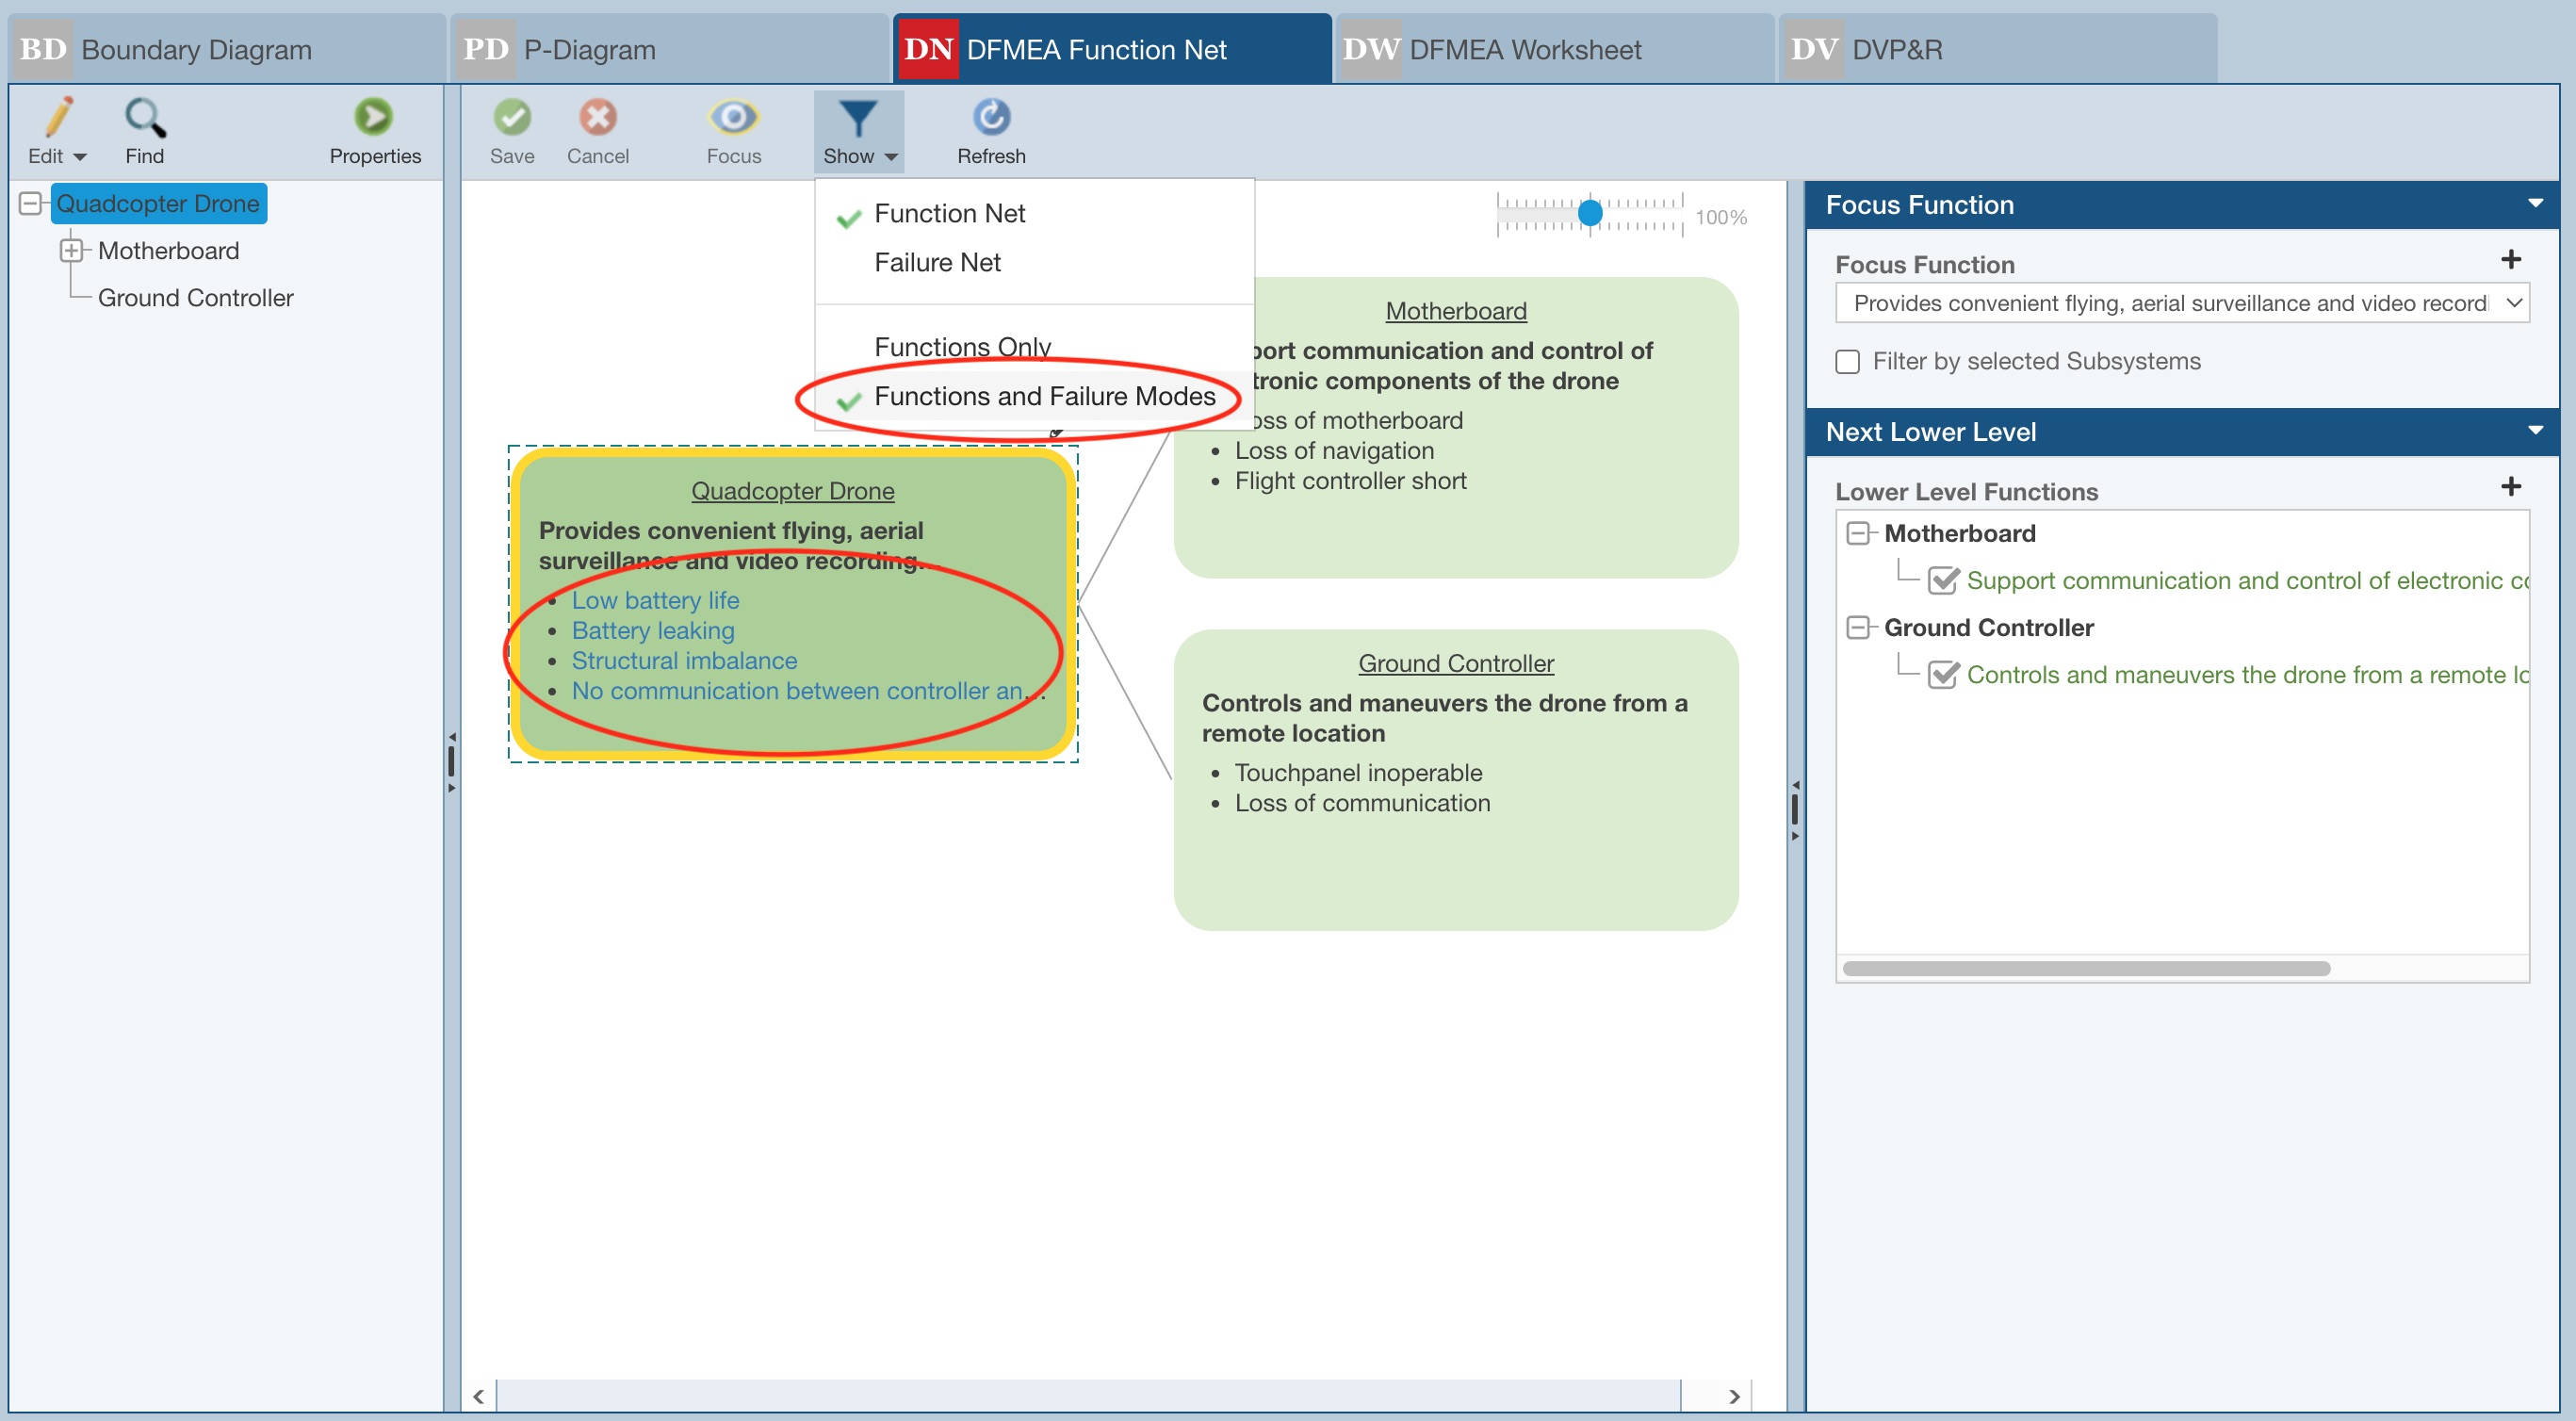
2. From the Show menu, select Functions and Failure Modes to see more details on the Function Net tab.
3. When the Function Net details are complete, if you wish to construct a Failure Net, from the top toolbar, select Show>Failure Net.
The Failure Net details are shown.
Select the necessary Focus Failure.
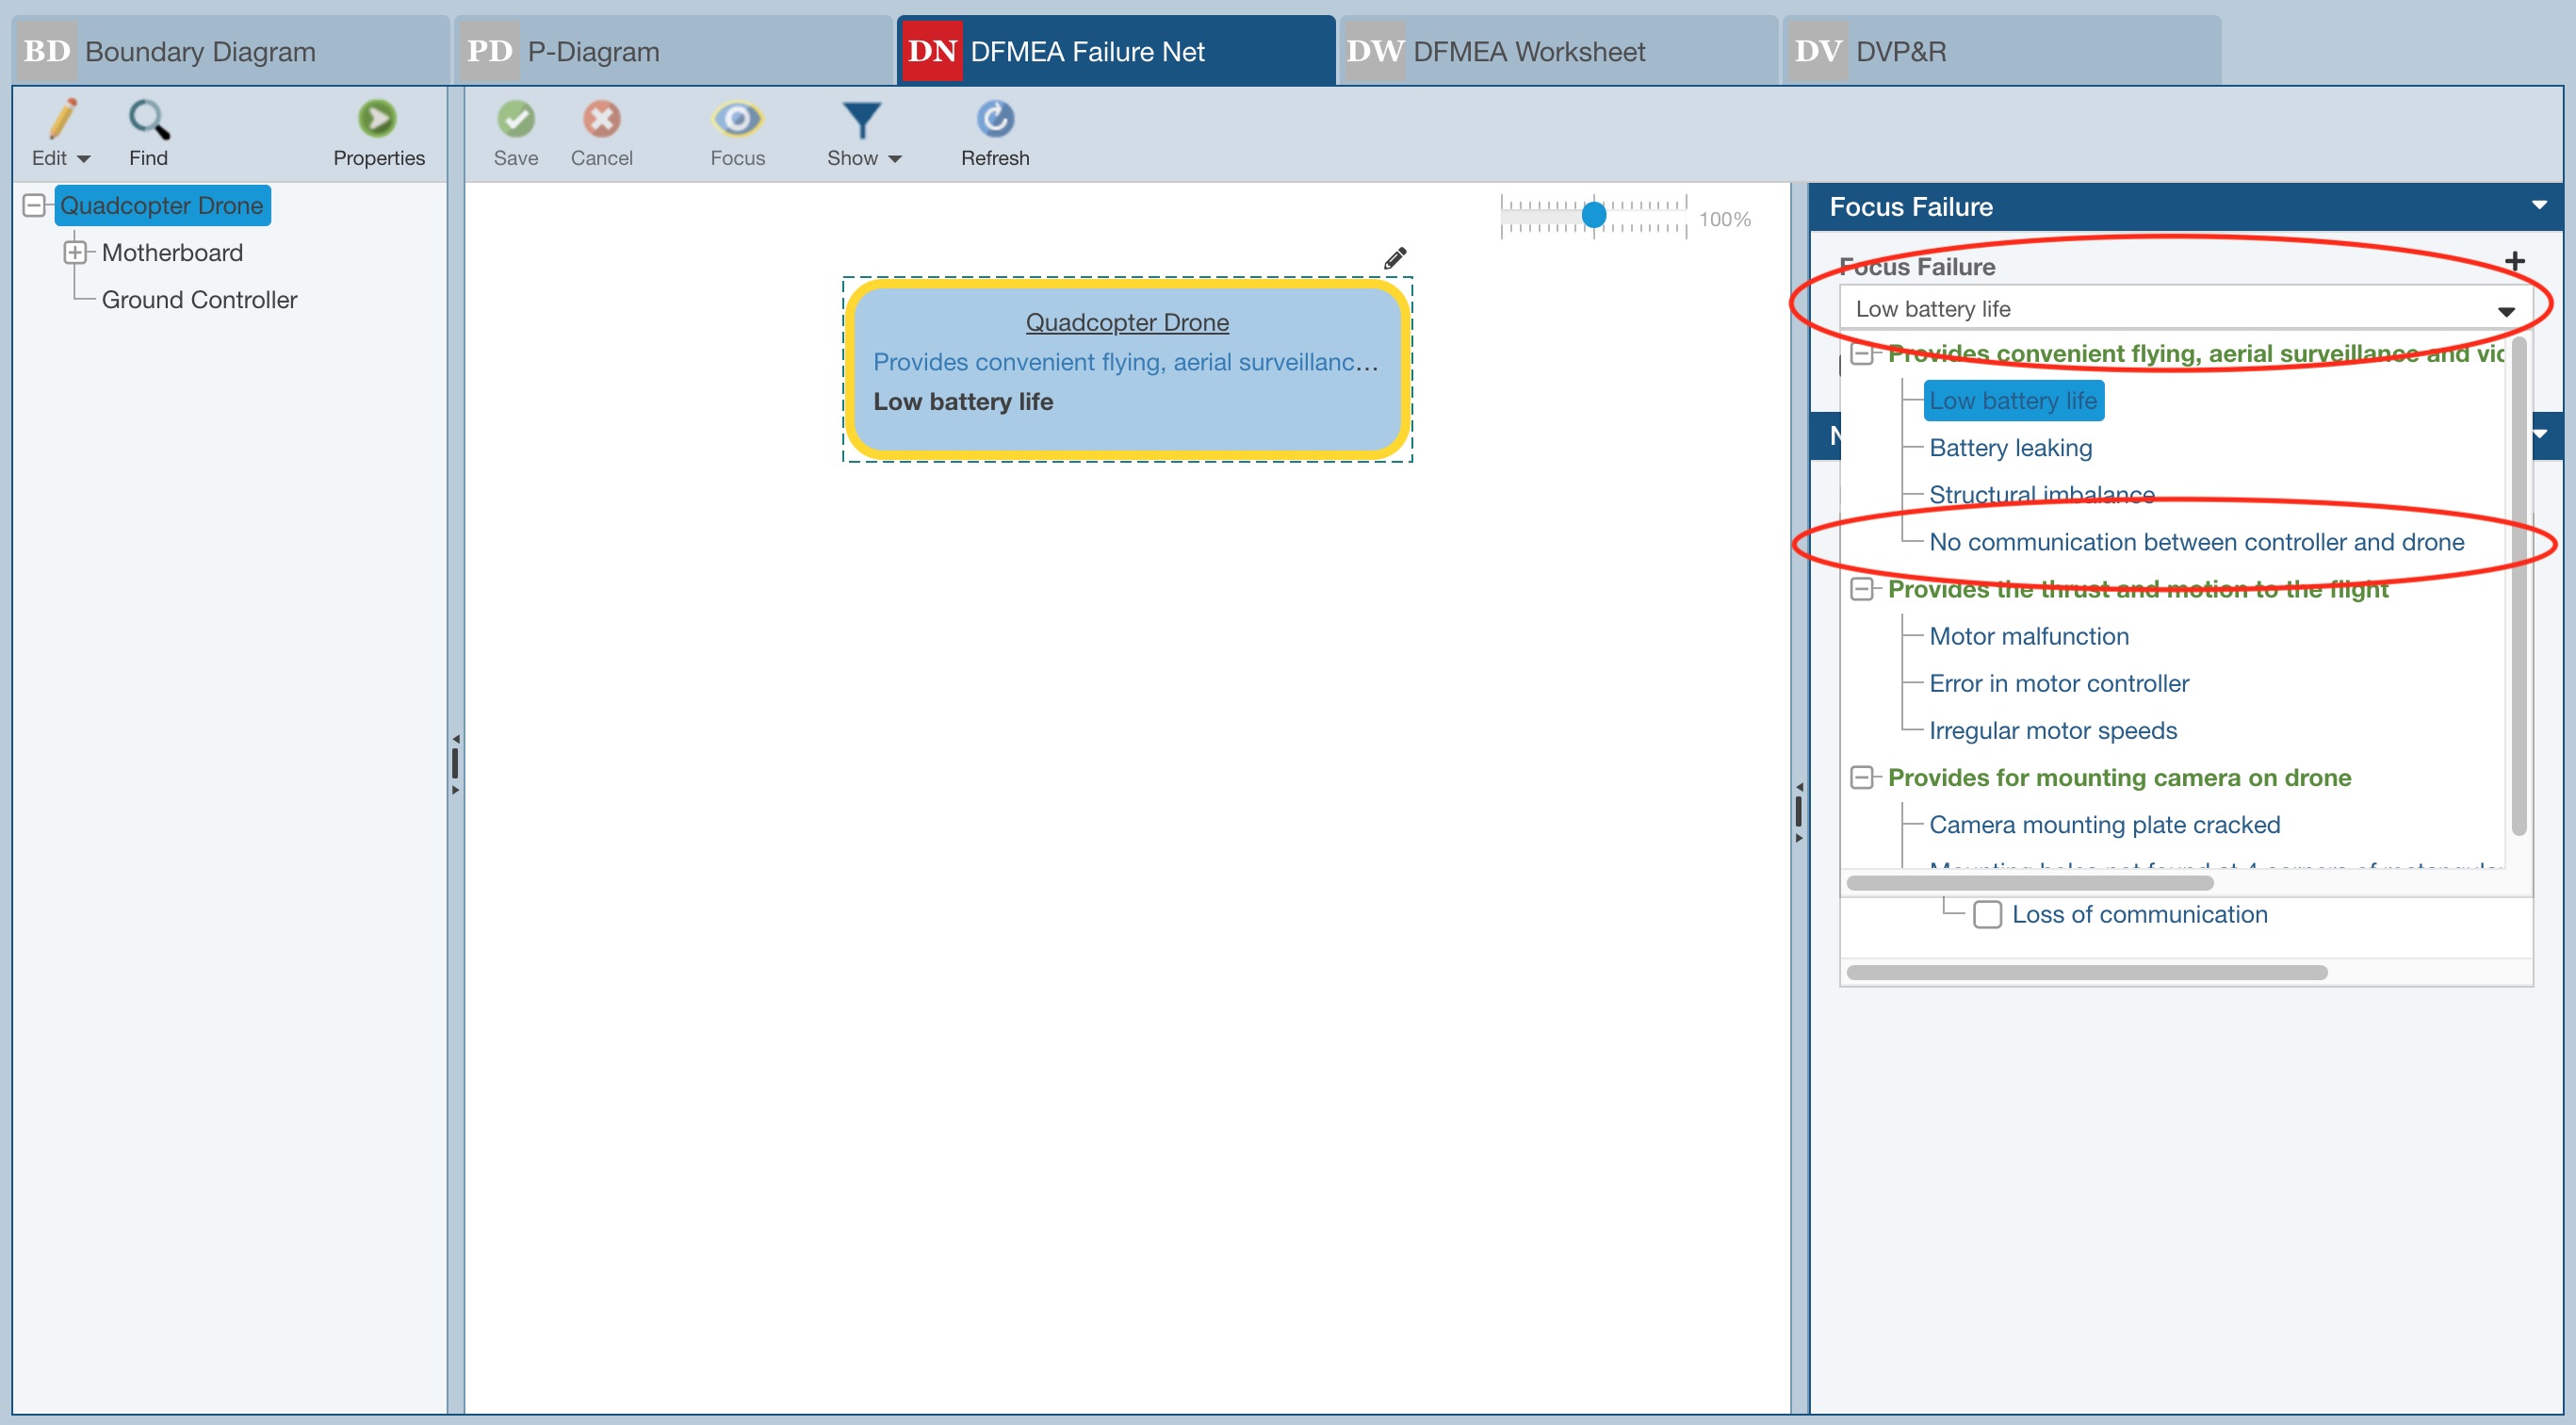
The Analysis Tree item, related Function and Focus Failure are displayed.

As needed, from the right-most pane, select the applicable Higher Level Failures and Lower Level Failures.
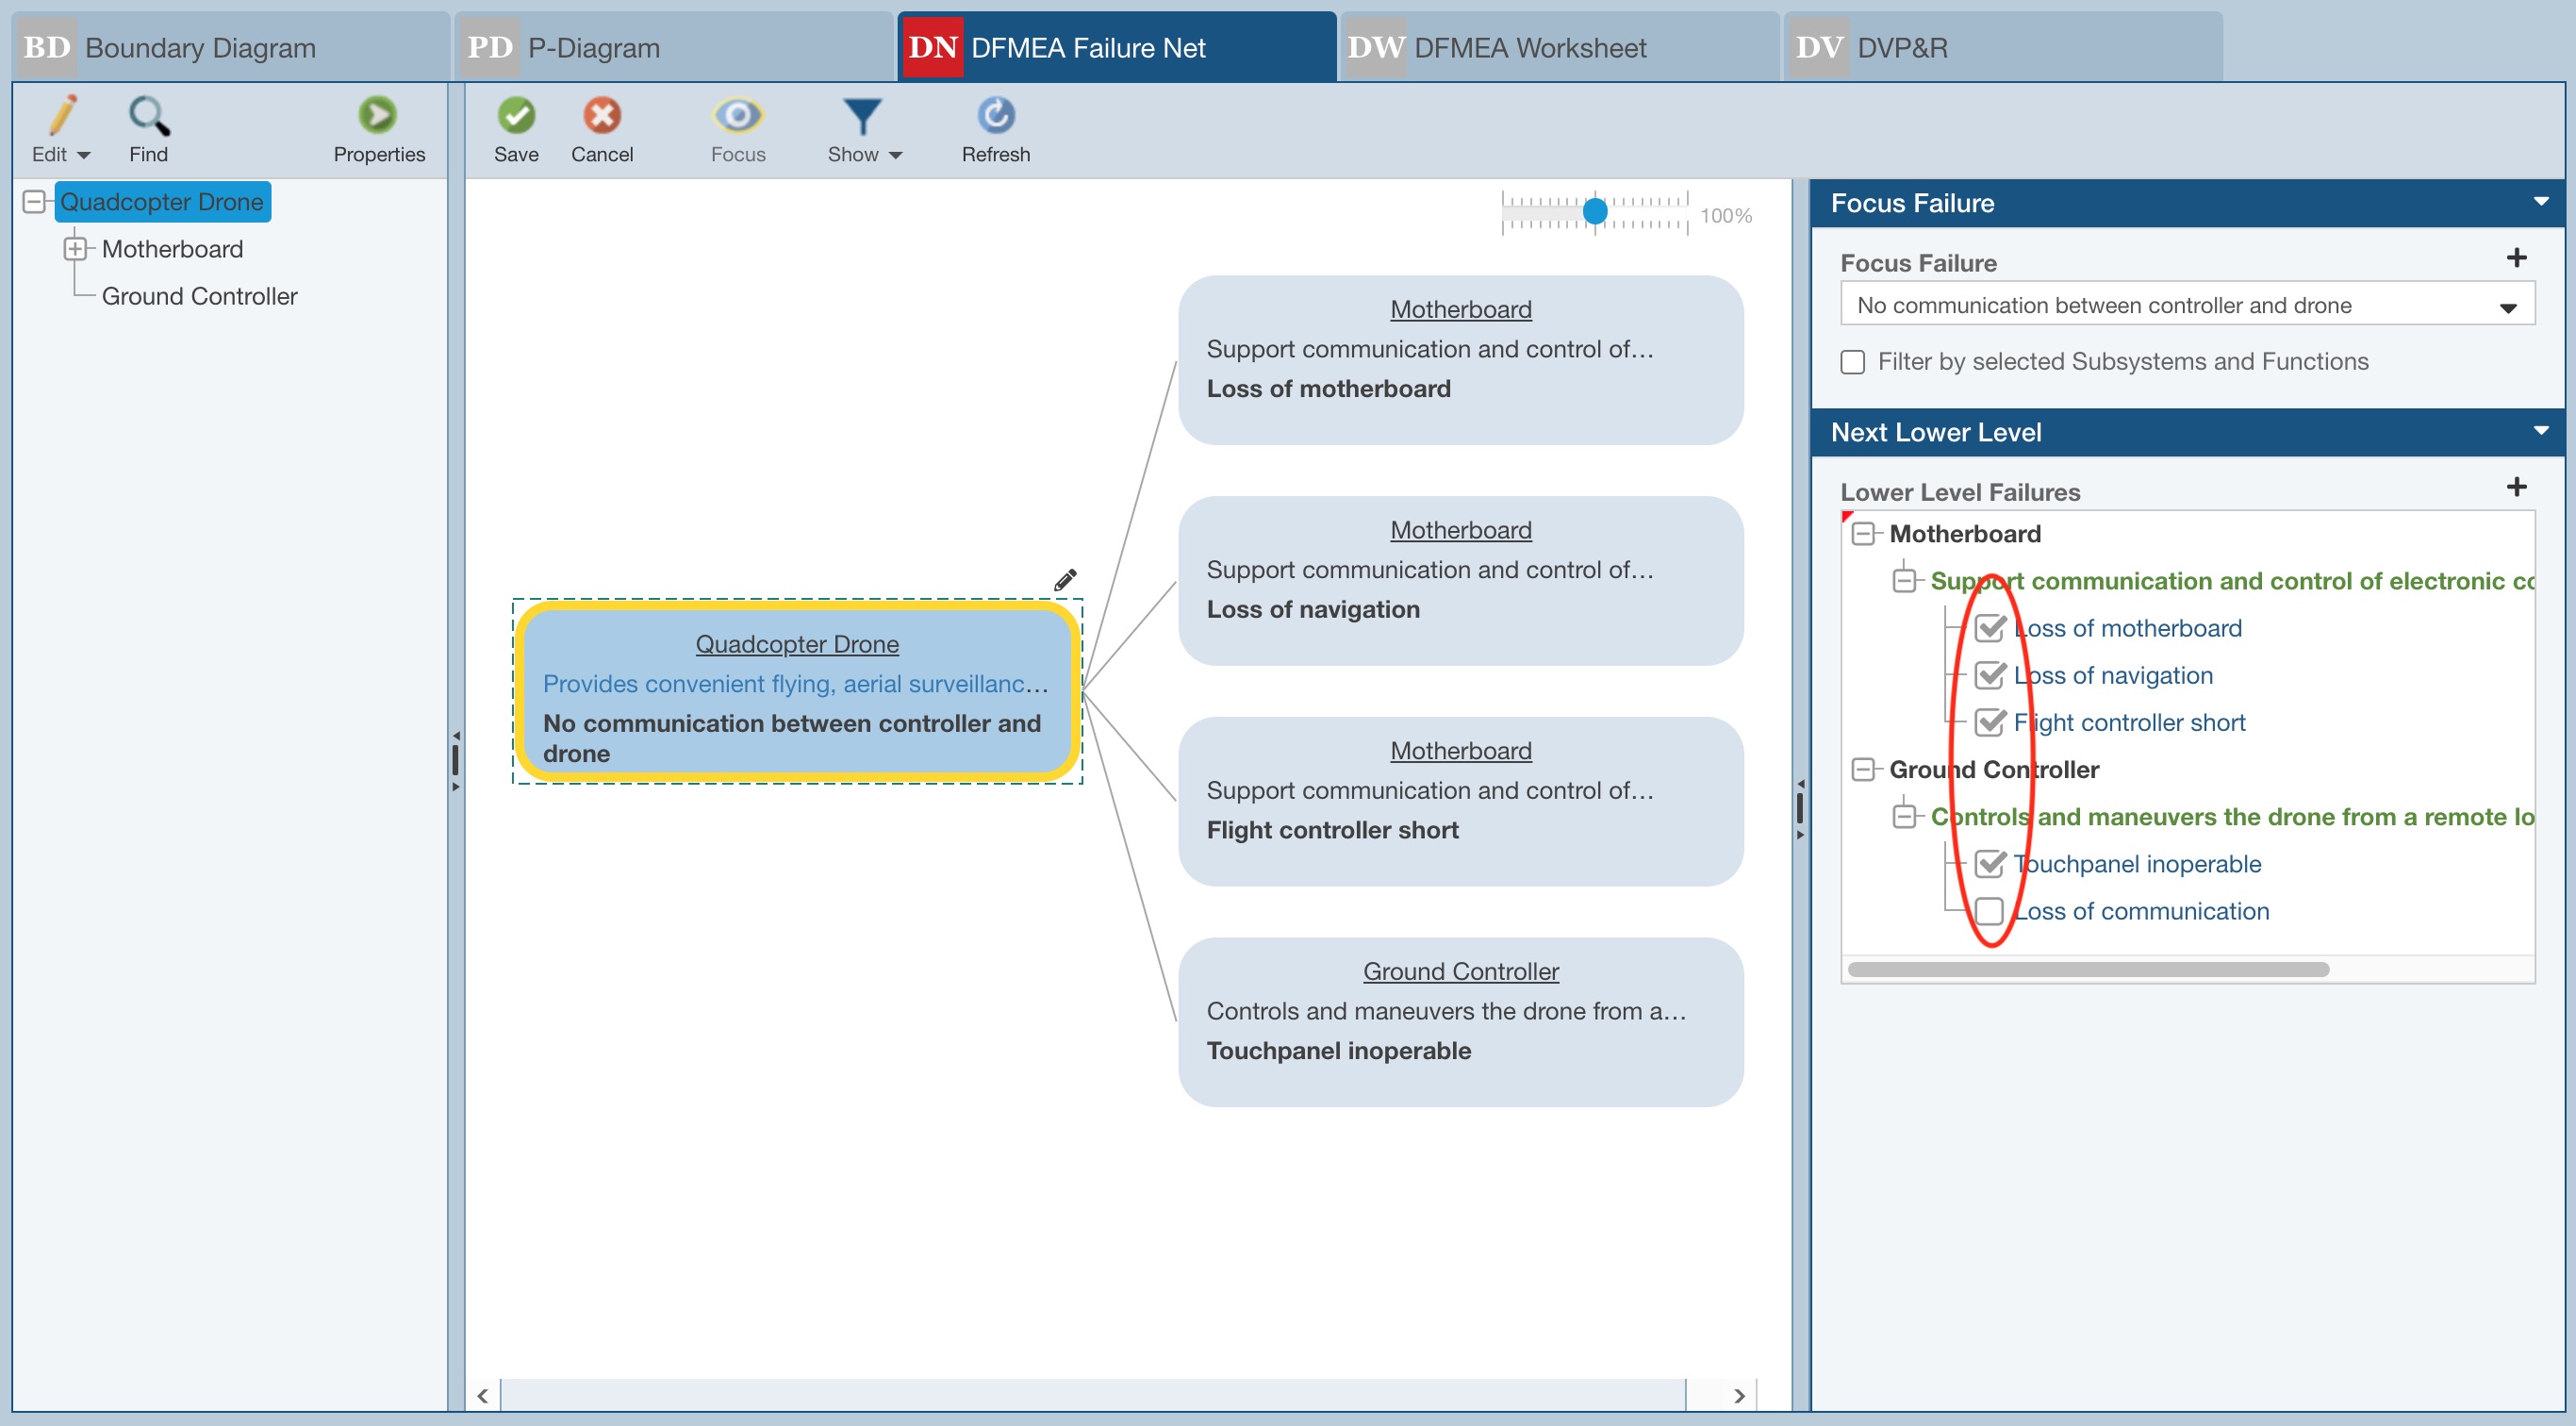
The related Failures are added to the Failure Net.
2. Repeat for each Analysis Tree item and all applicable Focus Failure. To select an Analysis Tree item, click the Subsystem in the Analysis Tree pane. To choose a different Focus Failure, select it from the list.

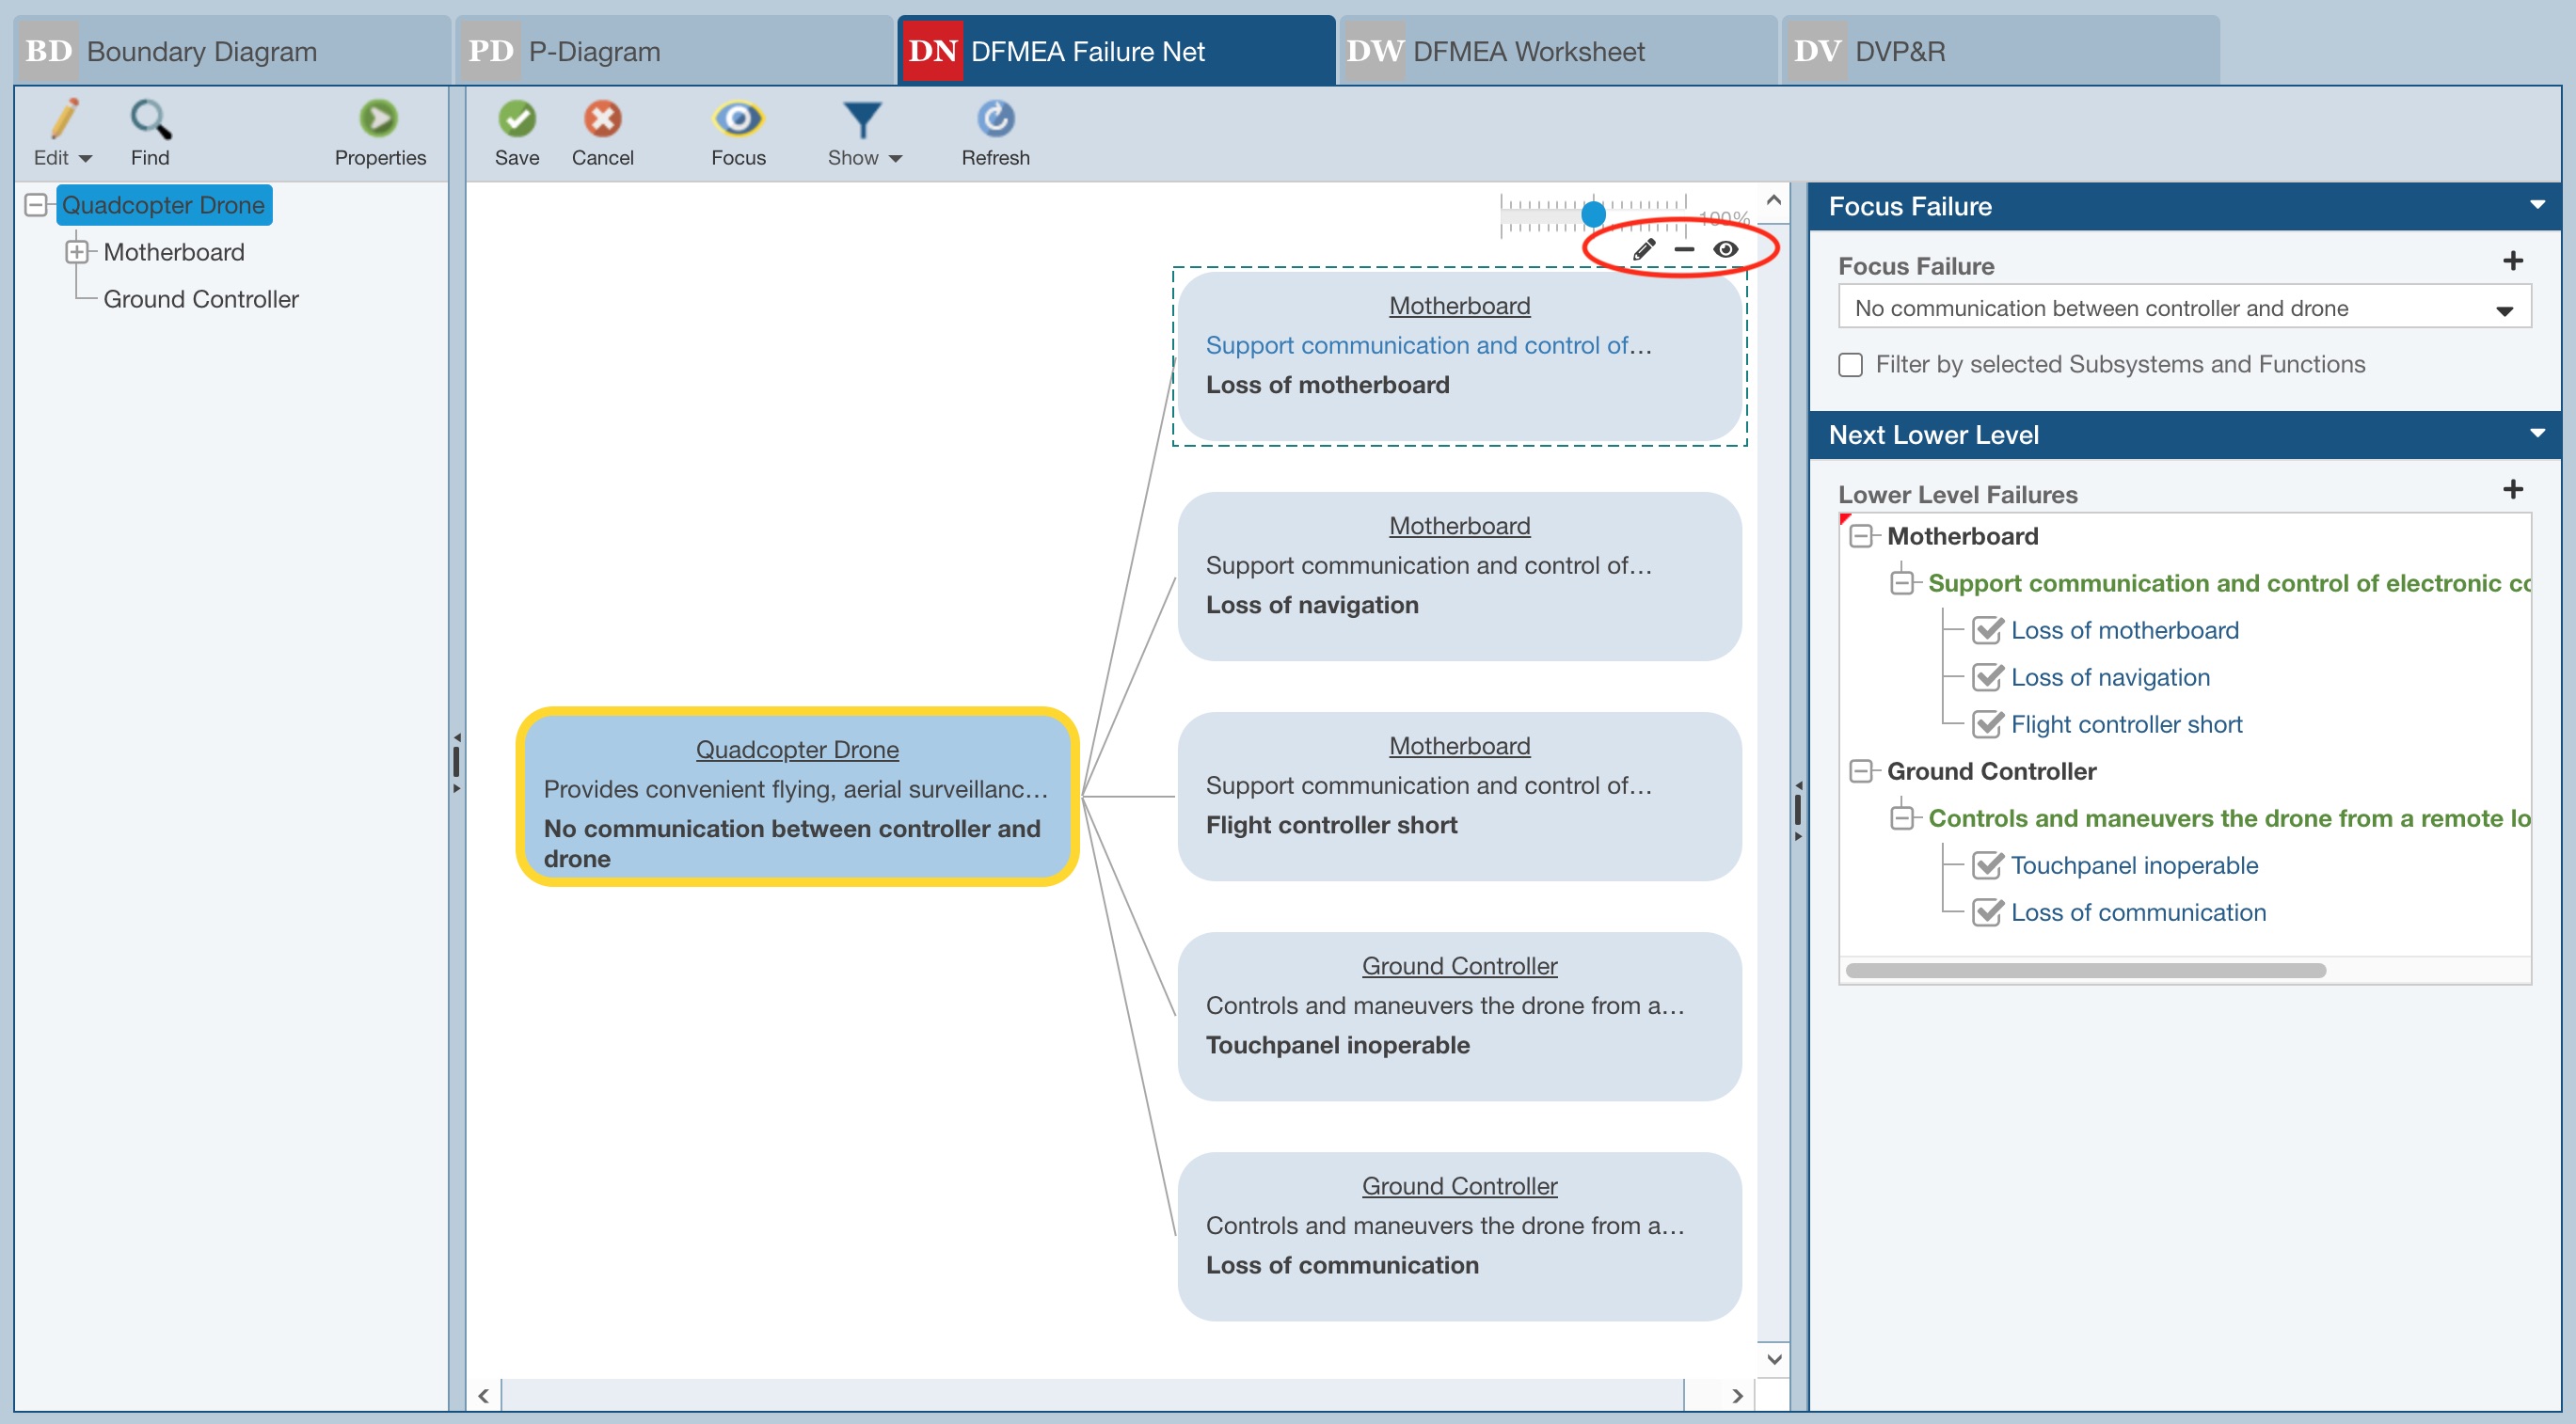
Note that in the Failure Net pane, you can use the Edit button to edit the text for the Focus Failure.

Additionally, for Next Higher Level Failures or Next Lower Level Failures, you can use the Edit, Remove, and Focus buttons to edit the text for the failure, remove the failure, or make the selected failure the Focus Failures on the DFMEA Failures Net tab.
Repeat any steps as needed to complete your Function Net and/or Failure Net. Note that Functions and Failures (Failure Modes) added in the Function Net and Failure Net are automatically added to the DFMEA Worksheet.
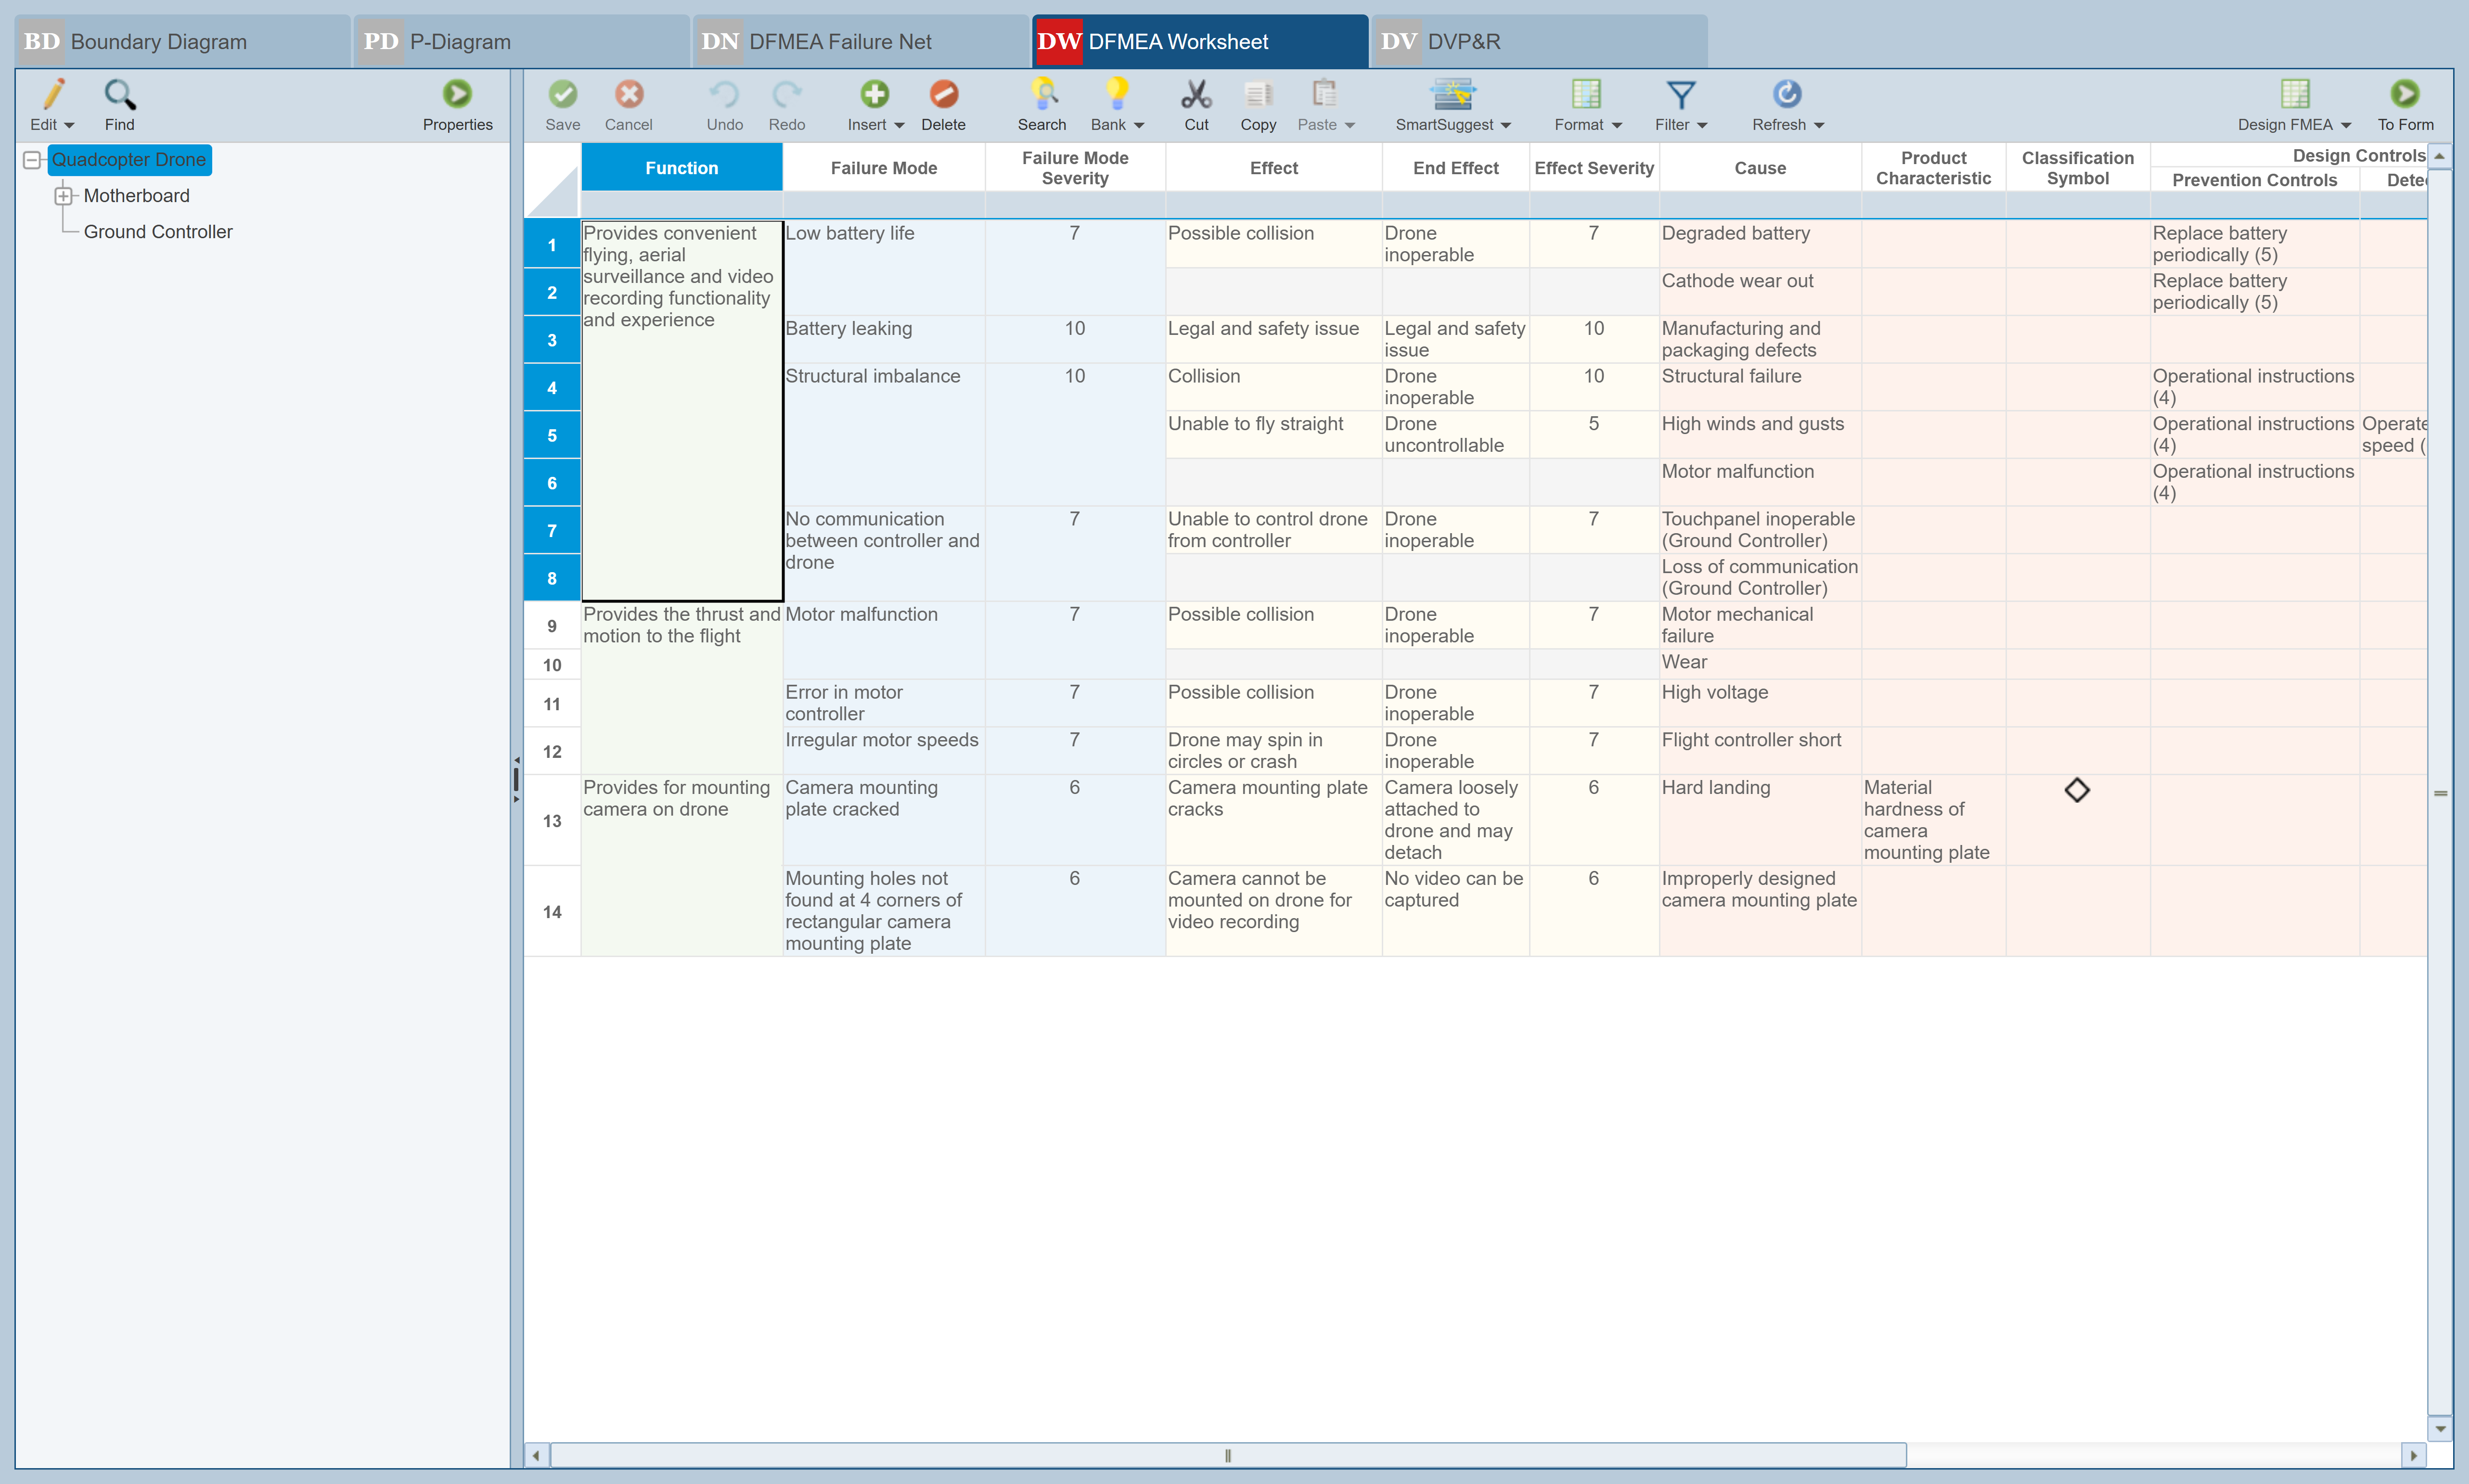
Step 5: Complete the DFMEA Worksheet
Once any desired Boundary Diagrams, P-Diagrams, Function Nets and Failure Nets are completed, you move on to the DFMEA Worksheet. The DFMEA is where you consider all potential failure modes, and their effects, causes, and actions.
Note that if you added Functions and/or Focus Failures (Failure Modes) while working on Function Nets and Failure Nets, those DFMEA details will be included on the DFMEA Worksheet.
The following steps are used to complete your DFMEA Worksheet:
Note: It is from the Insert button that you can add Functions, Failure Modes, Effects, Causes, Actions, as well as Boundary Diagram Data, FRACAS Failure Data and P-Diagram Data. Relyence FMEA also offers Autoflow functionality which allows you to define criteria to allow for records to be created and/or data fields to be populated. For more details about Autoflow in Relyence FMEA, see the FMEA Data Autoflow topic.
- For each Analysis Tree item, identify and enter Functions to be evaluated.
- For each Function, identify all the potential Failure Modes. (If you leave the Failure Mode Severity blank, Relyence FMEA will automatically assign the maximum severity level of all the Effect severities for this failure mode.)
- For each Failure Mode, list the Effects of failure. There may be more than one Effect.
- For each Effect, assign the appropriate Severity.
- For each Failure Mode, list the Causes of failure. There may be more than one Cause.
- For each Cause, assign an Occurrence ranking. Occurrence ranking indicates the frequency that this cause occurs.
- Also for each Cause, assign a Detection ranking. Detection ranking indicates how detectable the given cause is.
- Review the Risk Priority Number (RPN) value for each Cause.
- Using the RPN values as a basis, develop an action plan. Your action plan defines which line items in your DFMEA you want to work on to either mitigate or eliminate in order to maintain your quality objectives.
- Define your Recommended Actions in your DFMEA Worksheet.
- Assign actions to team members to implement; follow defined workflow as applicable.
- Once actions have been completed, go back and determine the Revised Severity, Revised Occurrence, and Revised Detection values based on the actions taken.
- Review the Revised RPN values.
- Continue to update and rework your DFMEA until you are confident all your high priority issues have been addressed.
The final step in your design FMEA work is to create a Design Verification Plan & Report, or DVP&R, if needed. A DVP&R can be used to help manage and document your tasks associated with verifying that your product meets design requirements.
If you have entered Functions in the DFMEA Worksheet for any Analysis Tree item, those Functions will appear on the DVP&R Worksheet. If not, you can enter any necessary Functions.
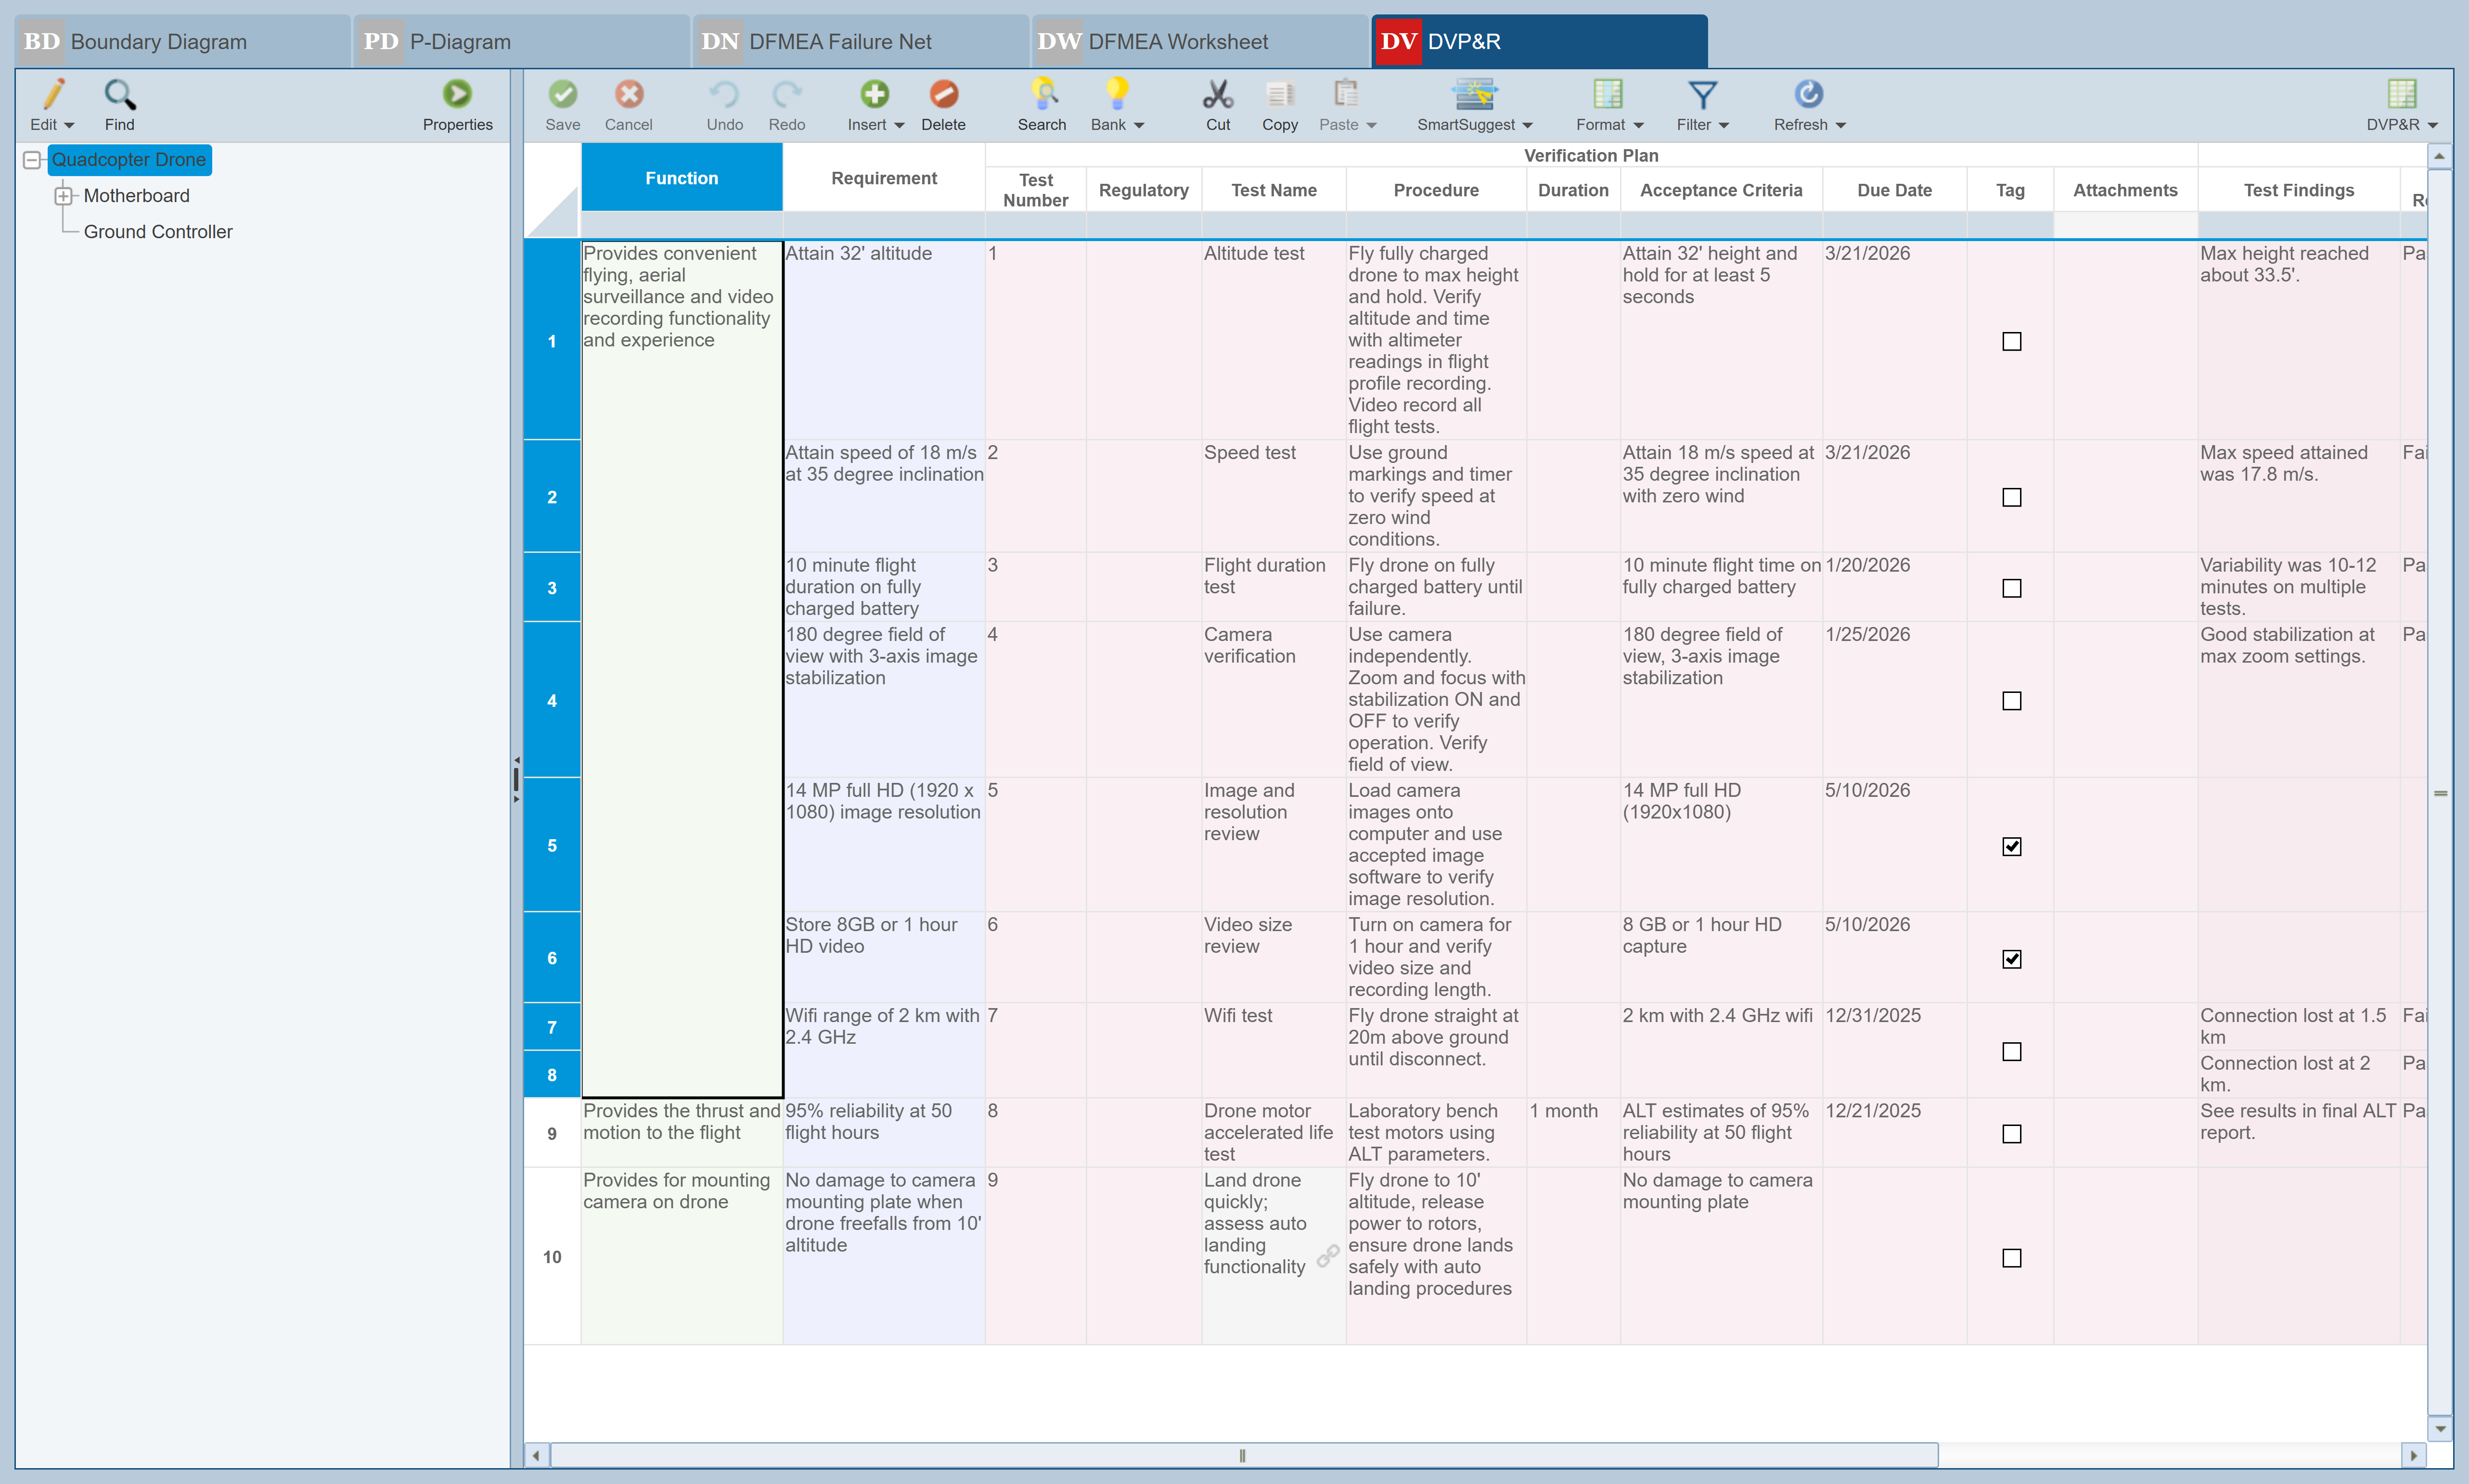
The following steps are used to complete your DVP&R:
Note: It is from the Insert button that you can add Functions, Requirements, Test Plans and Test Reports.
- For each Analysis Tree item, review and/or enter Functions to be evaluated.
- For each Function, enter all of its associated Requirements.
- For each Requirement, enter the Test Plan(s) and related data documenting the tests that will be performed to validate that the Requirement is met.
- Once Test Plan(s) have been completed, enter the Test Report(s) that document the results of the Test Plan(s).