Performing RBD Calculations
Once your RBD is complete, you can calculate the reliability, availability, sparing and cost metrics by clicking Calculate from the Sidebar. The Calculate RBD dialog is shown to allow you to select the options you prefer.
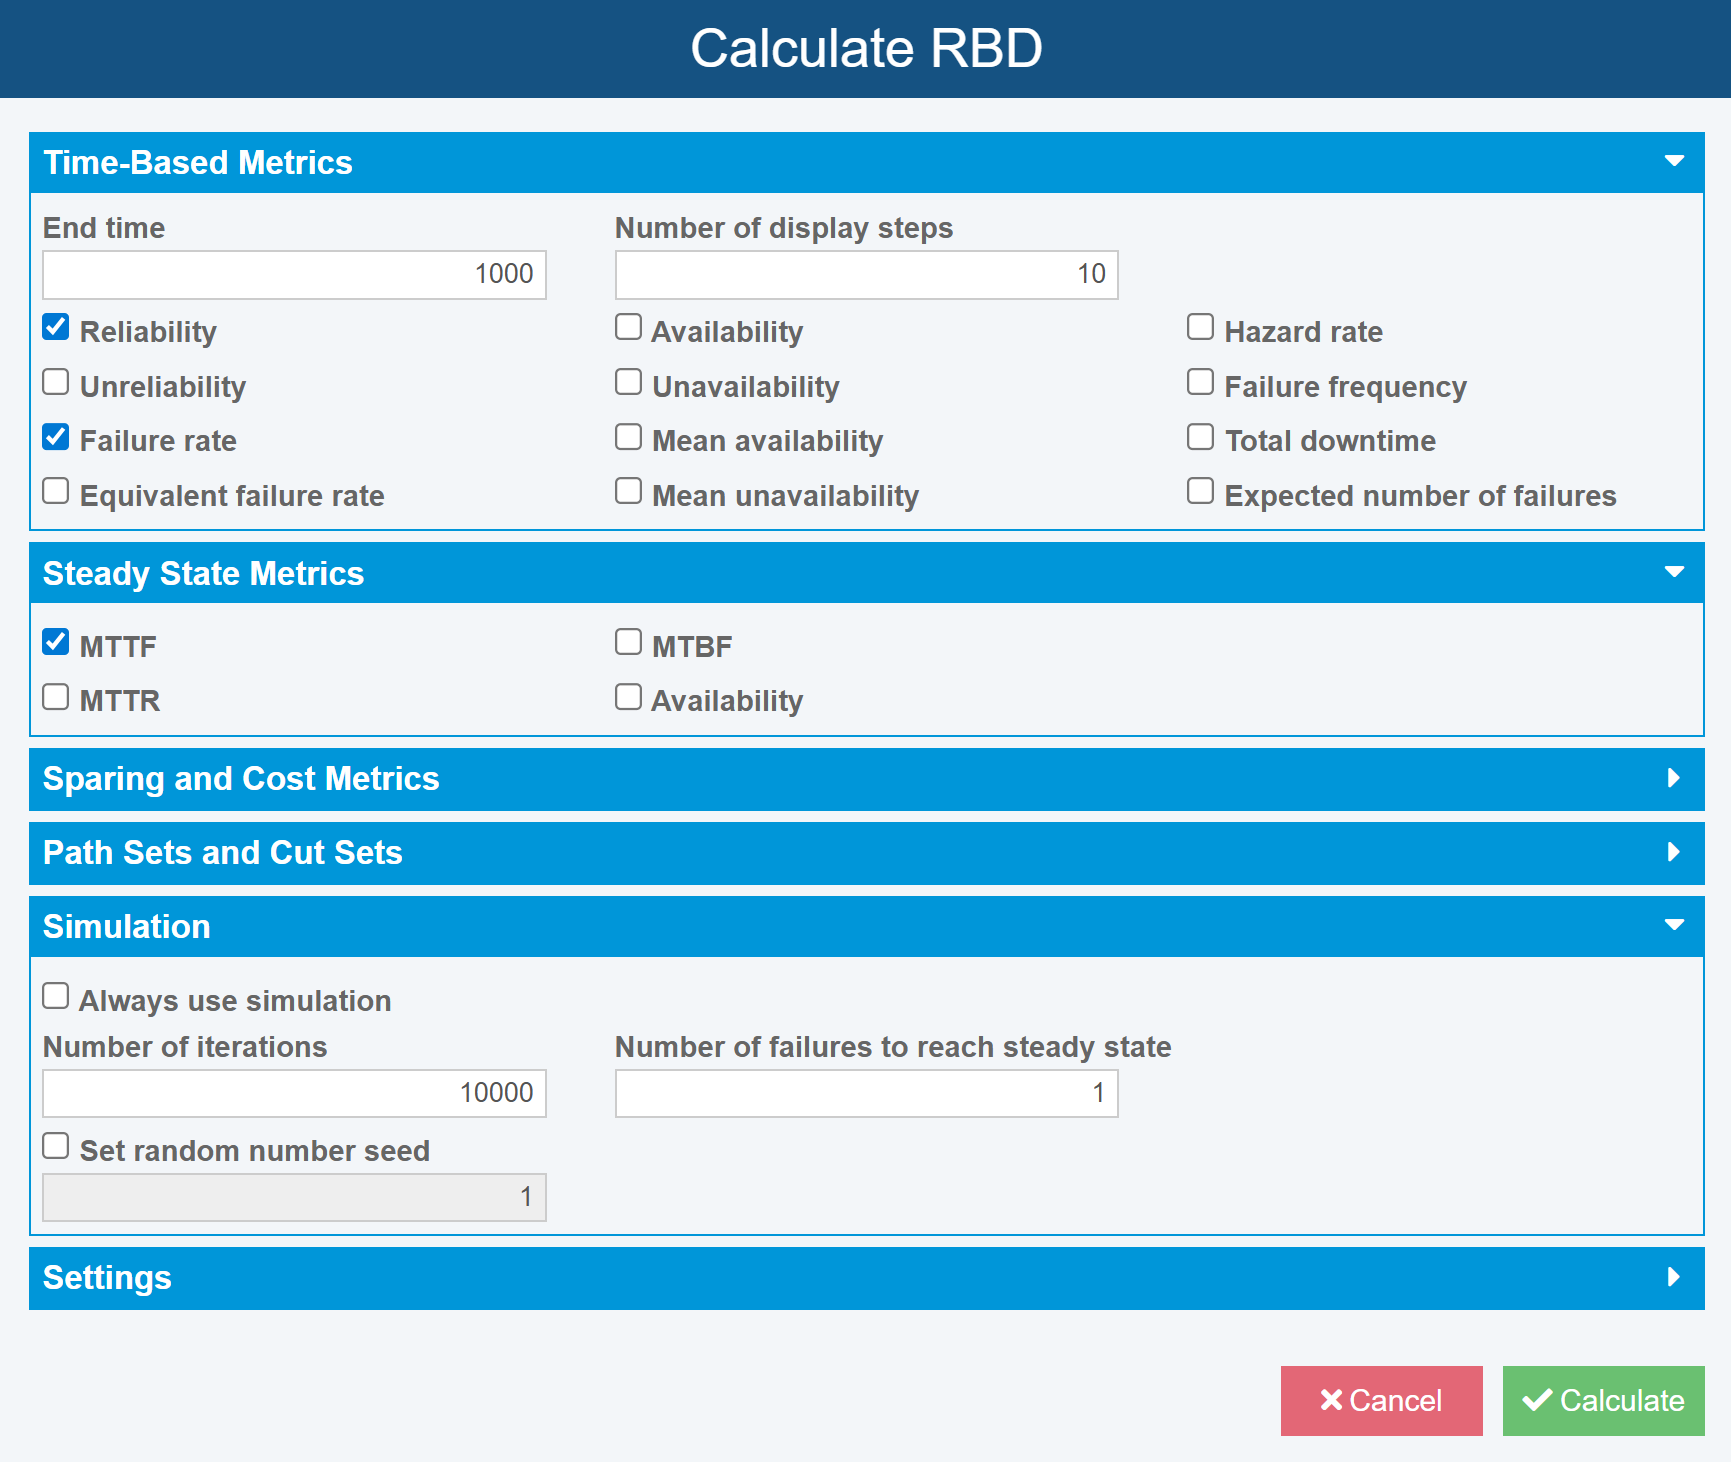
Note that depending on which calculation options you need, you can show or hide calculation parameters using the accordion sections. For example, in the above screenshot, the Time-Based Metrics section is expanded and the Sparing and Cost Metrics section is collapsed. To collapse a section, click the down-facing arrow in the blue accordion bar. To expand a section, click the right-facing arrow in the blue accordion bar.
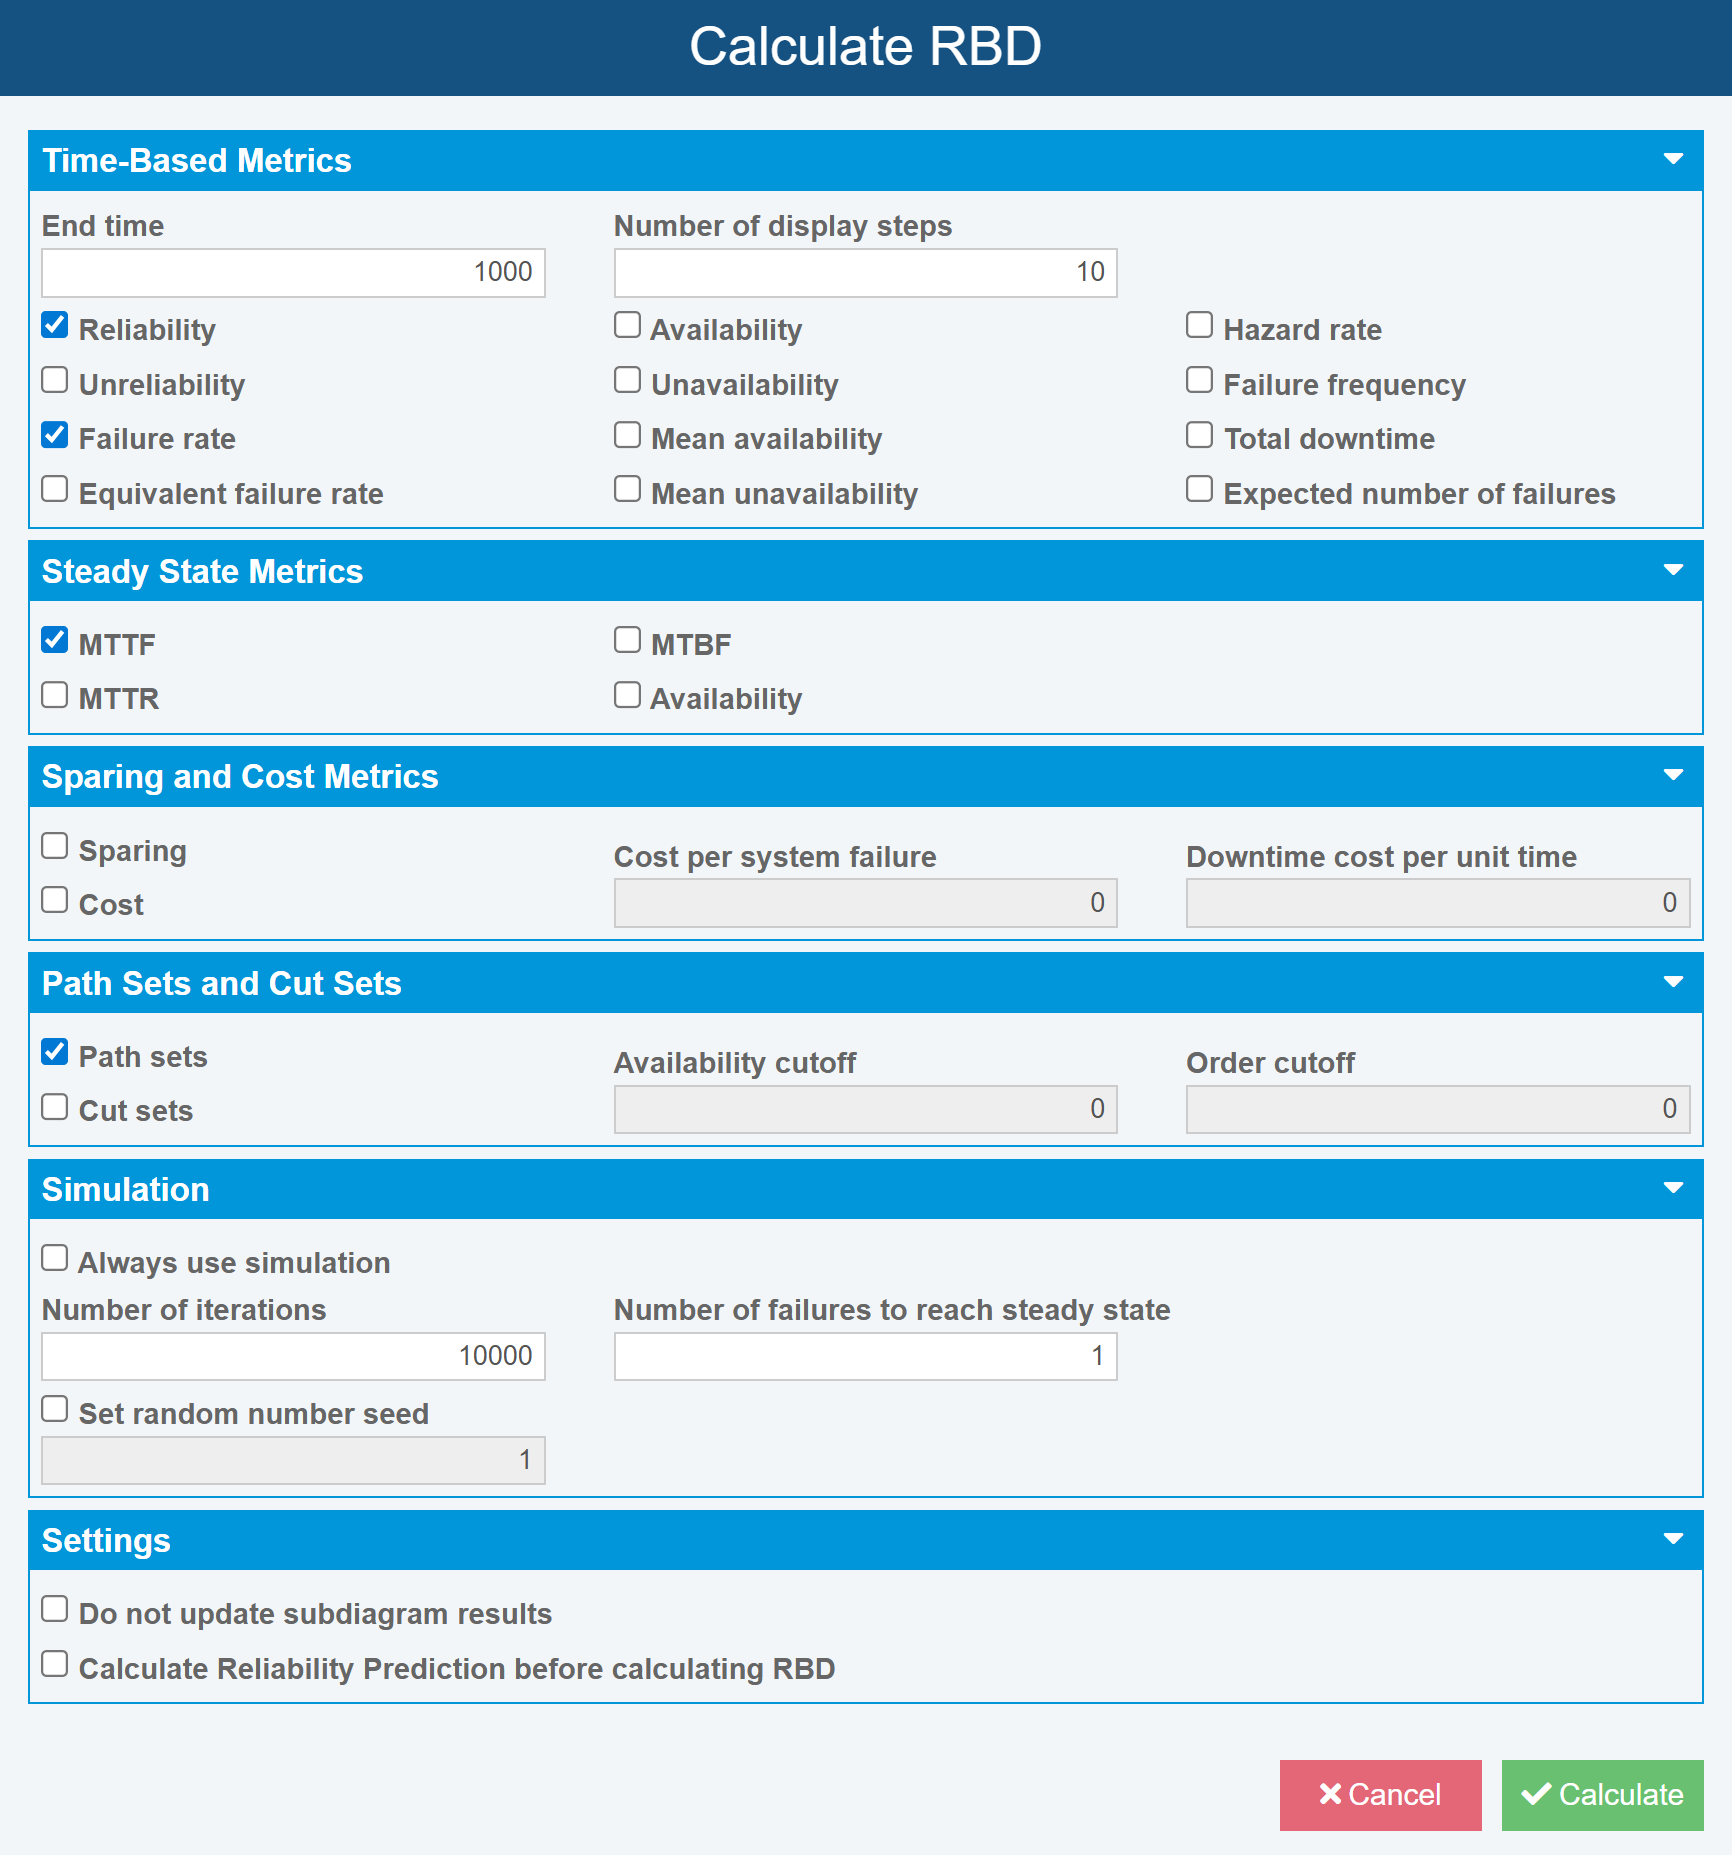
With all sections expanded, the Calculate RBD dialog shows all calculation metrics.
Depending on the complexity and layout of your RBD, and the selection of metrics to compute, the time to perform the RBD calculations will vary. The Relyence RBD calculation engine determines the optimal approach for analyzing your diagram.
The following describes the available RBD calculation options. Note that Relyence remembers your selections from run to run.
1. Time-Based Metrics:
- End time: RBD calculations all begin at time zero, and end at End time. Enter the End time desired in hours.
- Number of display steps: The interval between time point results is determined based on the Number of display steps entered. In the example above, the time point results will show 10 results plus time point 0: time 0, 100, 200, 300, 400, 500, 600, 700, 800, 900, 1000. Valid values range from 1 to 1000
- Reliability: The probability that the system has not failed when no repairs are made.
- Unreliability: The probability that the system has failed when no repairs are made.
- Failure rate: The rate that the system fails, given that it is currently operating, when no repairs are made.
- Equivalent failure rate: The failure rate a constant failure rate system would have to achieve to meet the same Reliability value of the system under analysis.
- Availability: The probability that the system is operating when repairs are taken into account.
- Unavailability: The probability that the system is not operating when repairs are taken into account.
- Mean availability: The average availability the system has experienced.
- Mean unavailability: The average unavailability the system has experienced.
- Hazard rate: The rate that the system fails, given that it is currently operating, when repairs are taken into account.
- Failure frequency: The expected frequency that failures will occur in a repairable system, whether it is operating or not.
- Total downtime: The cumulative total of the time the system has been in a failed state.
- Expected Number of Failures: The expected number of failures within the time interval from 0 to End time. The number of failures is calculated based on the failure frequency.
2. Steady State Metrics:
- MTTF: Mean Time To Failure, assuming no repairs are made.
- MTTR: Mean Time To Repair for a repairable system.
- MTBF: Mean Time Between Failures: The average time between successive system failures, including the time to fail and the time to repair.
- Availability: The availability the system will stabilize at if it operates sufficiently long enough.
- Sparing: Determines calculation results that are specific to individual Spare Pools and all Spare Pools combined.
- Cost: Determines various cost-based results for the RBD. This includes Downtime Cost, which can be calculated considering Spare Pool(s) or without Spares.
- Cost per system failure: A contributing input to the Downtime Cost.
- Downtime cost per unit time: A contributing input to the Downtime Cost.
- Path sets: Determines the path sets, or successful paths from the Start Node through the End Node.
- Cut sets: Determines the cut sets, or the blocks that alone or in combination cause a system failure.
- Availability cutoff: Numerical value for cut set probability (Availability) cut off for calculations. Cut set with probabilities above this level will be excluded from results. Used to eliminate insignificant cut sets and reduce computational time.
- Order cutoff: Numerical value for the number of blocks per cut set to cut off for calculations. If nonzero, cut sets with more than the specified number of blocks will be excluded from results. Used to reduce computational time.
5. Simulation:
- Always use simulation: If possible, Relyence will use an analytical (non-simulated) calculation method to obtain exact results. If you prefer to always use the simulator engine for your RBD calculations, select this checkbox.
- Number of iterations: The number of iterations for the simulator to run. Increasing the number of simulations increases the accuracy of the results, up to a point, but also increases computational time.
- Number of failures to reach steady state: Sets the number of failures components can experience before considered to have reached steady state. By default, this is set to 1.
- Set random number seed: Select this checkbox and enter the random number seed if you wish to specify the random number seed for the simulator engine. By specifying the random number seed, Relyence RBD will return the same calculated results from simulation from one calculation run to another, provided no input values have changed. Otherwise, Relyence will obtain a random number seed.
6. Settings:
- Do not update subdiagram results: When clear, the results of calculated subdiagrams will be saved and can be viewed on the subdiagram. When selected, the newly calculated results of subdiagrams will not be saved, and any old results on the subdiagrams will still be available to view. Using this option allows you to calculate the subdiagrams independently and keep those independently calculated results unchanged when you later calculate the parent diagram. If a subdiagram is used in multiple places, only one set of results are saved. If you are not using subdiagrams in more than one place, it is recommended to clear this option so that your subdiagram results are saved.
- Calculate Reliability Prediction before calculating RBD: When enabled, your Reliability Prediction Analysis will be calculated before initiating the RBD calculations. Enabling this setting ensures that the failure information in your RBD that is linked to your Reliability Prediction will be up to date. Disabling this setting will perform the RBD calculations using the last saved reliability prediction calculation data. For example, if your Reliability Prediction analysis is complete and will not be modified, you can disable this option because the reliability prediction values will not change.
Once you have set the calculation options to your preferences, click Calculate to start the RBD calculations.
A progress bar appears to indicate calculation progress. Once the calculation is complete, the Results dialog is displayed. Or, if you have constructed an RBD for which Results cannot be calculated, Relyence will return an Unable to Calculate dialog describing the reason the calculations cannot be completed - see Unable to Calculate Messages for more details.
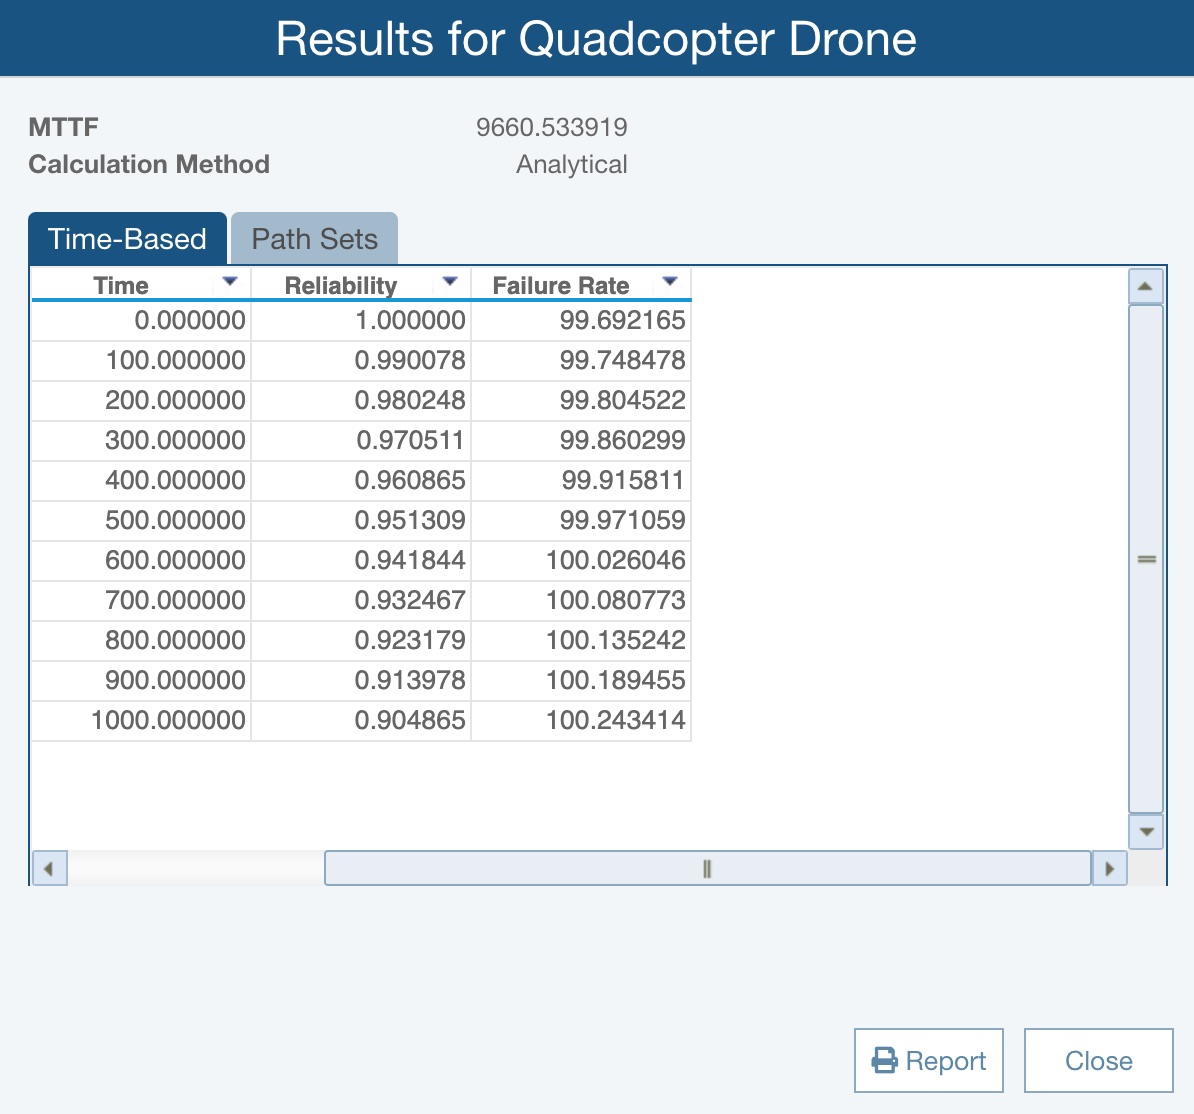
The Results dialog shows the overall results for your RBD. You can also view the individual block results for each block in your RBD. To do this, drag the Results dialog over until you can see the "Motors" block. Click on the "Motors" block to see the Results dialog update and display the calculated results for the Motors. To view the overall RBD results, select the Start or End Block.
As needed, click the Path Sets or Cut Sets tabs to review Path Sets and Cut Sets.
Click Close when you have completed viewing the calculation results. Also, Reliability of each of the blocks (at the specified end time point) will be shown on all the blocks of your RBD. The result value displayed on the RBD blocks can be set using RBD Properties and is set to Reliability by default.
Anytime you want to view the Results again, click View Results from the Sidebar to re-display the Results dialog.
Unable to Calculate Dialog Messages
Relyence will return an Unable to Calculate dialog describing the reason the calculations cannot be completed. The Unable to Calculate dialog may denote one of the following:
| Diagram cannot be calculated: Please contact support@relyence.com for technical assistance. | |
|---|---|
| Diagram cannot be calculated: Cold/Warm Standby does not support Repeat Blocks. | |
| Diagram cannot be calculated: Cold Standby Branches must contain either all Blocks or a single Subdiagram. | RBD contains a Cold Standby Branch with Blocks and Subdiagrams on the same Branch. |
| RBD contains a Cold Standby Branch with more than one Subdiagram. | |
| RBD contains a Subdiagram with Quantity > 1 in a Cold Standby Branch. | |
| Diagram cannot be calculated: Switches on Subdiagrams in Cold Standby configurations must have Probability of 1 and no Delay. | RBD contains a Cold Standby Branch with a Subdiagram that contains a Redundant Block with Switch Probability < 1 or Switch Delay > 0. |
| RBD contains a Cold Standby Redundant Block linked to a Subdiagram that contains a Redundant Block with Switch Probability < 1 or Switch Delay > 0. | |
| RBD contains a Cold Standby Branch with a Subdiagram that contains a Branch with Switch Probability < 1 or Switch Delay > 0. | |
| RBD contains a Cold Standby Redundant Block linked to a Subdiagram that contains a Branch with Switch Probability < 1 or Switch Delay > 0. | |
| Diagram cannot be calculated: Cold/Warm Standby elements cannot be nested. | RBD contains nested Subdiagrams in a Cold Standby configuration. |
| RBD contains nested Branches in a Cold/Warm Standby configuration. | |
| RBD contains a Cold Standby Branch with a Subdiagram that contains a Cold/Warm Standby Redundant Block. | |
| RBD contains a Cold Standby Redundant Block linked to a Subdiagram that contains a Cold/Warm Standby Redundant Block. | |
| RBD contains a Cold/Warm Standby Redundant Block within a Cold/Warm Standby Branch. | |
| RBD contains a Cold Standby Redundant Block linked to a Subdiagram that contains a Cold/Warm Standby Branch. | |
| RBD contains a Cold Standby Branch with a Subdiagram that contains a Cold/Warm Standby Branch. | |
| Diagram cannot be calculated: Switches on Redundant Blocks in Cold Standby Branches must have Probability of 1 and no Delay. | RBD contains a Redundant Block with Switch Probability < 1 or Switch Delay > 0 within a Cold Standby Branch. |
| Diagram cannot be calculated: Switches on Branches contained in Cold/Warm Standby Branches must have Probability of 1 and no Delay. | RBD contains a Branch with Switch Probability < 1 or Switch Delay > 0 within a Cold/Warm Standby Branch. |
| Diagram cannot be calculated: A Block is linked to a missing Spare Pool. | RBD contains a Block linked to a missing Spare Pool. |
| Diagram cannot be calculated: A Spare Pool cannot be referenced across multiple Diagrams. | RBD contains a Block linked to the same Spare Pool as a Block in a Subdiagram. |
| Diagram cannot be calculated: A Spare Pool cannot be referenced across multiple Diagrams. | RBD contains Blocks linked to the same Spare Pool in multiple Subdiagrams. |
| Diagram cannot be calculated: Blocks in Cold Standby Subdiagrams cannot be linked to Spare Pools. | RBD contains a Cold Standby Branch with a Subdiagram that contains a Block linked to a Spare Pool. |
| Diagram cannot be calculated: Blocks in Cold Standby Subdiagrams cannot be linked to Spare Pools. | RBD contains a Cold Standby Redundant Block with a Subdiagram that contains a Block linked to a Spare Pool. |
| Diagram cannot be calculated: A Block linked to Prediction has missing repair data. | RBD contains a Block linked to a Subsystem/Part without a Mean Time to Repair (MTTR) value in Prediction. |
| Diagram cannot be calculated: A Block linked to Maintainability has missing data. | RBD contains a Block without a selected Maintenance Level. |
| Diagram cannot be calculated: A Block linked to Maintainability has missing data. | RBD contains a Block linked to a Subsystem/Part without Mean Time to Repair (MTTR) calculated in Maintainability. |
| Diagram cannot be calculated: A Block is linked to a missing Subsystem or Weibull Data Set. | RBD contains a Block linked to a missing Subsystem or Weibull Data Set. |
| Diagram cannot be calculated: A Block linked to a Weibull Life Data Set has missing data. | RBD contains a Block linked to a Weibull Life Data Set without any results. |
| Diagram cannot be calculated: A Block linked to Prediction has missing repair data. | RBD contains a Block with a Prediction repair link, but the Mean Time to Repair (MTTR) field has not been assigned. Assign the MTTR field in the Analysis Properties by going to View All > Edit > Data Fields. |
Please note these limitations when building your block diagrams. Informational messages in red font may also appear in the Properties pane as a first indication that you've constructed a block diagram for which calculations cannot be completed.
In addition to the Time-Based Metrics, Steady State Metrics, Sparing and Cost Metrics, Path Sets and Cut Sets, which can be calculated on the Calculate RBD dialog, Relyence RBD also supports Allocation calculations (Performing Allocations) and Optimal Replacement calculations (Performing Optimal Replacement). Spares can also be optimized as described in Creating and Using Spare Pools.