Using Failure Direct Connect in FRACAS
If you are new to Failure Direct Connect, it may be helpful to review the Getting Started with Relyence Failure Direct Connect tutorial.
To use Failure Direct Connect in FRACAS, you must have the Failure Data widget on your FRACAS Incident Forms or Table. For details on adding Failure Direct Connect to FRACAS, see the Customizing Failure Direct Connect.
Accessing the Failure Data widget
The Failure Data widget is the control that enables Relyence Failure Direct Connect to Relyence FRACAS and FMEA. The Failure Data widget is used to enter failure information while recording an Incident that is connected to data in your FMEA Worksheet. The objective of Relyence Failure Direct Connect is control and management of your failure information in an integrated manner within your FMEA and FRACAS processes.
The Failure Data widget may appear on your Incident Forms or Incident Table or both depending on how it has been customized for your organization. Also, the Failure Data widget name, or title, as well as the data fields that comprise the widget are all customizable.
Usage of the Failure Data widget is the same whether accessed via an Incident Form or the Incident Table.
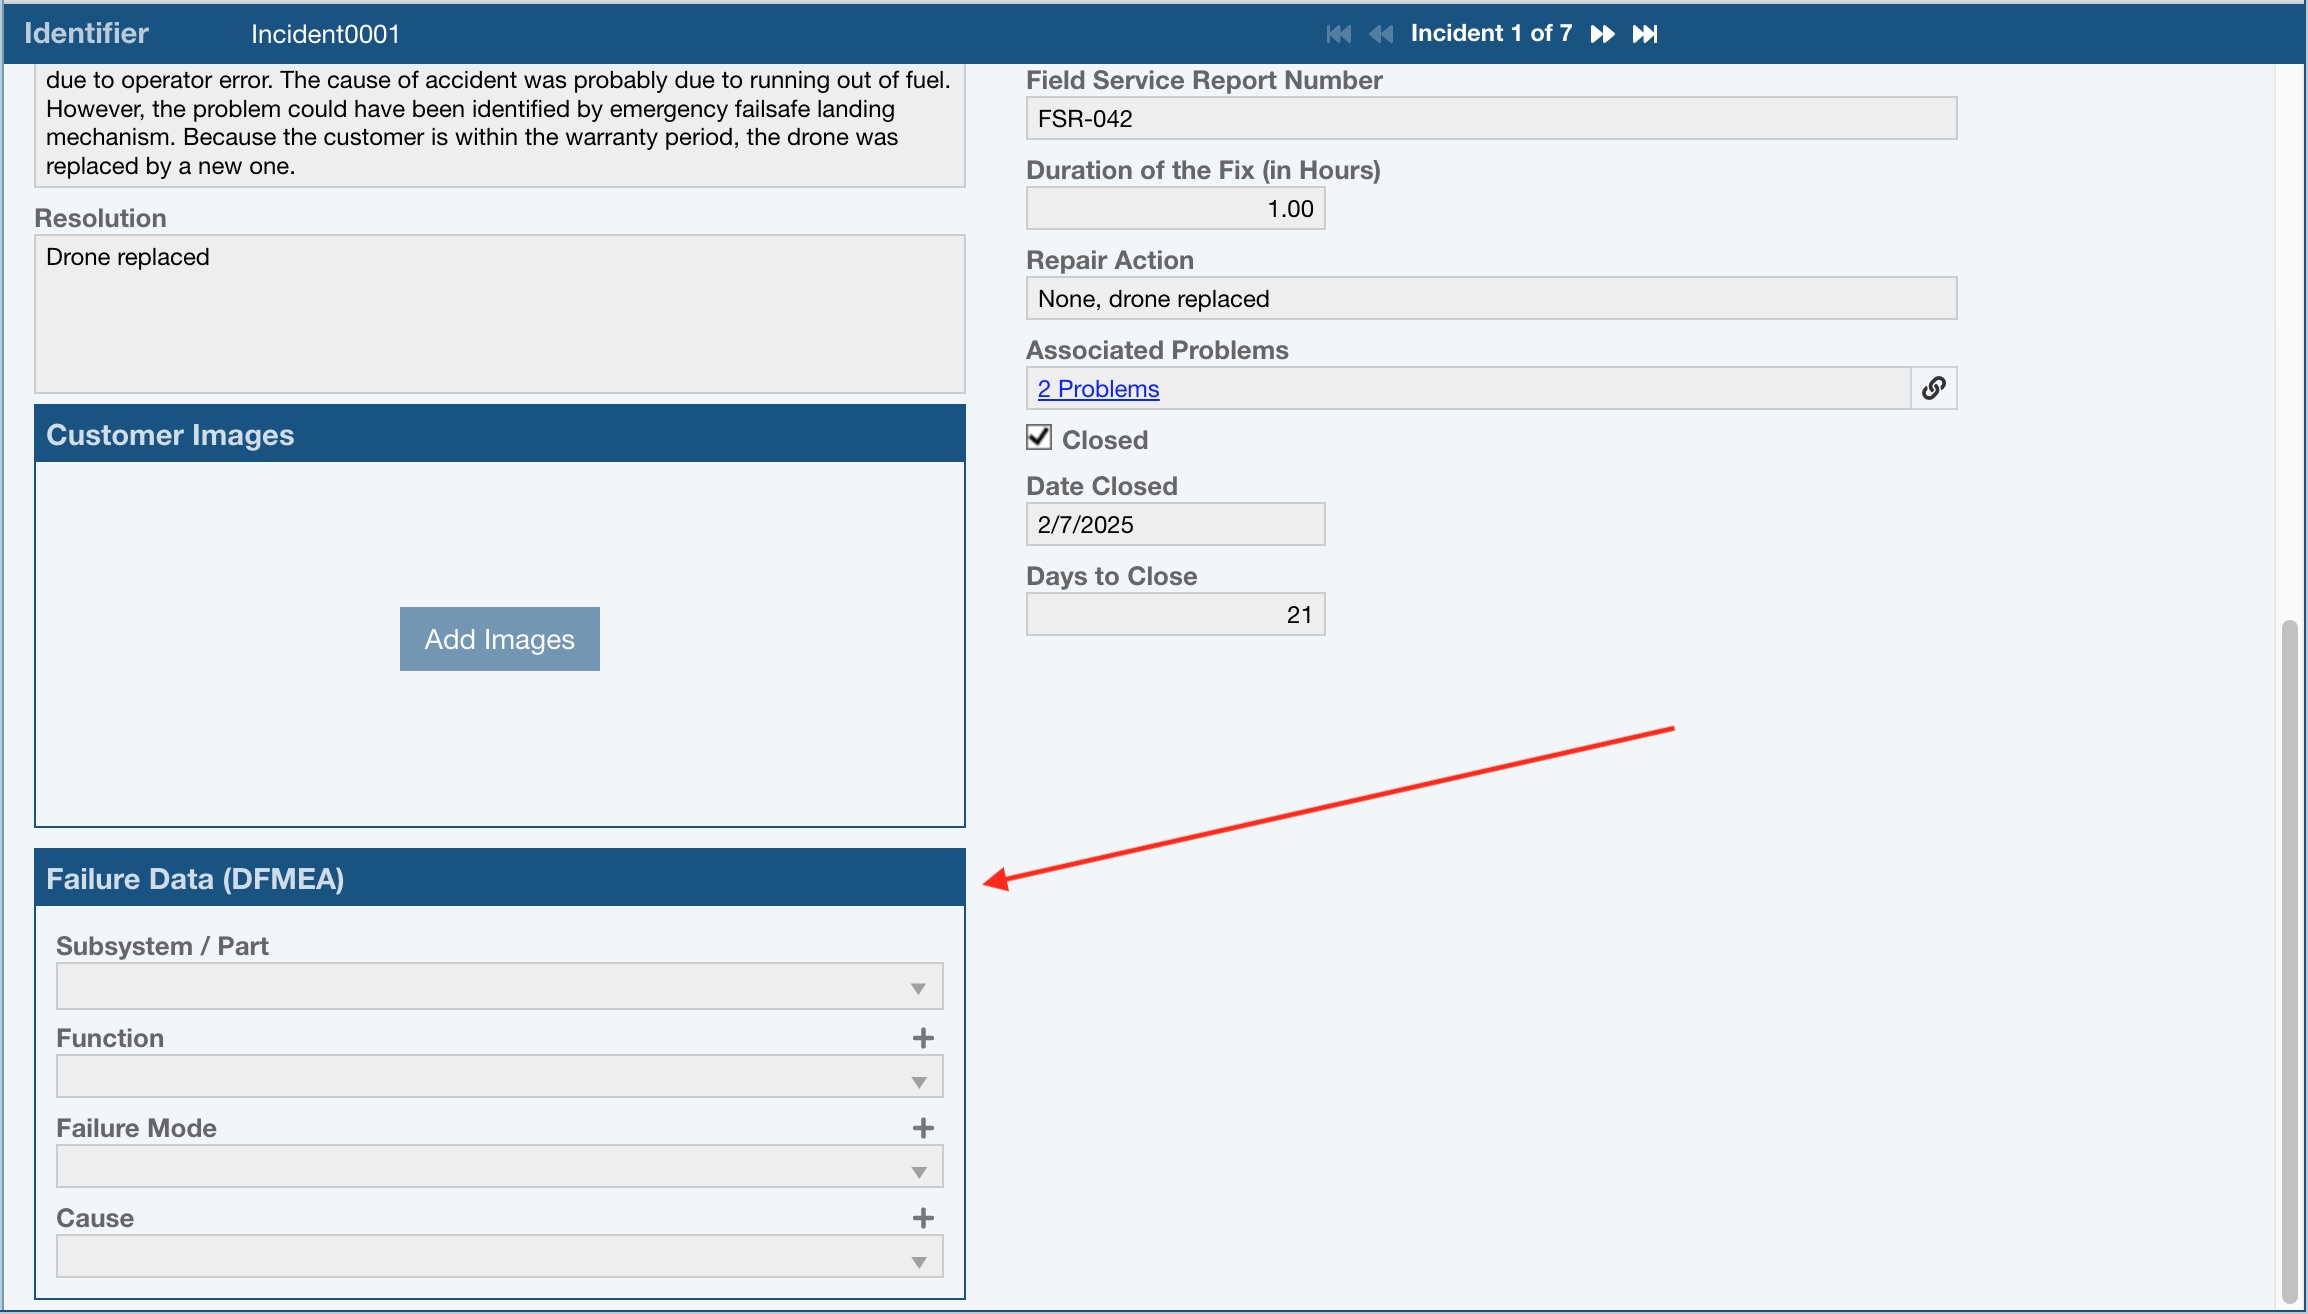
If on an Incident Form, the Failure Data widget appears as a titled Group Box on your Form. An example is shown below.
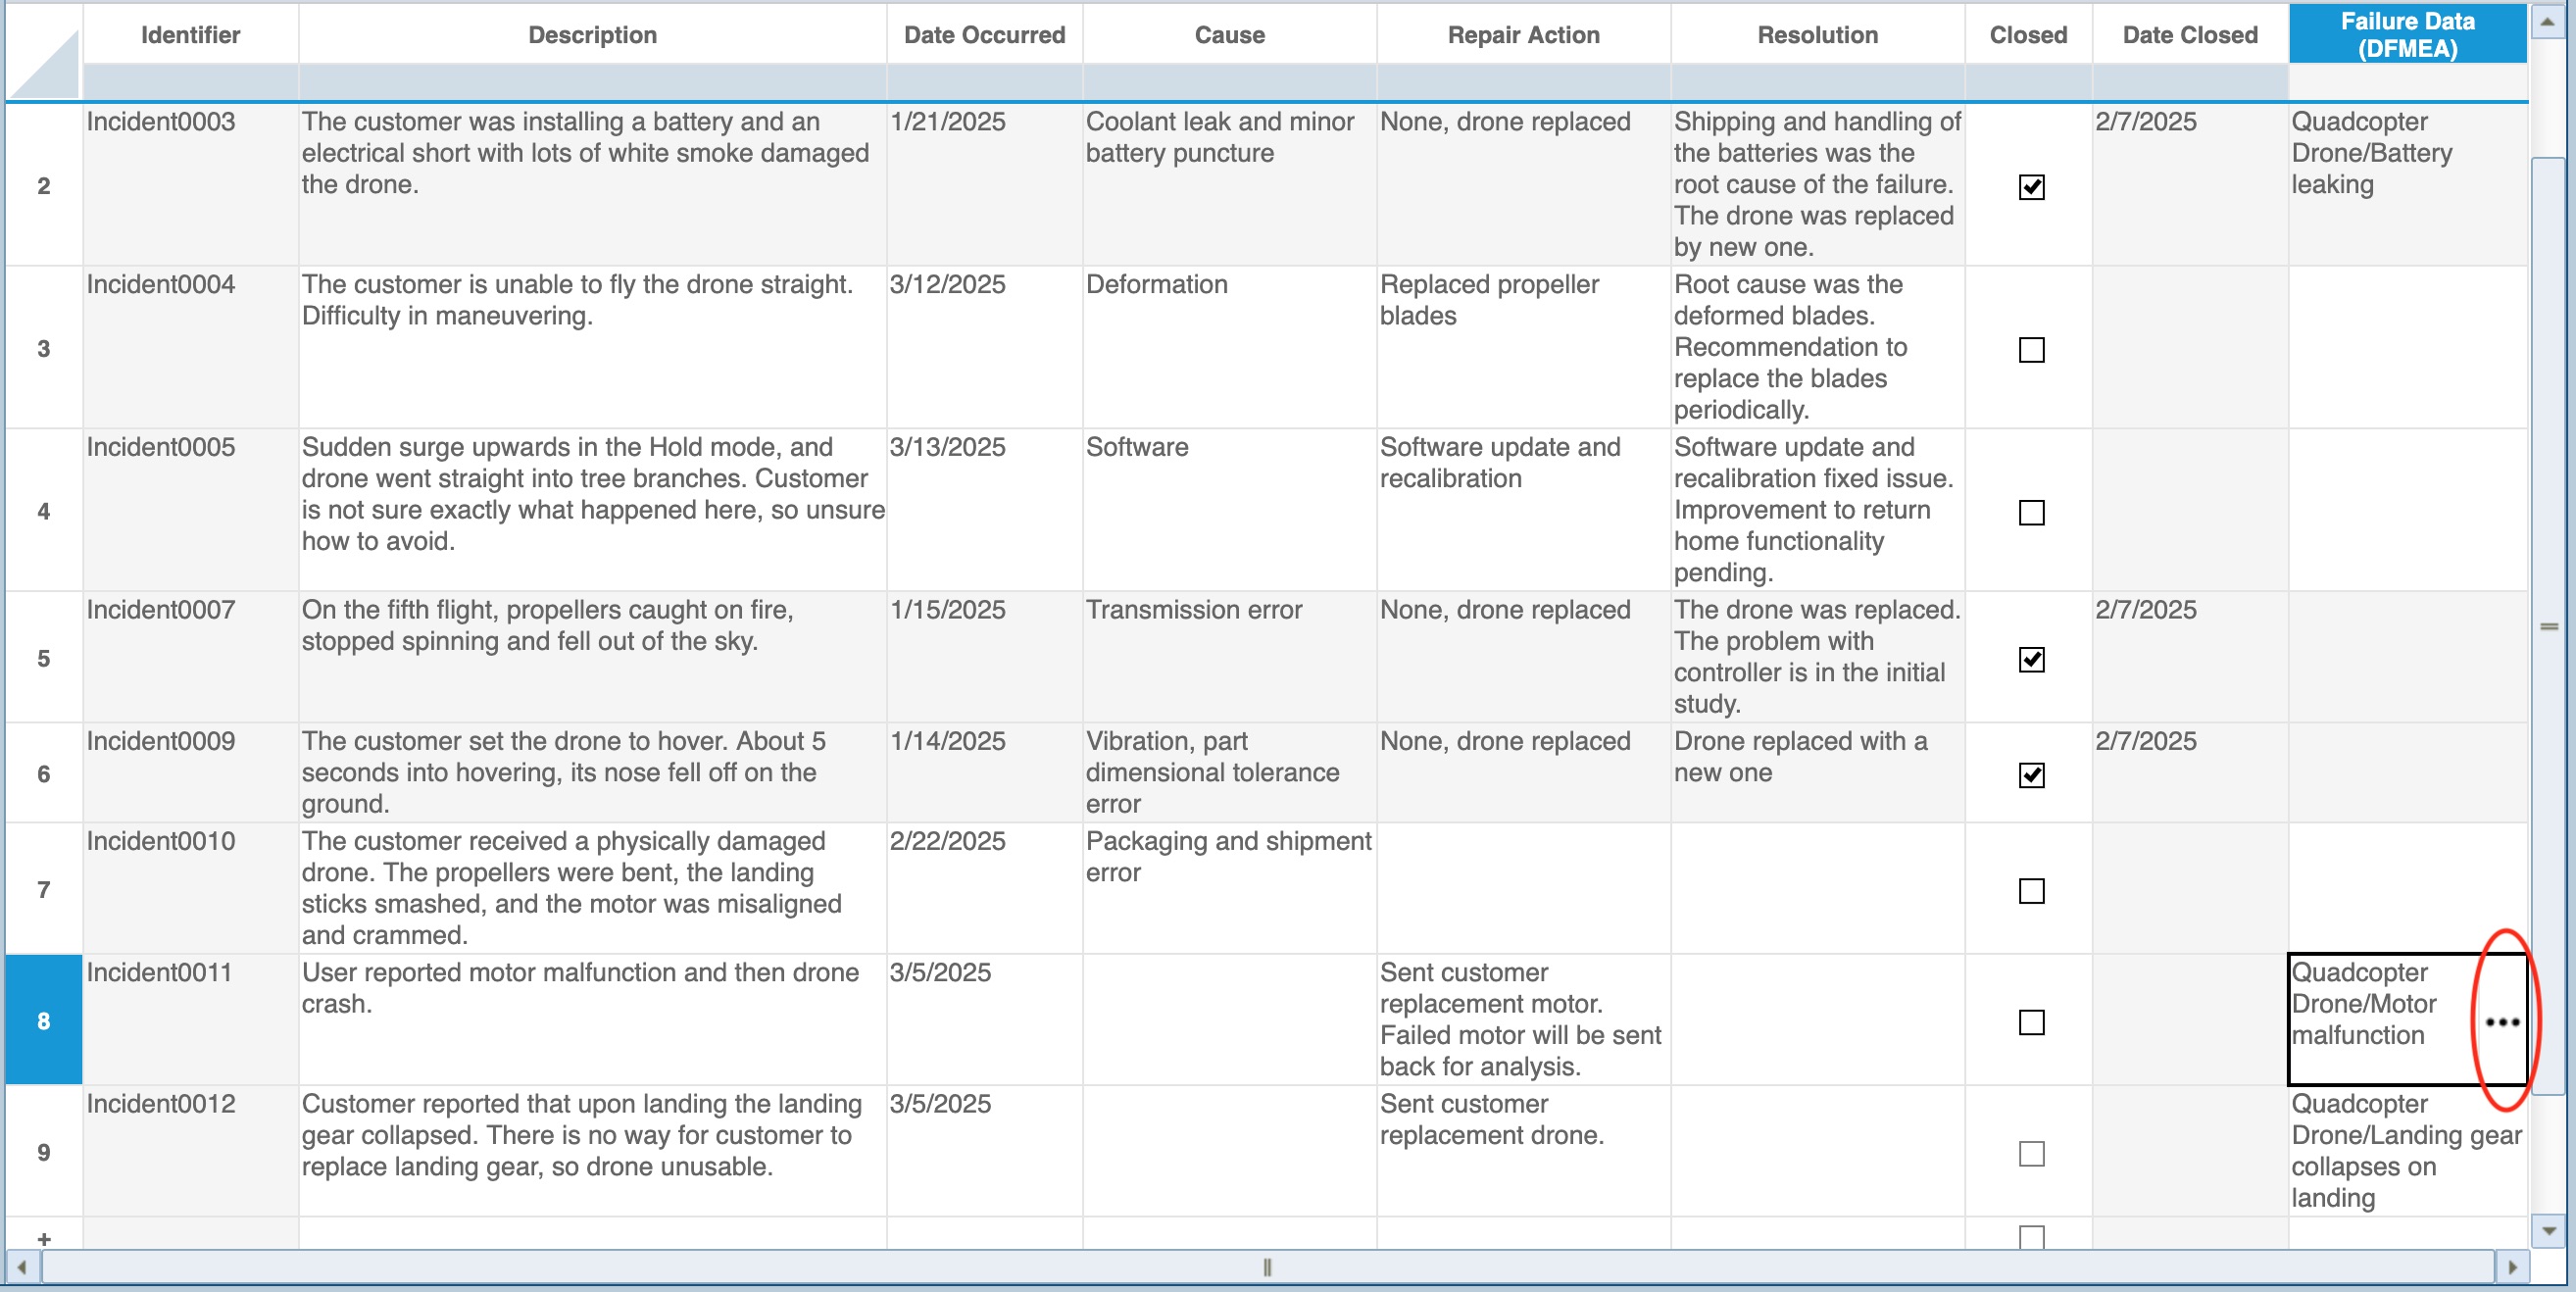
If present on the Incident Table, the Failure Data widget appears as a column in the Table. To access the Failure Data widget for an Incident in the Incident Table, click the Expand [...] button in the Failure Data widget column.
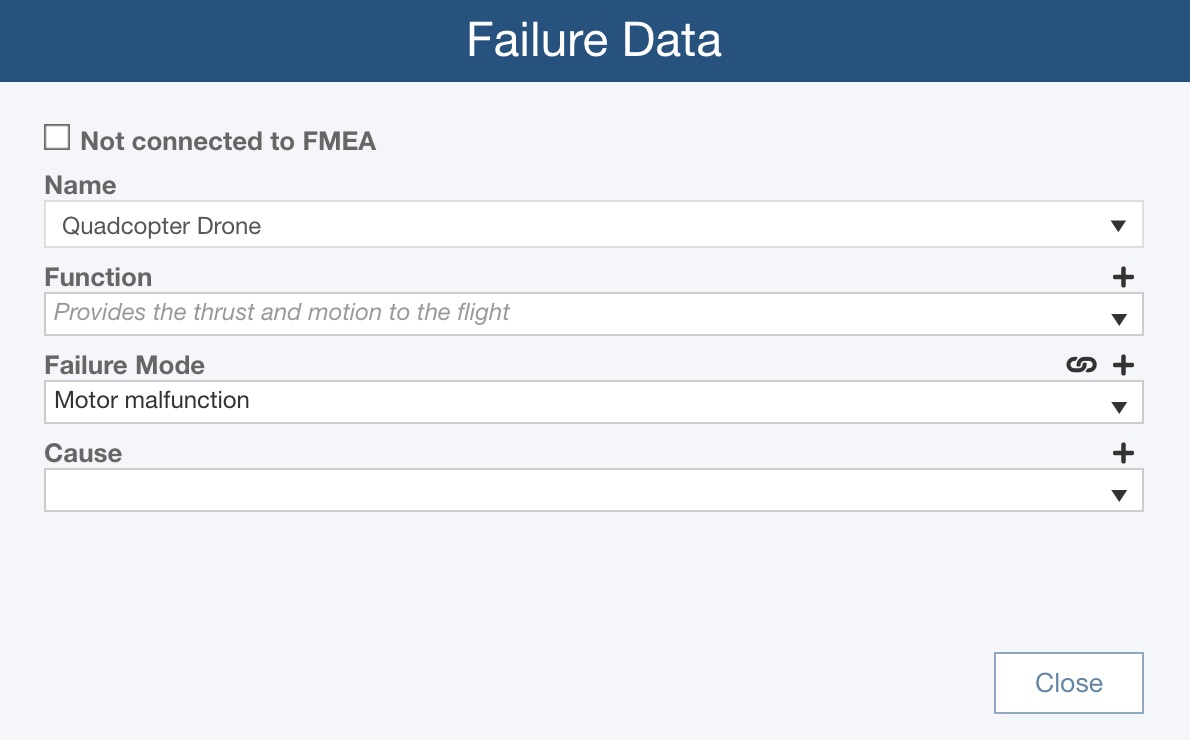
The Failure Data dialog appears. Usage of the Failure Data widget is the same in either case.
Note that the labels for the Failure Direct Connect data fields will follow any customization you made to your FMEA. So, for example, if you relabeled the Cause data field to Failure Cause, Failure Cause will appear in the Failure Direct Connect widget.
Adding new Incidents and connecting to FMEA data
When a new Incident is added, the Failure Data widget is used to enter failure information pertaining the the reported issue. Depending on how you have configured the Failure Data widget, it may contain a variety of fields. For this example, we will assume the Failure Data widget includes the Subsystem Name, and the Function, Failure Mode, and Cause data fields from the FMEA Worksheet.
The Name choice list shows Subsystem records from the Analysis Tree. If you have the Filter>By Subsystem option selected in the FRACAS toolbar, the Name data field will be automatically populated with the Subsystem selected.
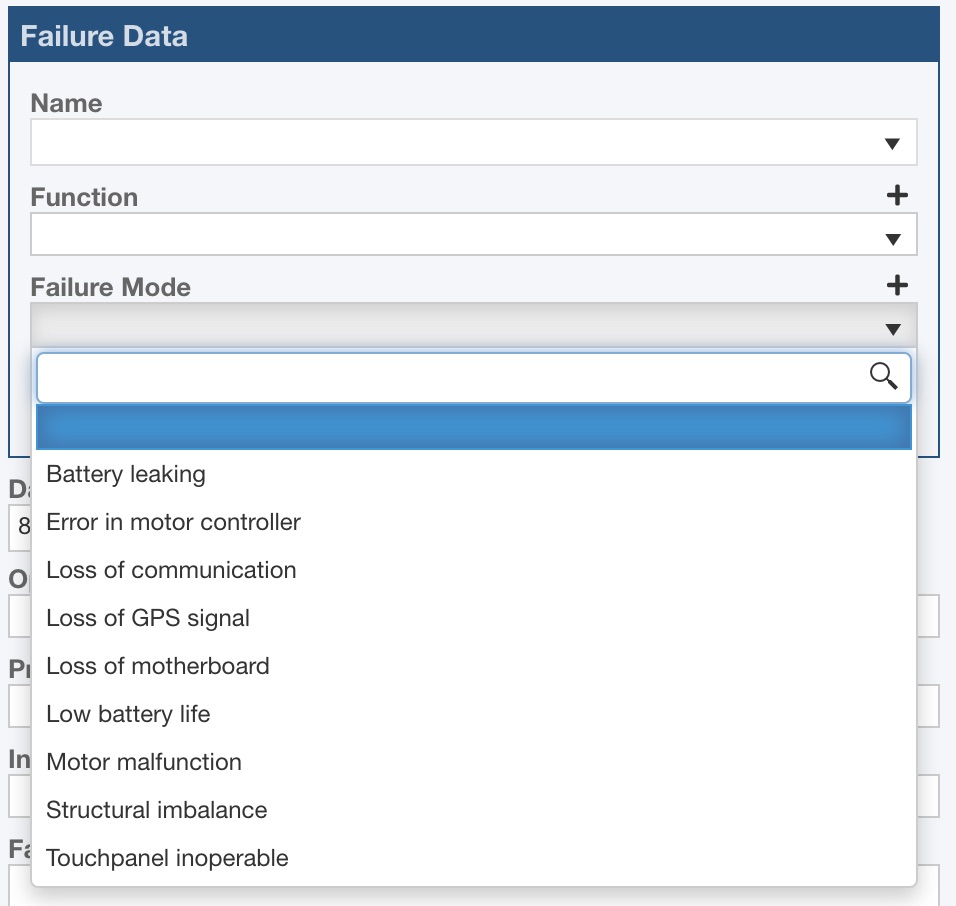
Click any of the other dropdown list arrows to display a list of possible choices for the data fields such as Function or Failure Mode. These fields are populated with data from the FMEA Worksheet.
As you make a selection from one of the lists, the lists below are automatically filtered to display only the appropriate selections. For example, if you make a selection from the Function list, the Failure Mode list will be filtered to only show the list of Failure Modes that are associated with the selected Function.
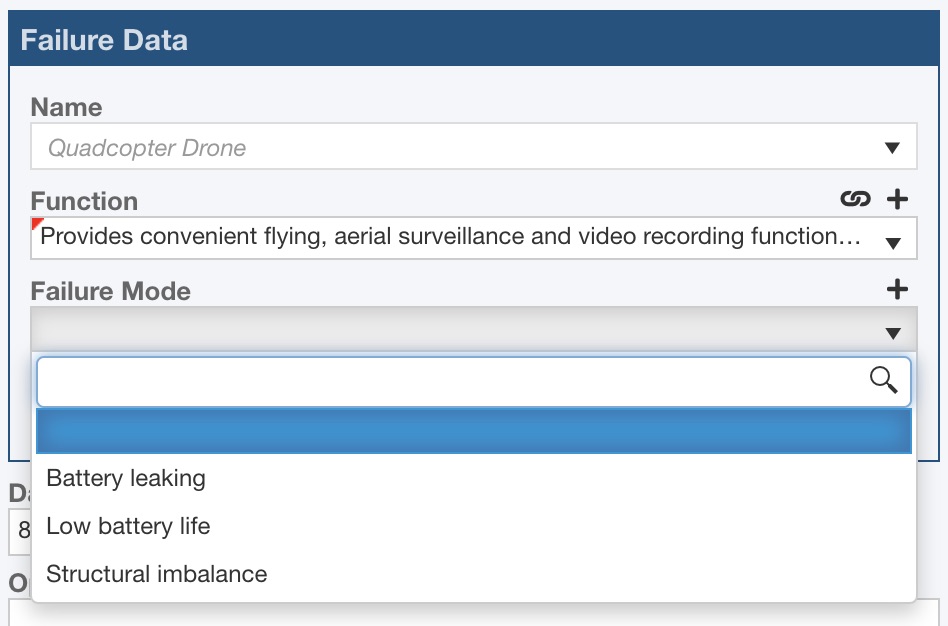
However, if you just want to review the complete unfiltered list, do not enter any of the upper level information. So, for example, if you dropdown the list for Failure Mode without selecting a Name or Function first, you will see the list of all Failure Modes from the FMEA.
Once you make a choice, your selection will be shown and the link icon will appear by the data field to indicate that the connection to FMEA has been made.
Once you have selected lower level data, Relyence will automatically fill in the upper level fields appropriately based on the FMEA data. This information will appeared in a watermarked (italicized and lighter color) format to indicate it was populated for you.
To remove any entries, simply go back and drop down the list of choices and select the [No selection] or blank entry at the top of the list. The data in the field will be cleared.
Adding new Incidents that cannot be connected to FMEA data
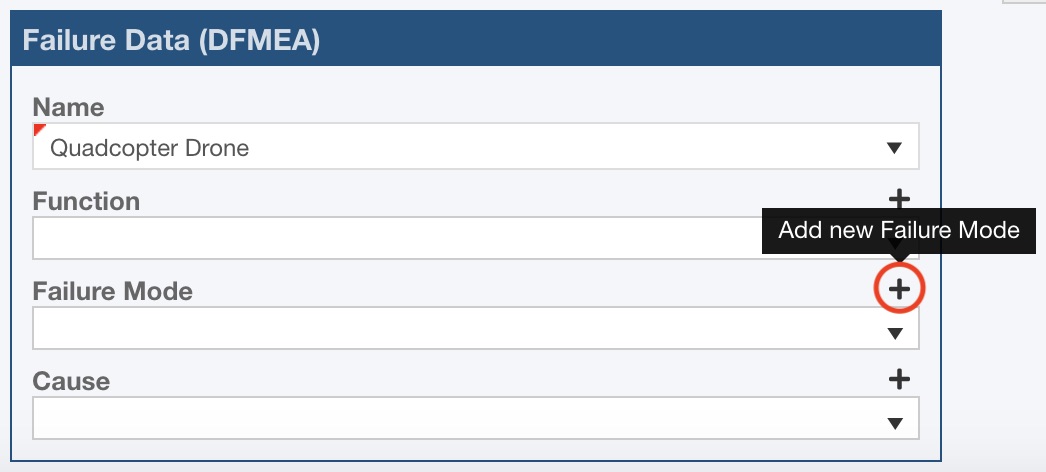
In some cases, you may not be able to find any failure information from the lists in the Failure Data widget that apply to a newly recorded Incident. In this case, you can add in the new failure information, and this data will be retrievable by the FMEA team for review.
To add new failure information, click the '+' button next to the appropriate data field. For example, to add a new Failure Mode, click the '+' button next to the Failure Mode label (the Add new Failure Mode tooltip will appear when hovering over the '+' button).
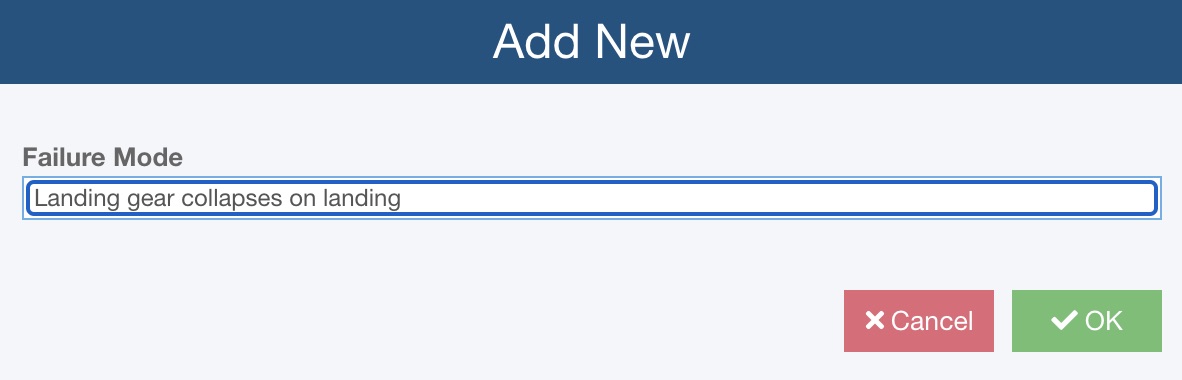
The Add New dialog appears. Enter the new data and click OK.
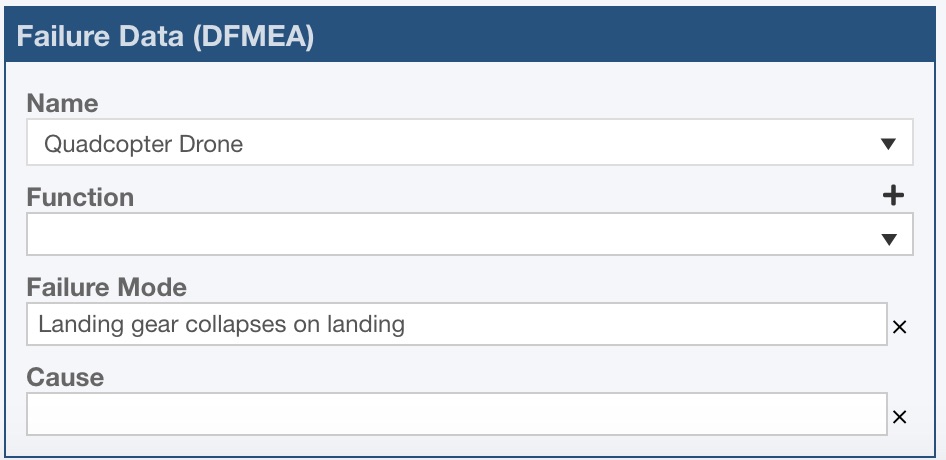
The new Failure Mode is logged. Notice that there is no link icon in this case.
Also, notice the 'x' icon next to the Failure Mode field that now appears. If you decide you want to delete the newly entered Failure Mode, you can use the 'x' button to remove it.
Adding new Incidents disconnected from FMEA
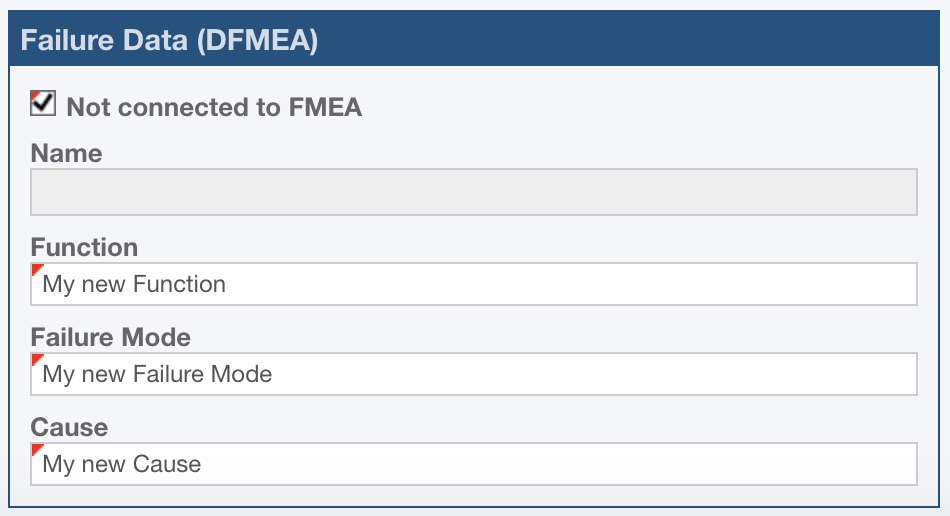
You can customize the Failure Data widget to optionally allow the entry of disconnected data. In this case, you can enter any text into the data fields in the Failure Data widget. The information will not be relayed to and is not reviewable by the FMEA team. The data is stored only in FRACAS.
To enter completely disconnected data, select the Not connected to FMEA checkbox and enter your failure information.
Review the Customizing Failure Direct Connect for details on how to allow disconnected data entry.