Getting Started with Relyence Failure Direct Connect
If you would like to review a video overview of this Getting Started Guide, go to our online videos for Relyence Failure Direct Connect.
1. Sign in to Relyence
To begin, make sure you are signed in to Relyence. For details on signing in, see Signing in and Signing out.
You must have a Relyence account to sign in to Relyence. If you do not yet have a Relyence account, you can register for one for free.
You may possibly see the Announcements dialog when first signing into Relyence. The Announcements automatically scroll, or you can review them using the previous and next arrow keys. For any Announcements you do not wish to see again, select the Don't show me this again checkbox. Once you have reviewed all the Announcements, click the 'x' (Close) button in the upper right corner of the Announcements dialog.
2. Review Relyence FRACAS and Relyence FMEA
In this tutorial, it is assumed that you are familiar with the operation of both Relyence FRACAS and Relyence FMEA. If you are new to these products, or need a refresher, please review the Getting Started with Relyence FRACAS and the Getting Started with Relyence FMEA tutorials before proceeding.
3. Open the Example Analysis
To begin, let's make sure Relyence FRACAS is active.
After you have signed in, you may see a Welcome dialog. If a Welcome dialog does not appear, click Welcome to Relyence from the Help dropdown menu in the upper right of the Relyence header bar.
If you were previously working on an Analysis, you will see the Continue Where I Left Off option at the top of this dialog, otherwise it will not appear. If you are using a Trial version, the Show this page when Relyence opens option will not appear. This option is only available using a licensed version of Relyence.
Click the FRACAS tab on the left to activate Relyence FRACAS. Then click Open Example Analysis.
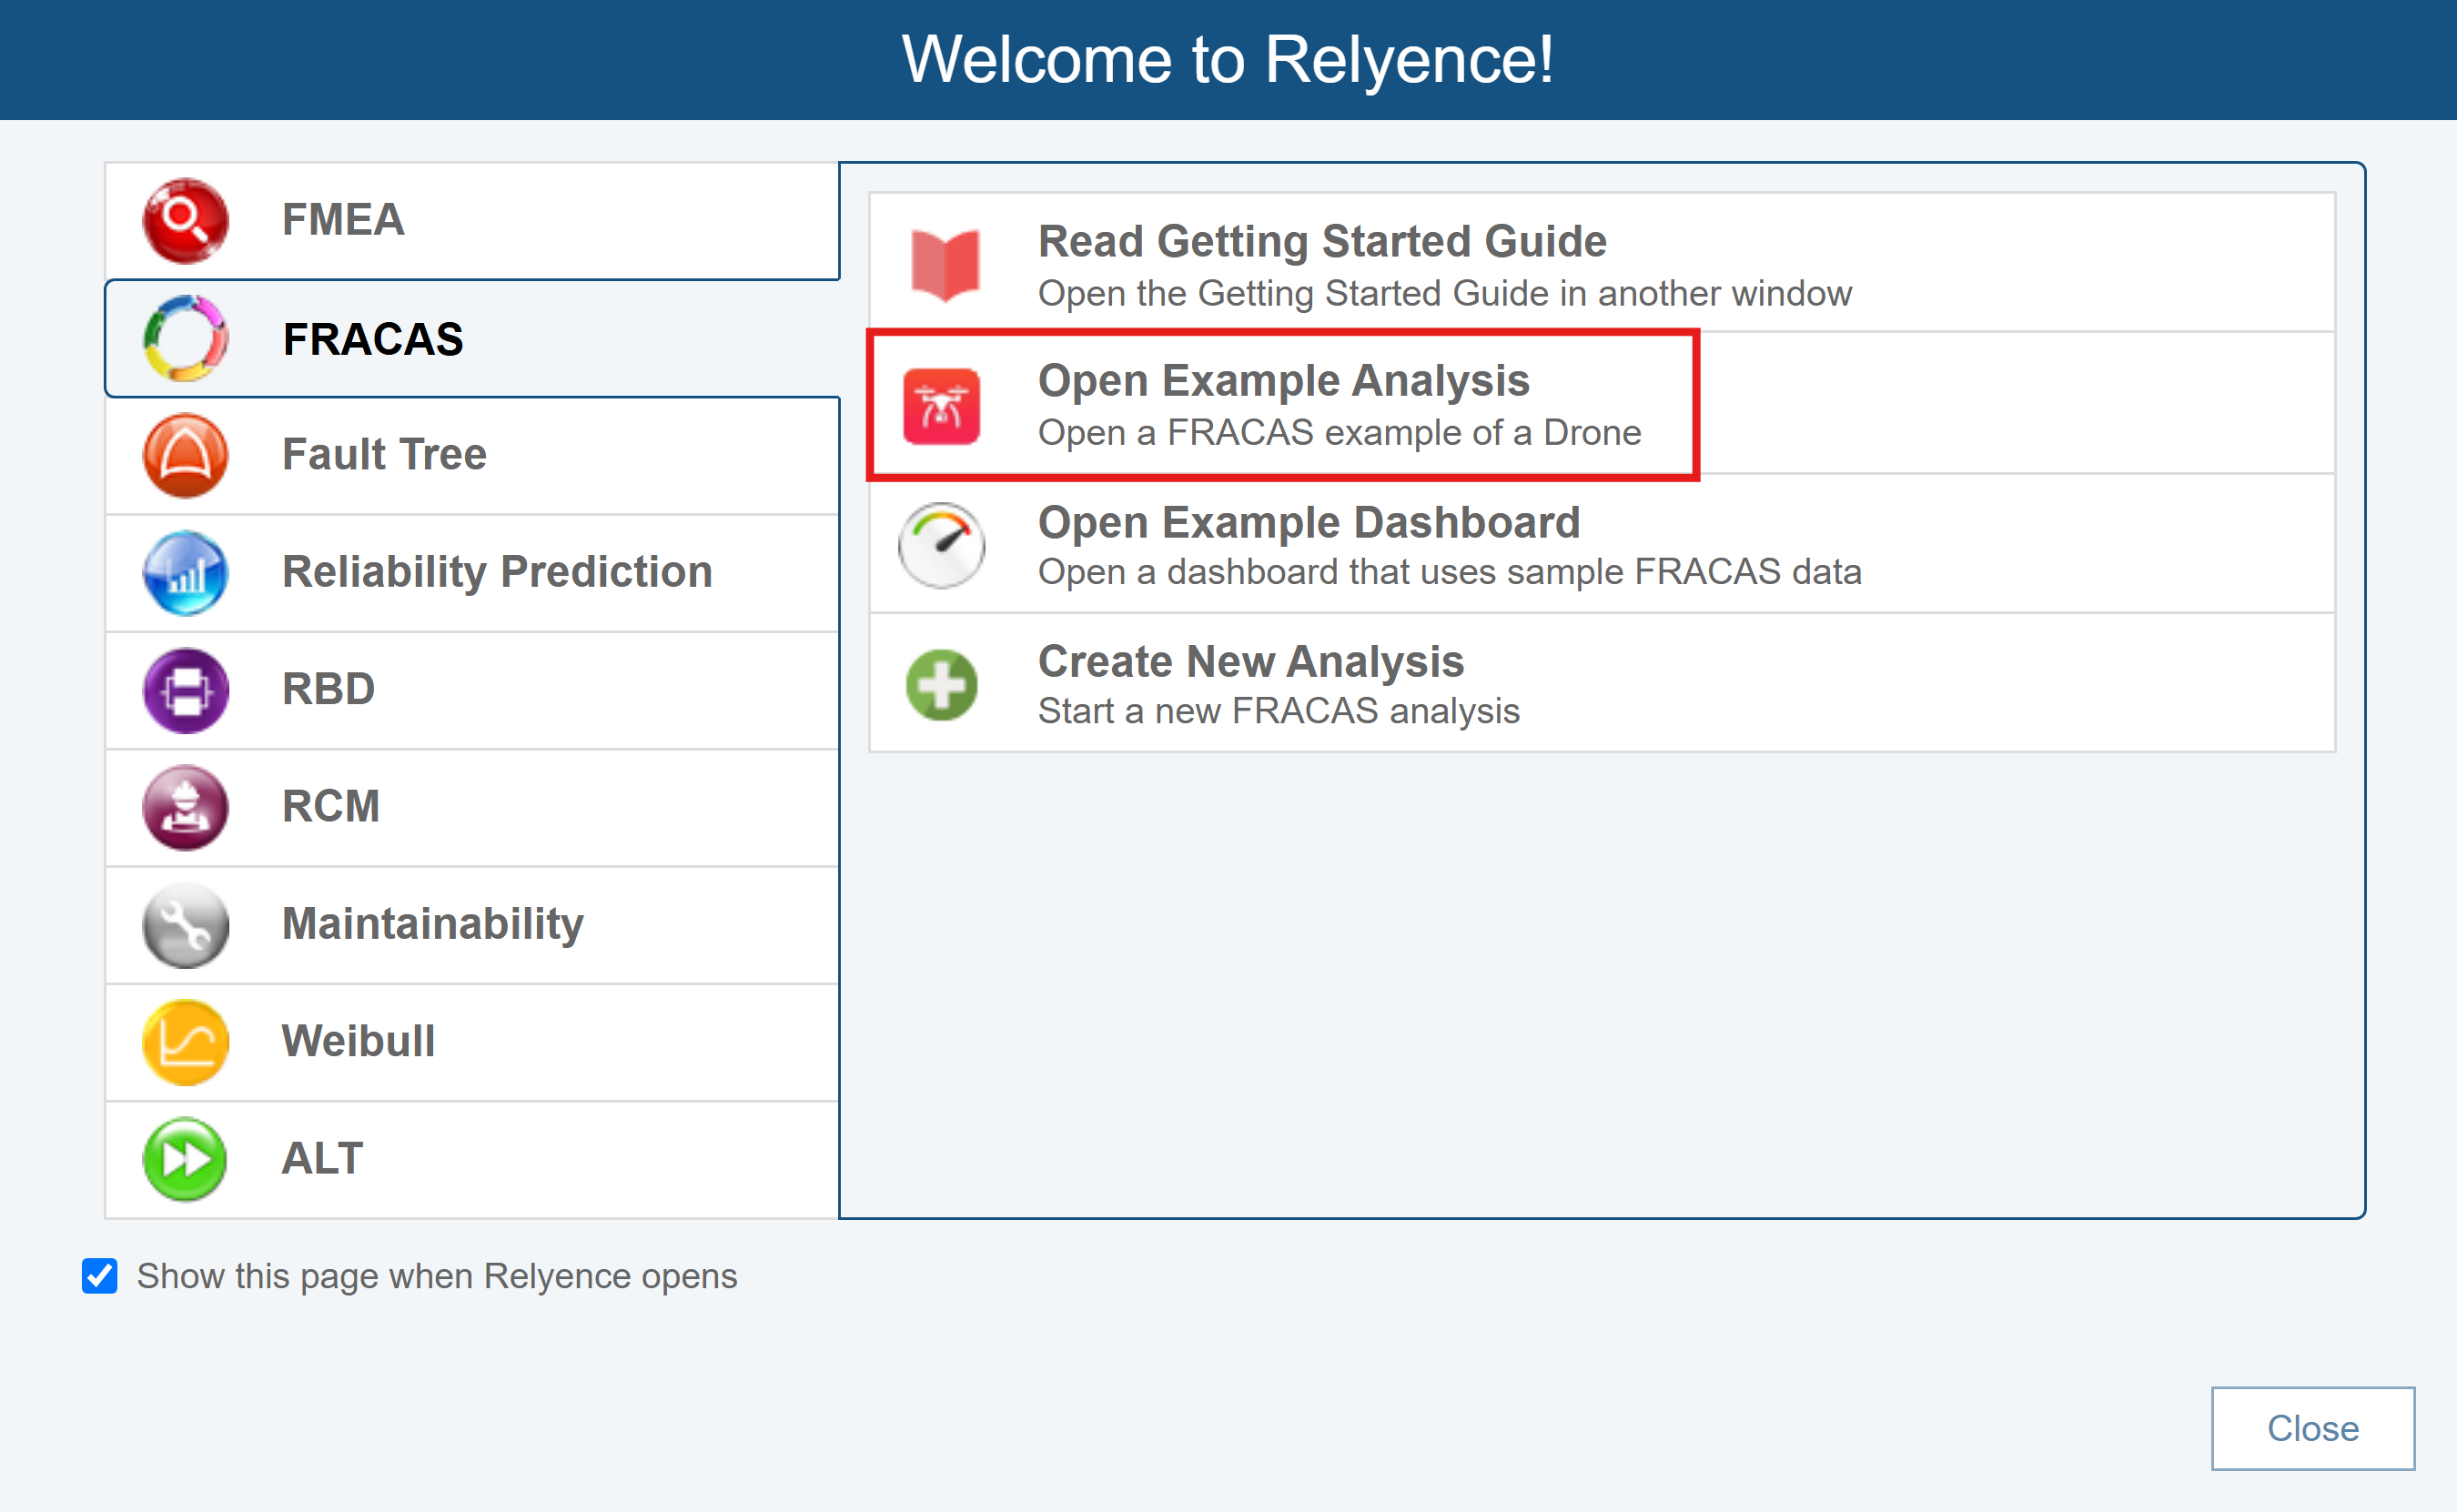
The Drone Example Analysis opens.
For this tutorial, we will use the supplied Drone Example Analysis.
When you open an Example for the first time, you will see the Revert Example pop up appear. You are free to make changes and save your changes to the Example Analyses. If you want to revert to the original Example at any time, click Revert Example. You will get a message asking if you are sure before your changes are discarded. Click Got it! to dismiss the pop up.
For this tutorial, we assume an unmodified original Example is being used. If you are not sure if you are using an unmodified version of the Example, click Revert Example from the Sidebar. You will be asked if you want to lose your changes and reopen the Example in its original version. Click Yes. If needed, click Got it! to dismiss the pop up.
If you continue with a modified version, just be aware that screen shots or other functions may not operate exactly as described in this tutorial.
When complete, your Drone Example with its data will appear in the main window.
4. Add the Failure Data widget to the Incident Form
Note: You can change the default terms "Incidents" and "Problems" used in Relyence FRACAS. Therefore, you may see your or your organization's preferred terms instead of "Incidents" and "Problems" in the software. For ease of understanding, the default terms of Incidents and Problems will be used throughout this documentation. For details on customizing these terms see the Relyence FRACAS Settings topic.
It is important to note that FRACAS processes are typically very unique to each organization. Relyence FRACAS is completely customizable for your use, and this tutorial is meant to show an example setup. This tutorial will not cover how to customize the Relyence FRACAS interface to meet your needs. To find information on customizing Relyence FRACAS, please review Customizing the FRACAS Interface. Also, our implementation team can help you in customizing the Relyence FRACAS interface to meet your needs. We can also aid in defining your process, or establishing a new FRACAS. Feel free to contact us for details.
If the Incident Table is not in view, click Incidents in the Sidebar menu under the FRACAS heading.
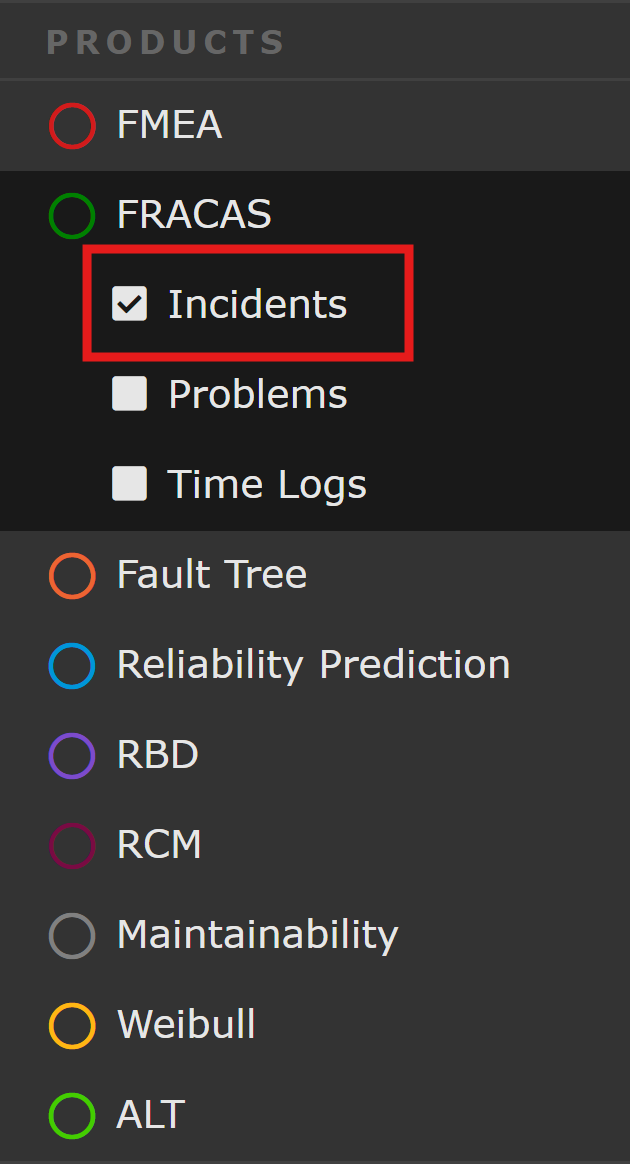
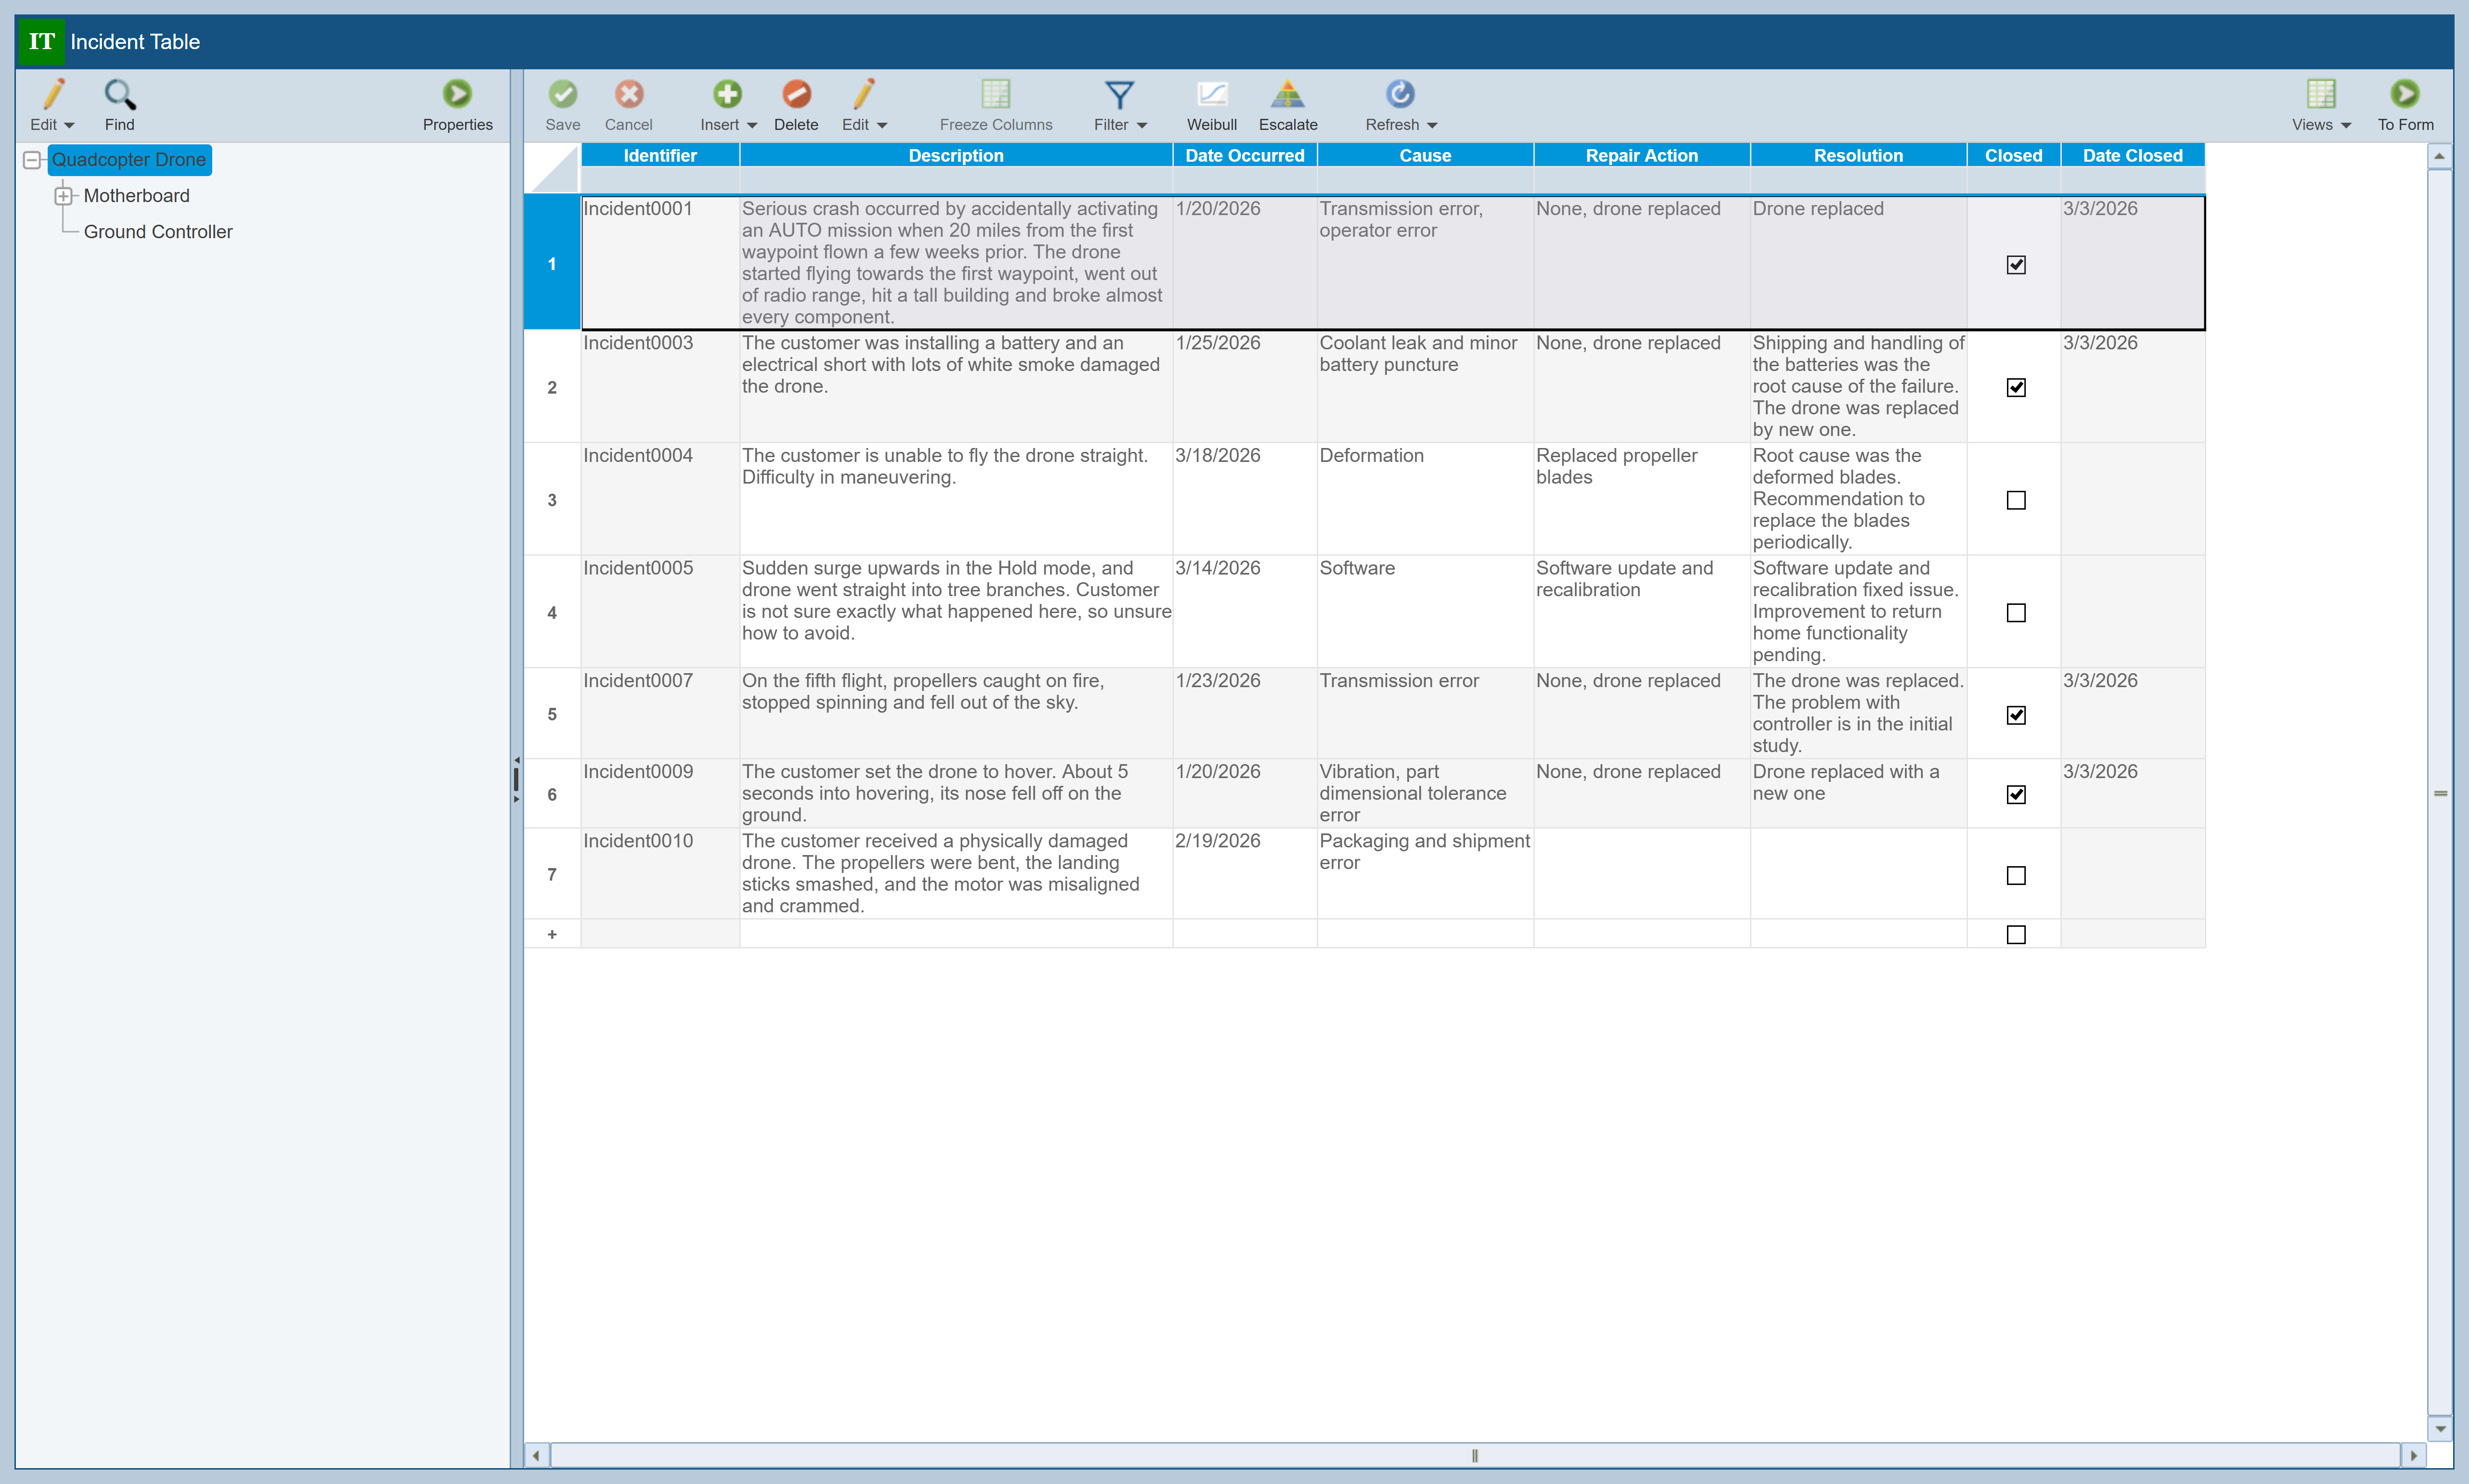
The Incident Table displays a list of all the Incidents logged to date associated with the item selected in the Analysis Tree. In this case, the Incidents associated with the Quadcopter Drone are displayed.
In our Example, Failure Direct Connect is not enabled. So, our first step is to set up Relyence FRACAS to allow usage of this feature. To do this, we need to add the Failure Data widget to the Incident Form. Note that the Failure Data widget can also be added to the Incident Table for use. For this tutorial, we are adding it to the Incident Form just for ease of viewing.
Make sure Incident001 in the Quadcopter Drone Analysis Tree item is selected in the Incident Table, and then click the To Form button in the toolbar.
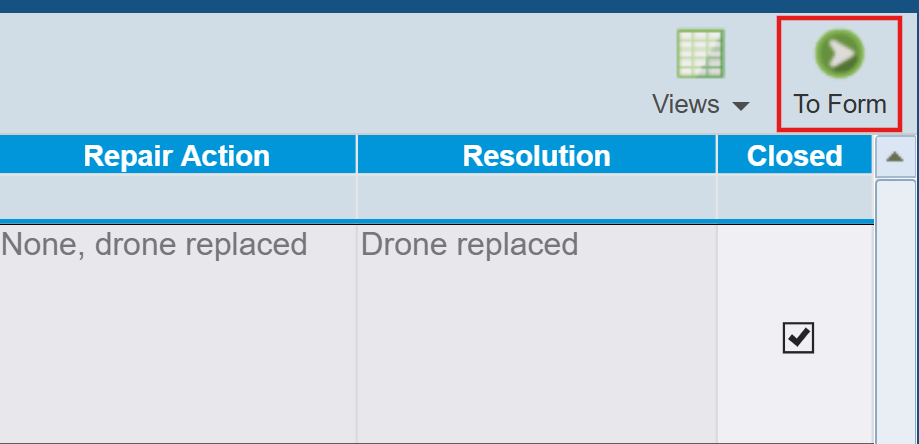
The Incident Form appears. Click the Customize button in the upper right of the toolbar.
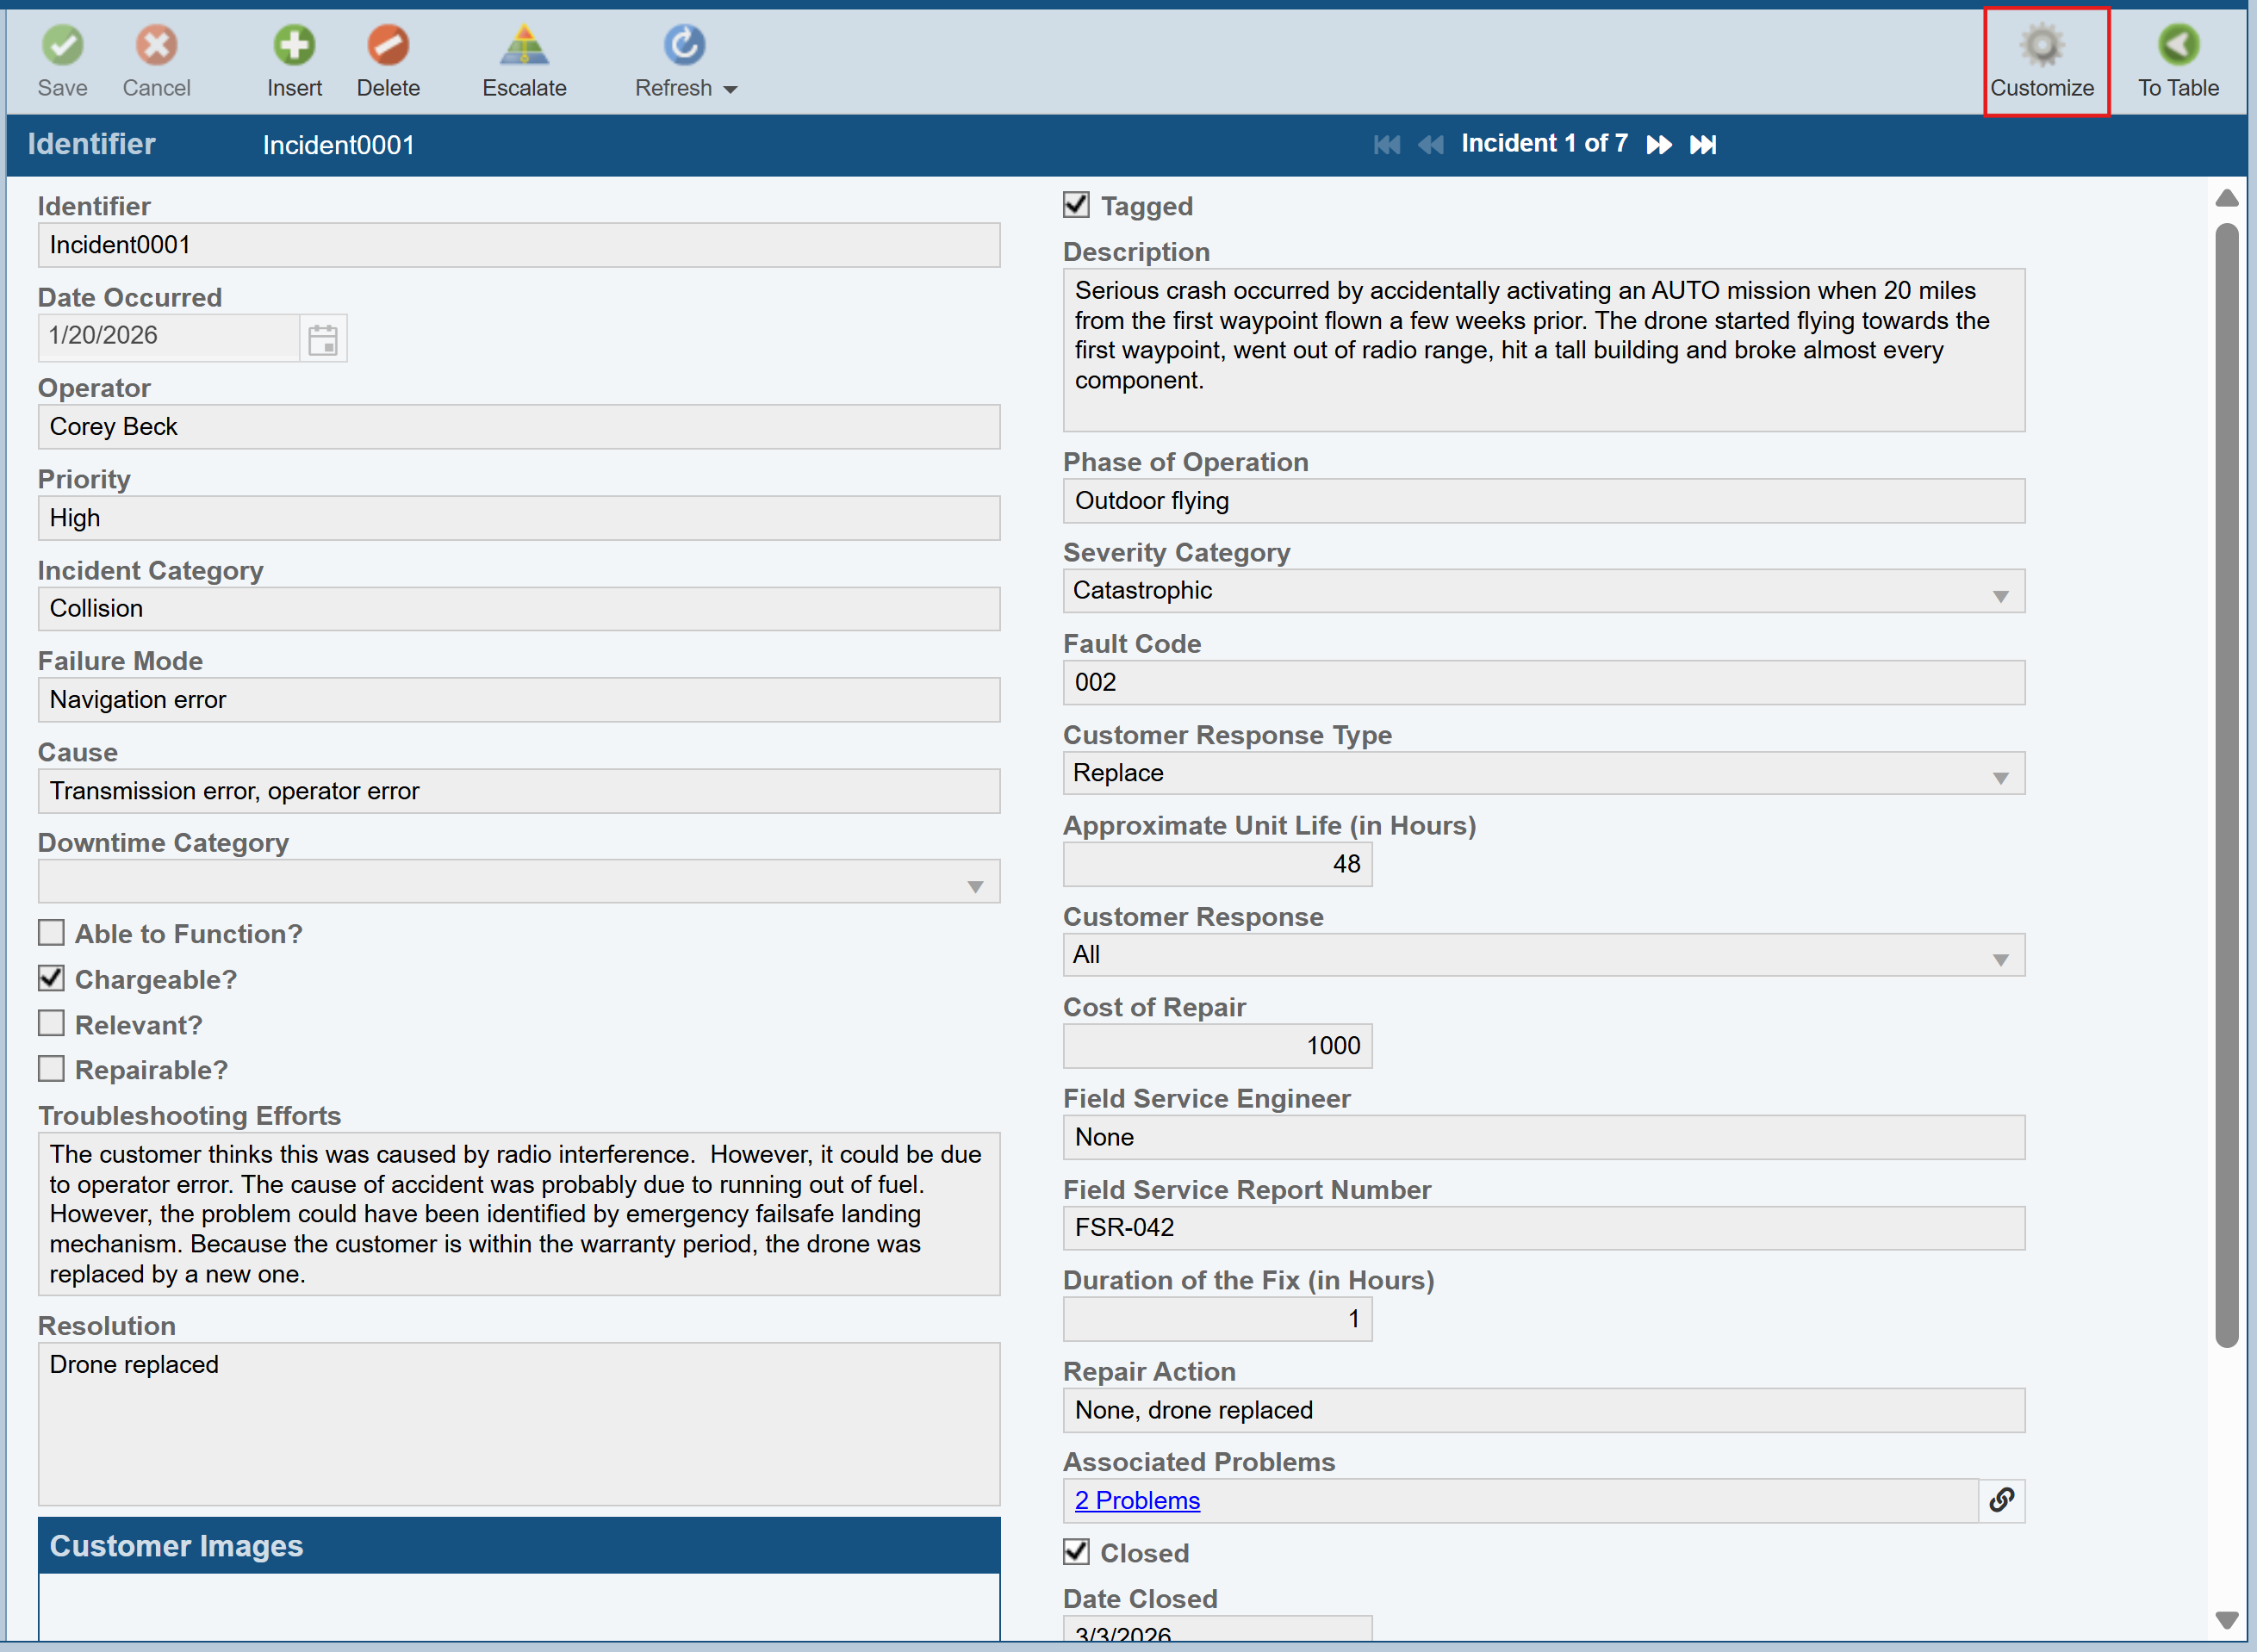
The Customizing Incident Form window appears.
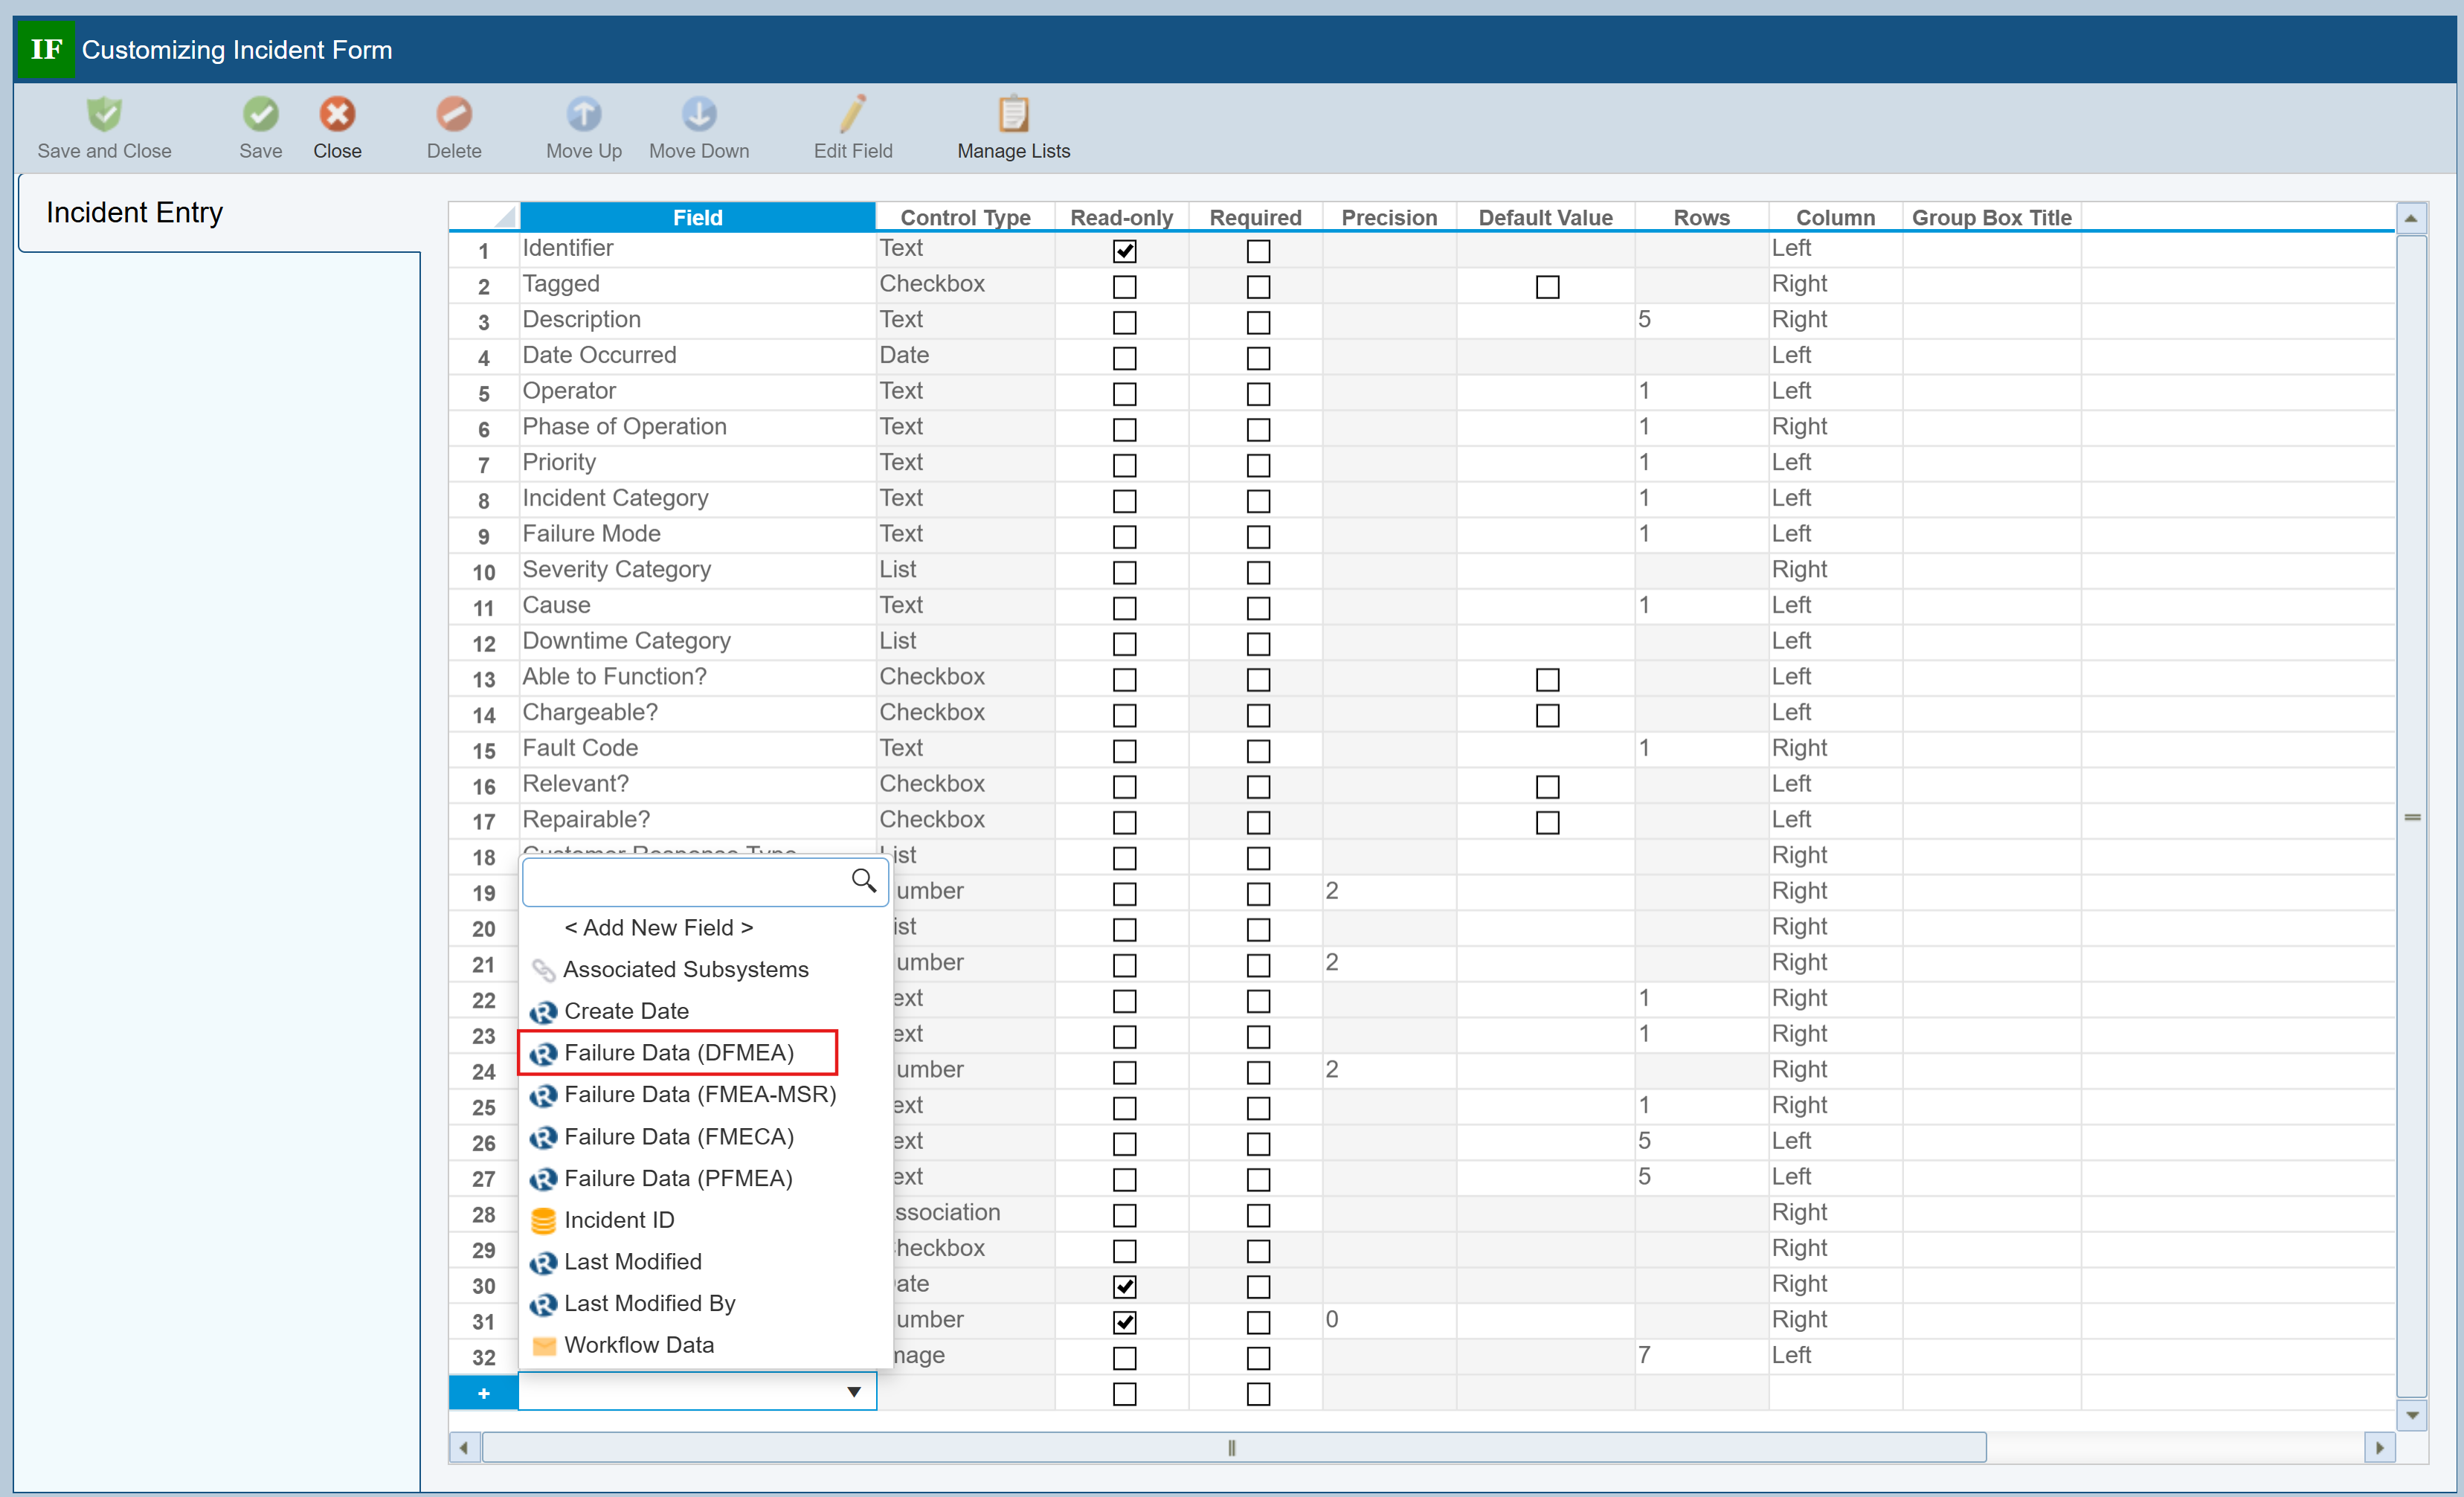
Click in the last row of the Table to bring up the Field list and select Failure Data (DFMEA) to add it to the Form. Note that you can add the Failure Data widget for any FMEA type you use, such as DFMEA, FMECA, etc. In this Example, we are using DFMEA, so we will select the Failure Data (DFMEA) widget.
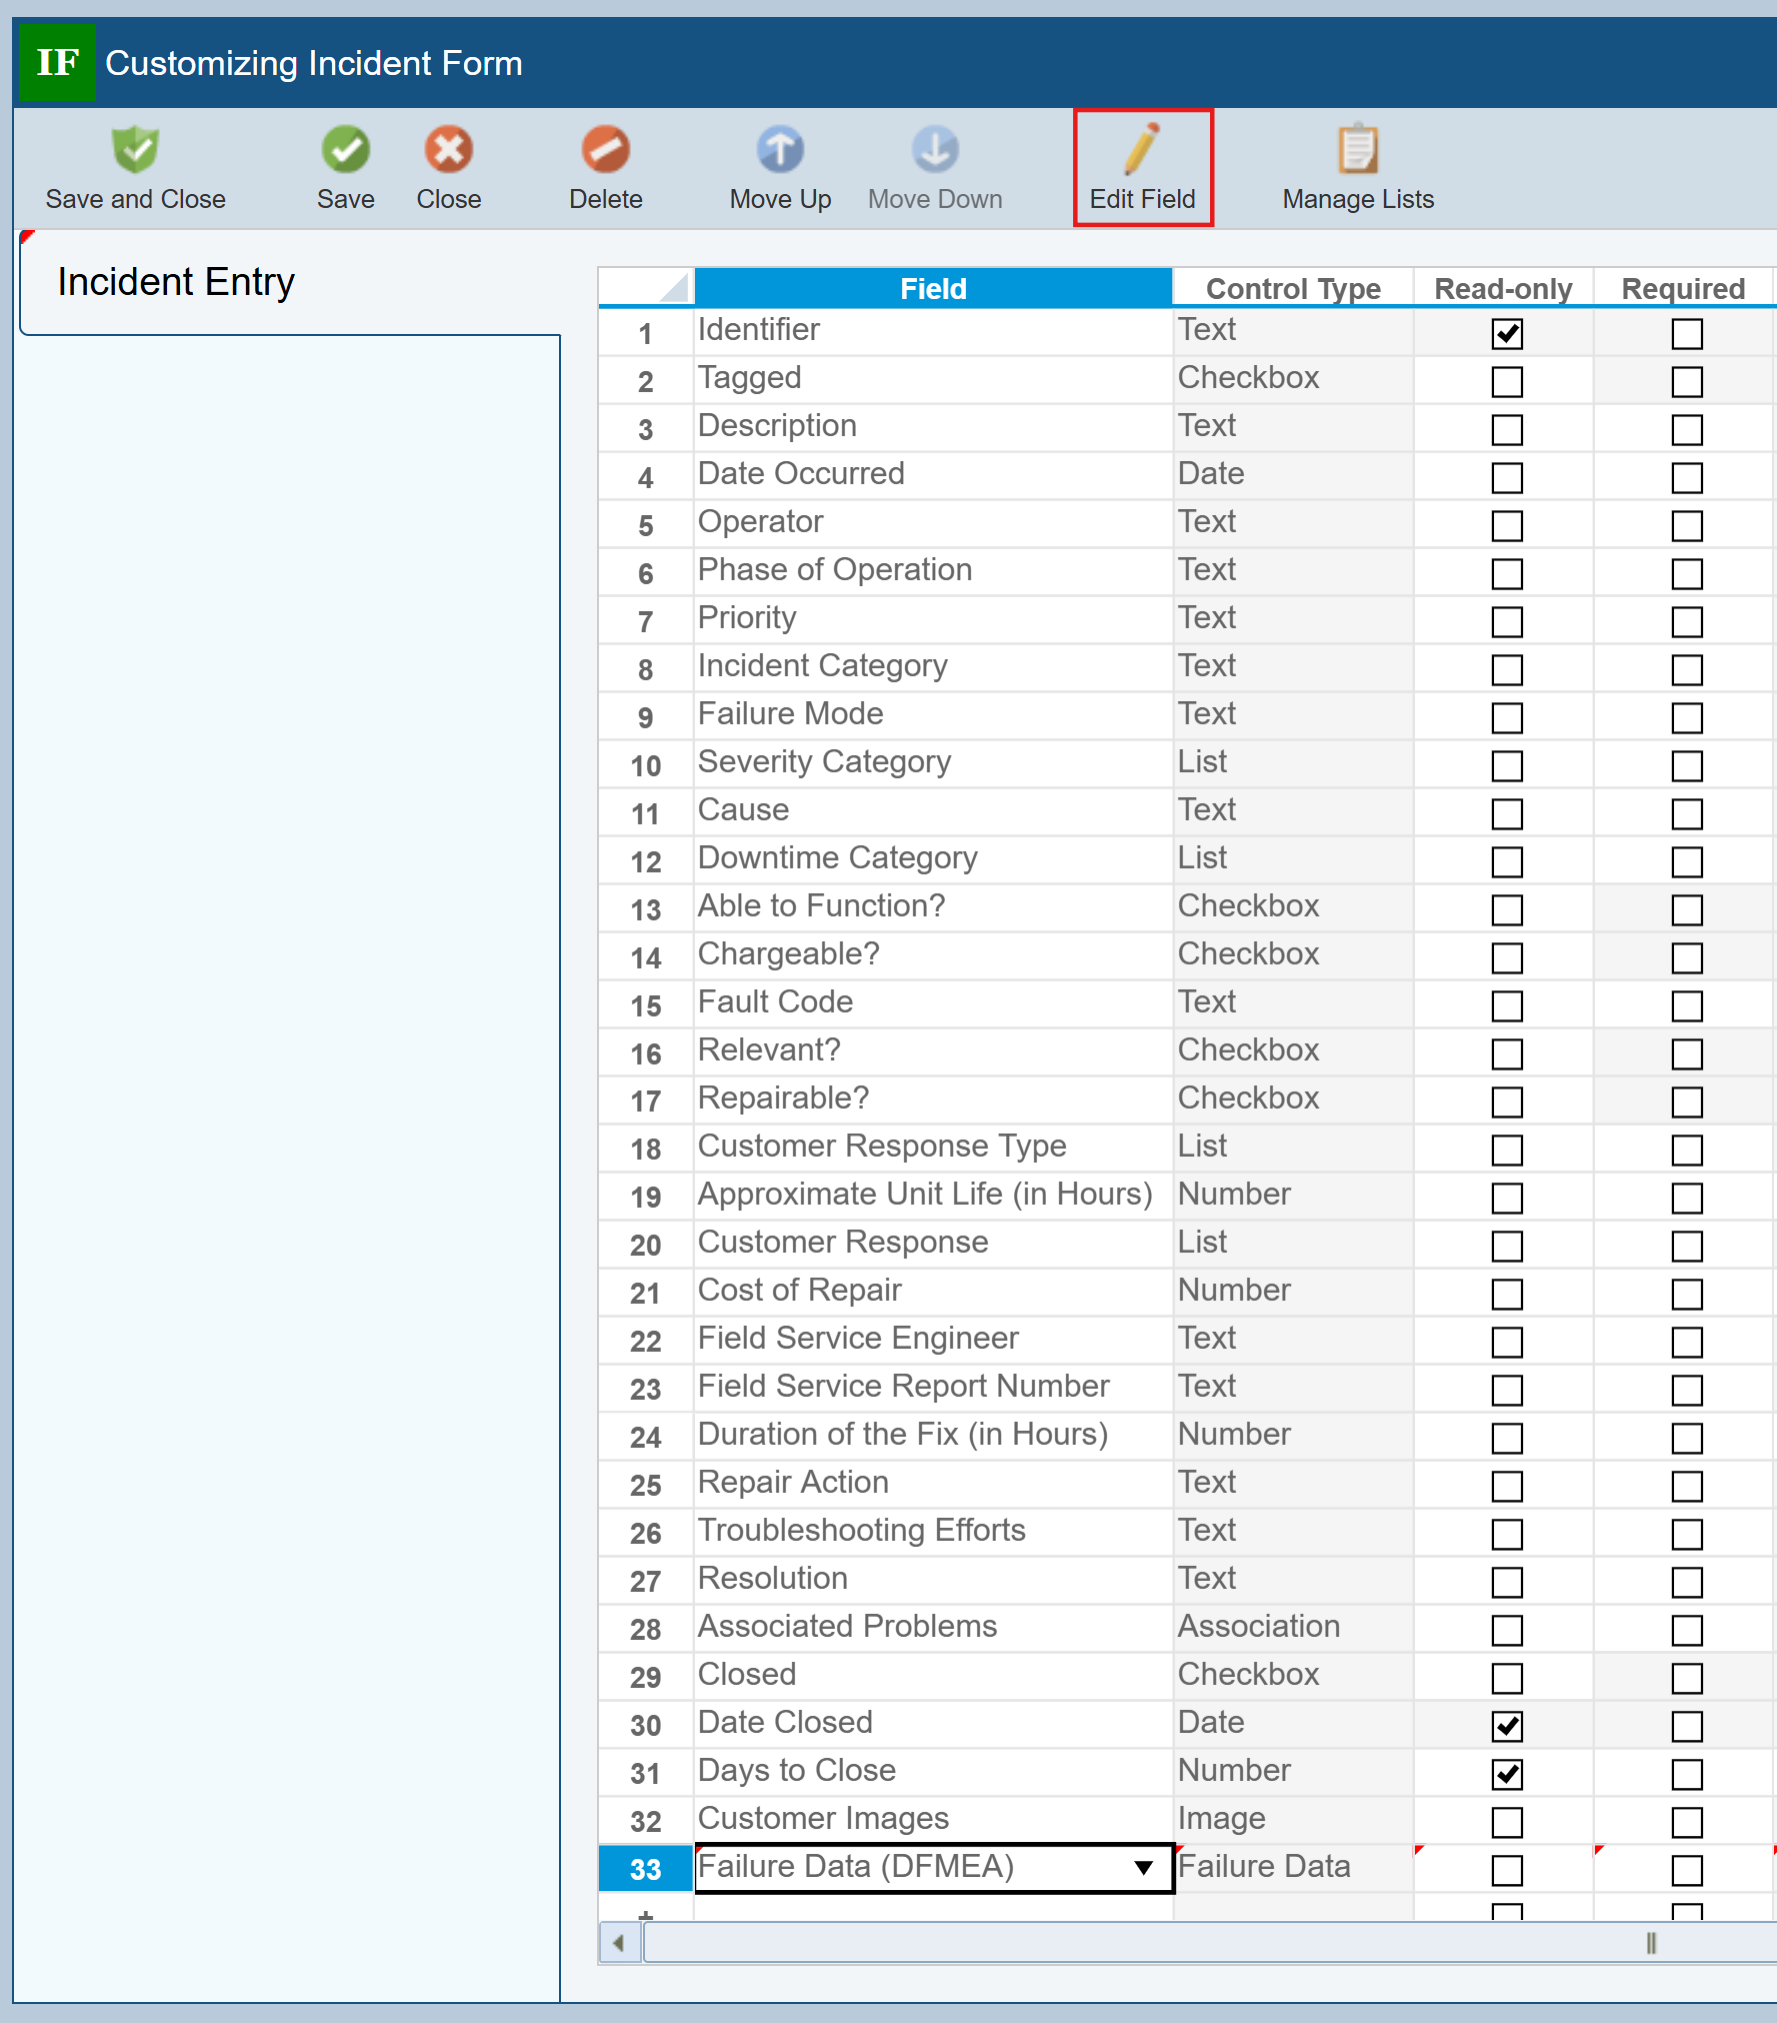
The Failure Data widget is customizable. To set up the widget the way we want, click in the Control Type column for the Failure Data (DFMEA) field and click the Edit Field button in the toolbar.
The Edit Field dialog appears.
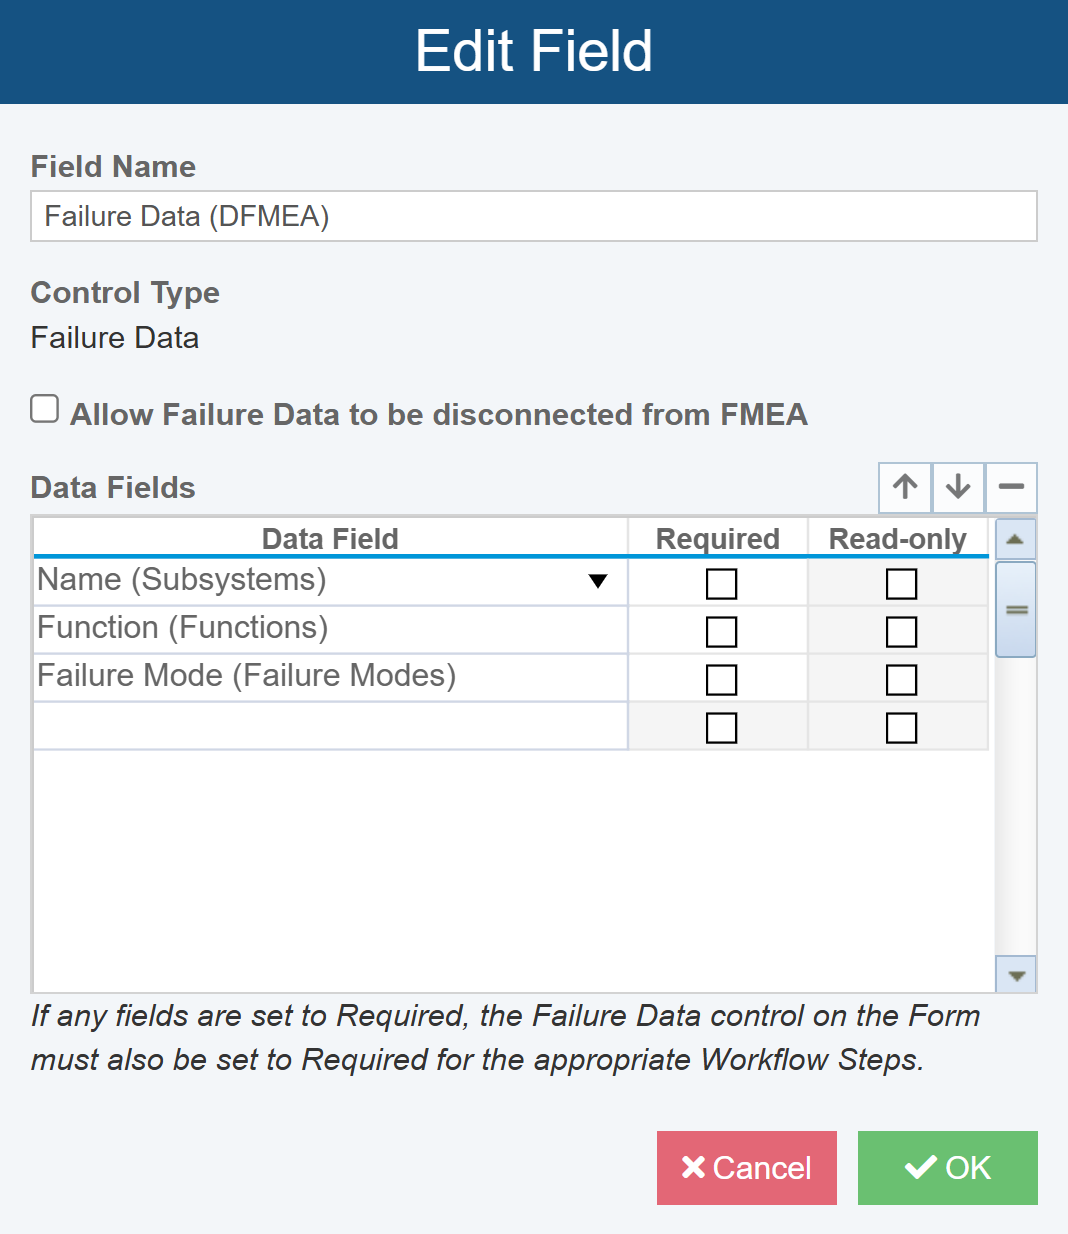
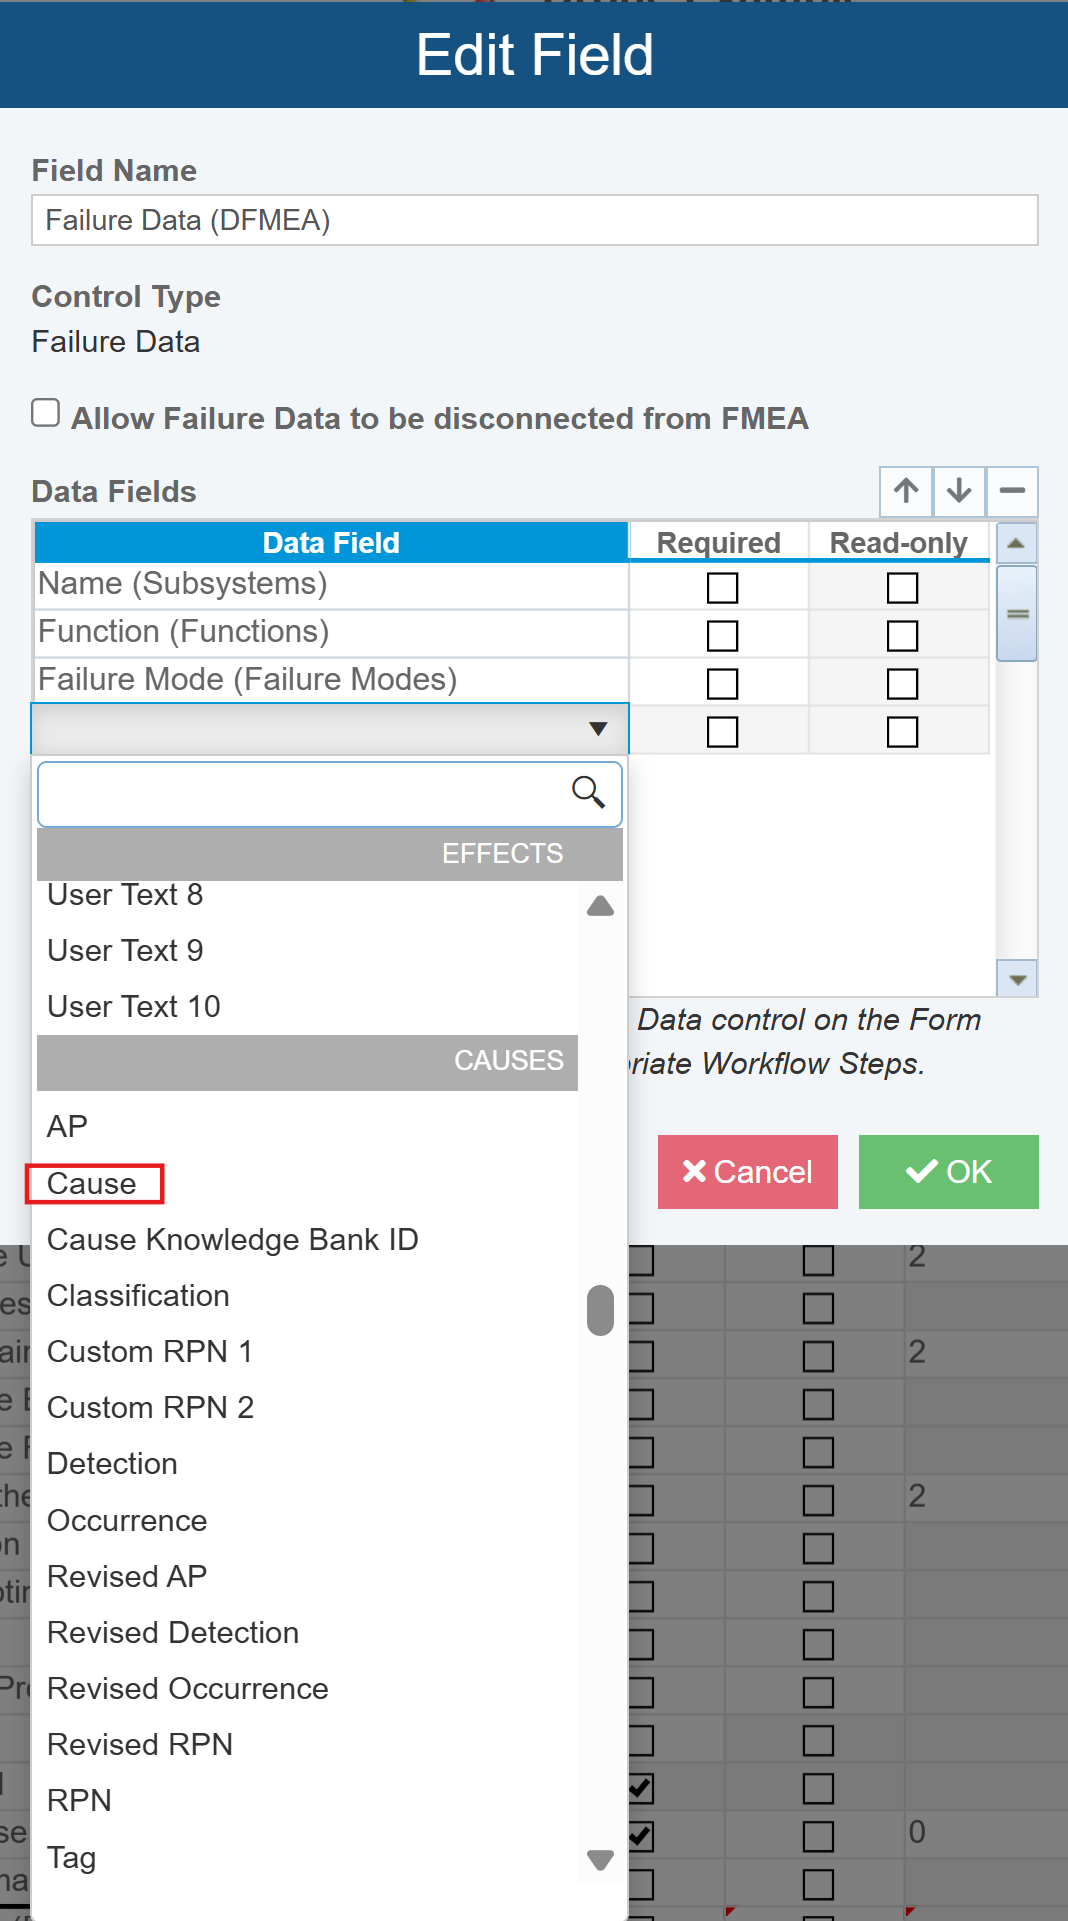
The Edit Field dialog enables you to fully customize the Failure Data widget for your needs. By default, the widget includes the Subsystem Name, Function, and Failure Mode data fields. These data fields represent data from the DFMEA Worksheet. When these fields appear on the FRACAS Form, they will display a list of these items from the DFMEA Worksheet in this Analysis. For further details about customizing the Failure Data widget, see the Customizing Failure Direct Connect topic.
For this tutorial, we are going to add the Cause field to the widget. Go to the last line in the Data Fields table and click in the Data Field column and click the dropdown arrow to bring up the list of available FMEA data fields. Select Cause from the list and press Tab.
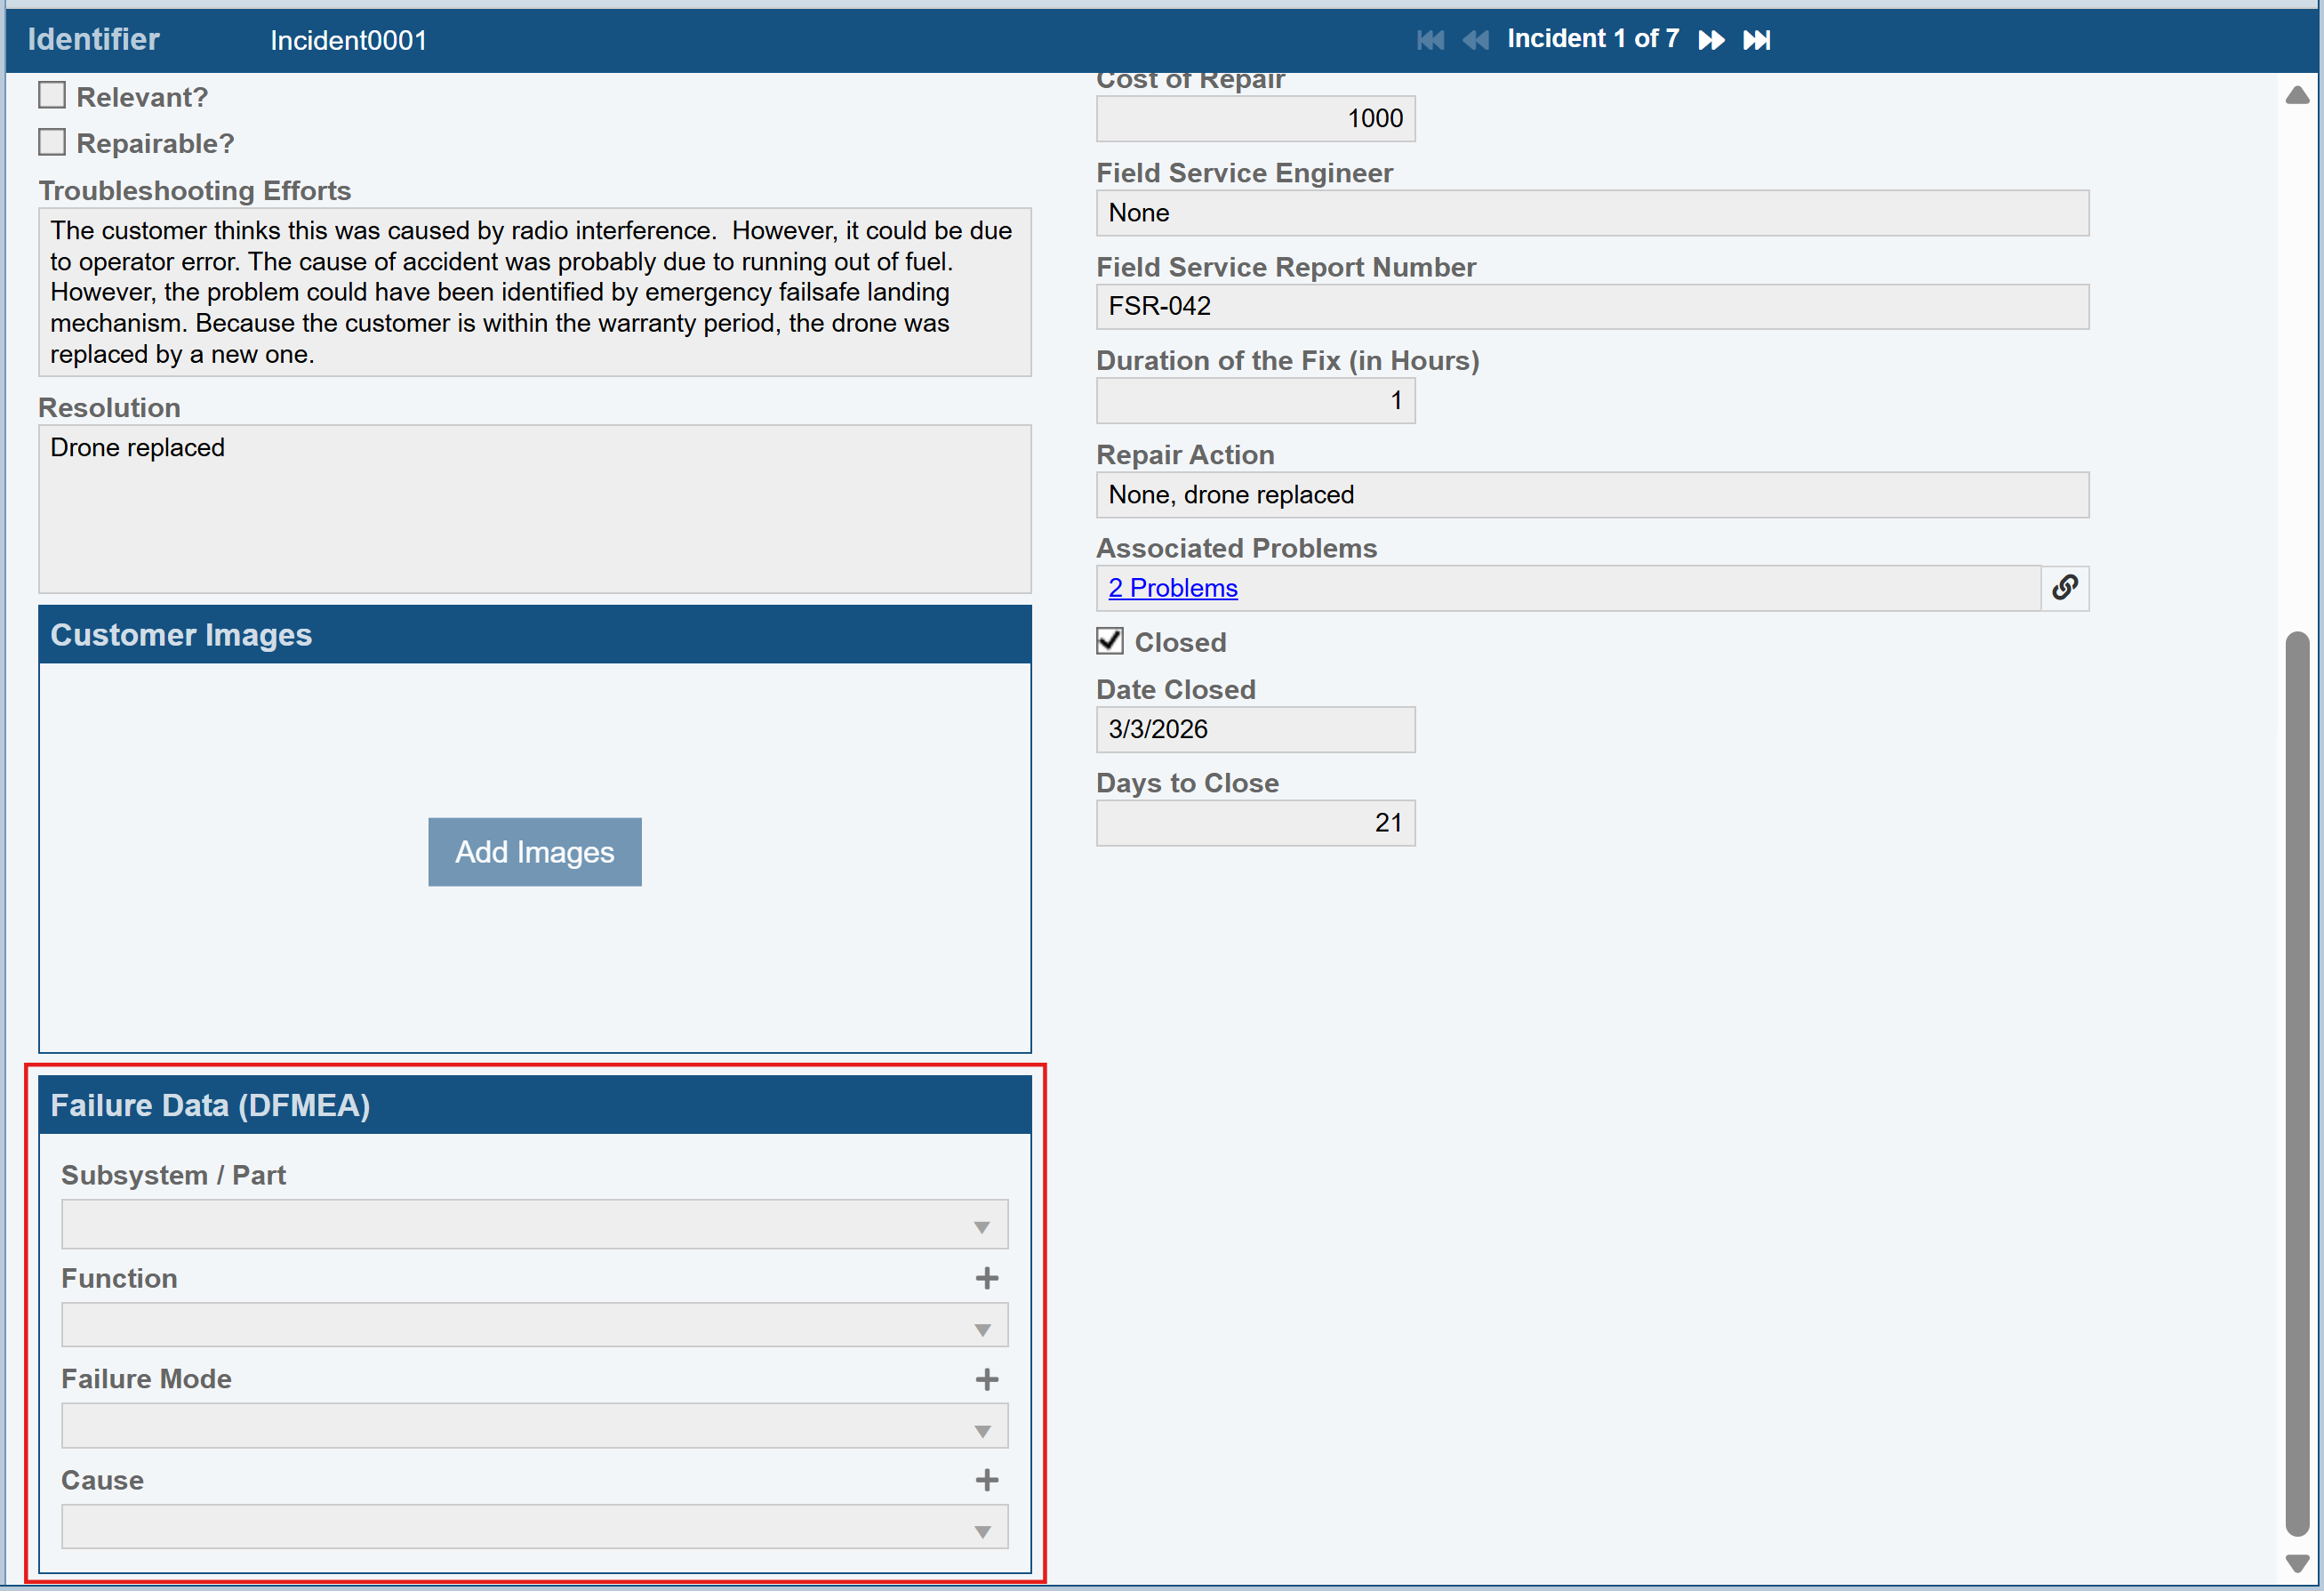
Click OK to close the Edit Field dialog and return to the Customizing Incident Form page. By default, the widget is set to appear in the Left column on the form, and we will leave it as is. Click the Save and Close button in the toolbar to save your changes and return to the Incident Form. The Failure Data widget appears on the Incident Form; scroll down to see it, if needed.
5. Add New Incidents and Connect to DFMEA Data
Now, let's assume we have two new Incidents that have been reported that we need to log. One customer reported a motor malfunction in his drone; another reported that the landing gear collapsed upon landing.
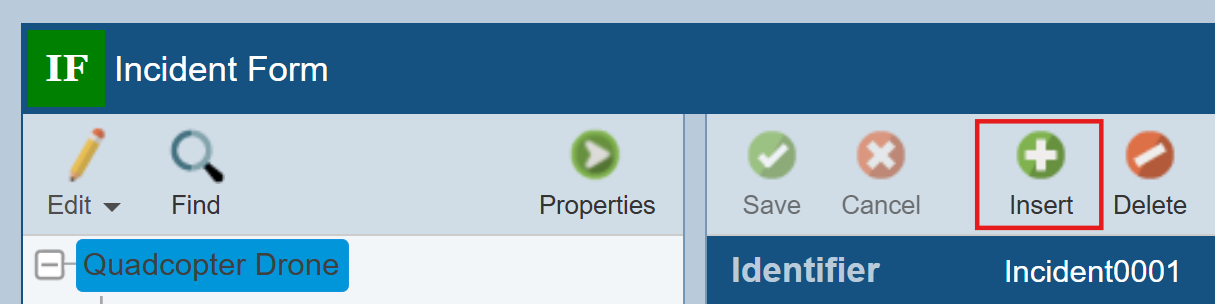
Click Insert in the toolbar to add a new Incident.
The Incident Form will show the newly added Incident ready to be filled in. Enter the following data fields:
Description: User reported motor malfunction and then drone crash.
Repair Action: Sent customer replacement motor. Failed motor will be sent back for analysis.
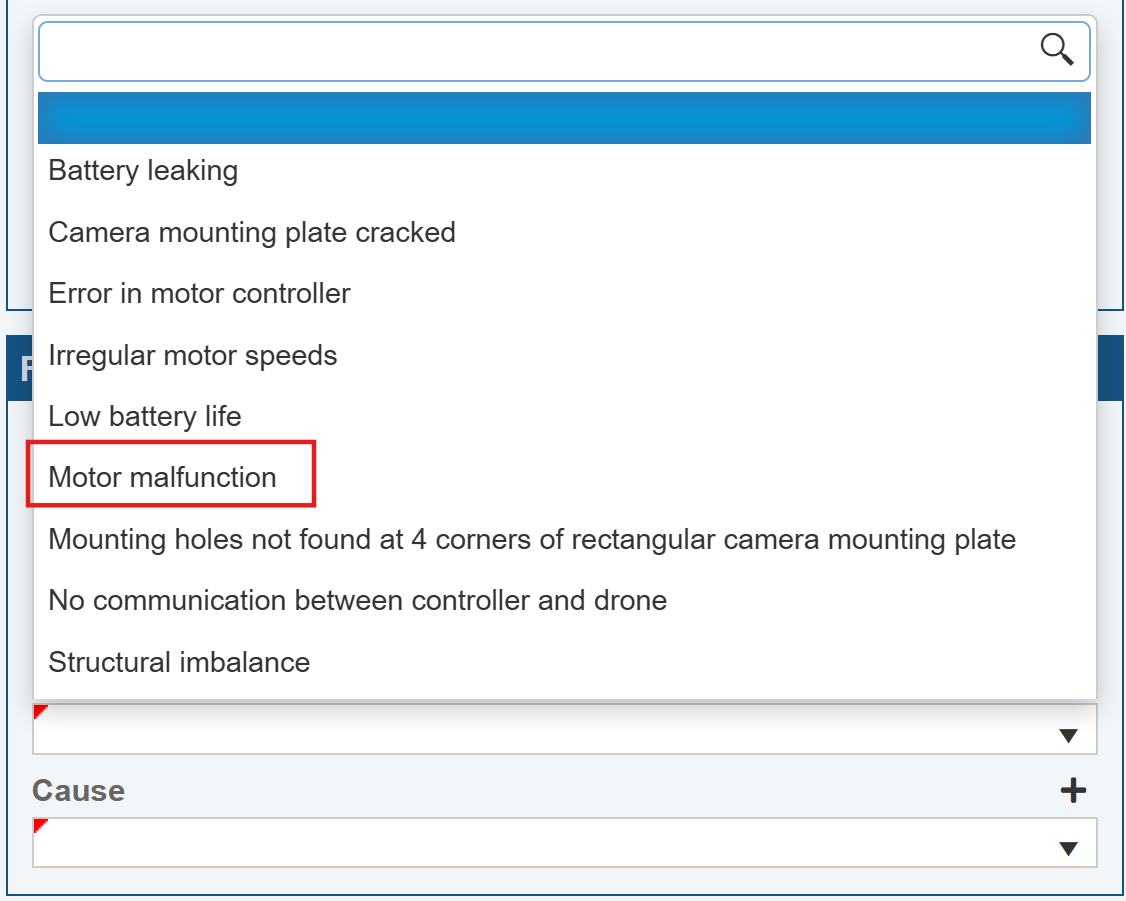
Now, let's go to the Failure Data widget and see if this Failure Mode was considered during the FMEA process. To start, we know this failure applies to the Quadcopter Drone itself (i.e. not the Motherboard or GPS for example), so from the Name (Subsystem / Part) list, make sure Quadcopter Drone is selected. We are not sure about the Function list, so click the dropdown list for Failure Mode. The list of all Failure Modes identified for the Quadcopter Drone on our FMEA is shown. We can see that Motor malfunction appears in the list. Select Motor malfunction by clicking it.
Once selected, the Function is automatically filled in based on the FMEA data. Also, at this point, we don't know the Cause, so we'll leave it blank for now.
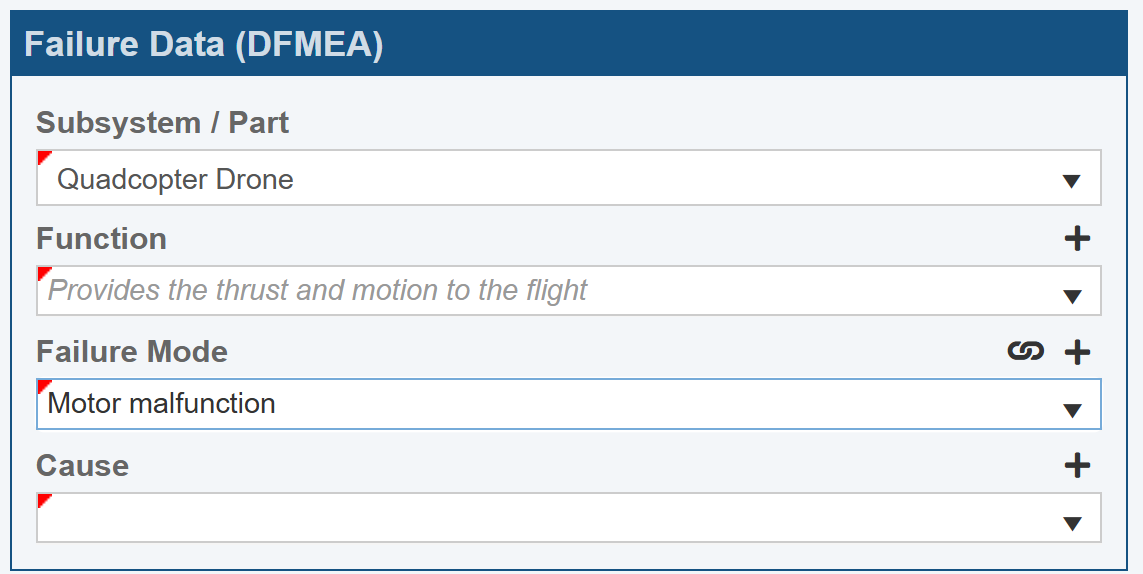
Notice that the link icon appears by the Failure Mode field. This indicates that this Failure Mode is connected directly to your FMEA data. Also, notice that the Function appears as watermarked, or lightly colored and italicized. This indicates that the data is retrieved from the FMEA, but you did not explicitly connect it.
Click Save in the toolbar to save this Incident report.
Click Insert in the toolbar to add our second new Incident report.
Enter the following data fields:
Description: Customer reported that upon landing the landing gear collapsed. There is no way for customer to replace landing gear, so drone is unusable.
Repair Action: Sent customer replacement drone.
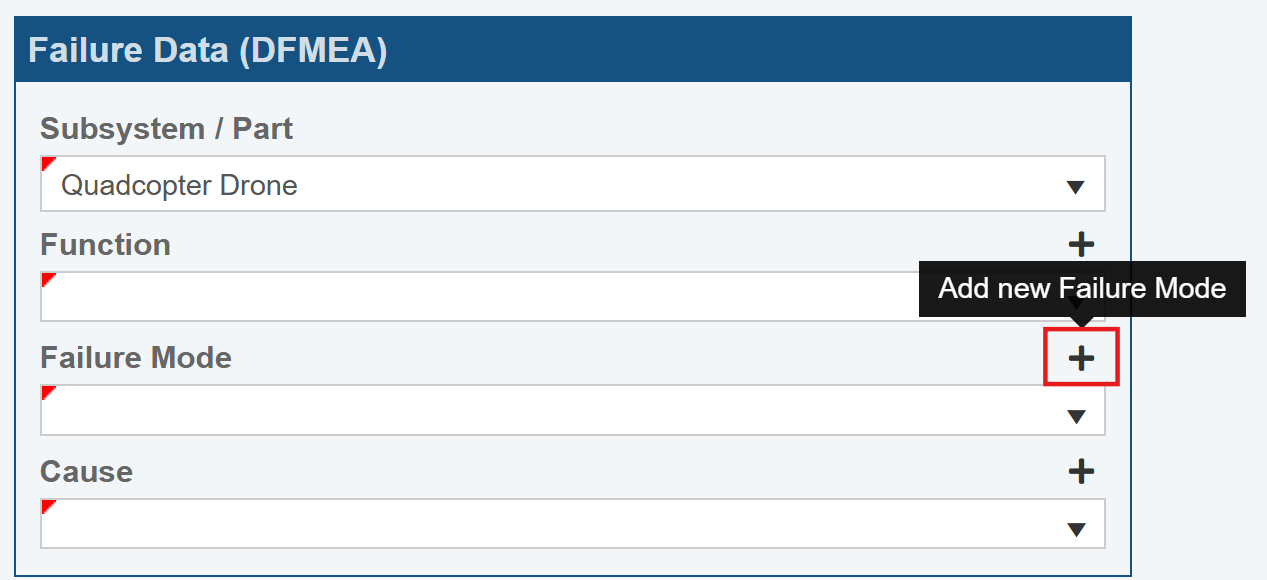
Now, let's go to the Failure Data widget and see if this Failure Mode was considered during the FMEA process. Again, we know this failure applies to the Quadcopter Drone itself, so from the Name (Subsystem / Part) list, make sure Quadcopter Drone is selected. Again, click the dropdown list for Failure Mode. We don't see anything about landing gear failures in the list. In this case, we want to have our FMEA team add this to the FMEA and perform the necessary evaluation for possible corrective actions, especially because we had to send the customer a new drone.
Click the '+' button next to the Failure Mode label (the Add new Failure Mode tooltip will appear when hovering over the '+' button).
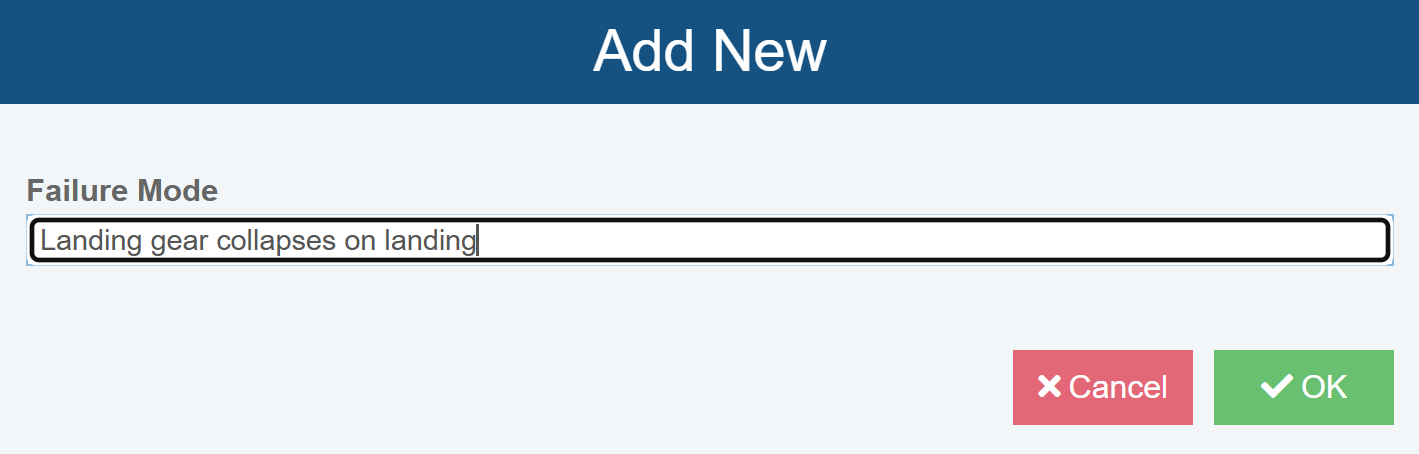
The Add New dialog appears. Enter Landing gear collapses on landing and click OK.
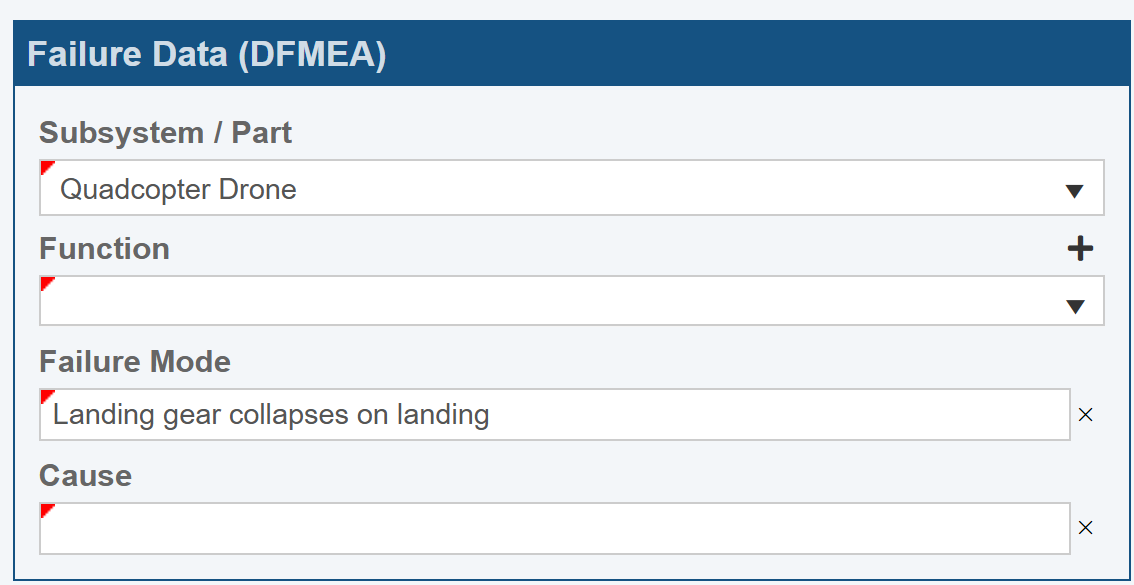
The new Failure Mode is logged. Notice that there is no link icon in this case. Also, notice the 'x' icon next to the Failure Mode field that now appears. If you decide you want to delete the newly entered Failure Mode, you can use the 'x' button to remove it.
Click Save to save this additional Incident.
6. Review New Failure Data Items in FMEA
Now that the FRACAS part of our Failure Direct Connect is complete, it is time to initiate the FMEA portion. The FMEA component of the Relyence Failure Direct Connect feature allows FMEA team members to review items that were added by the FRACAS team.
Click FMEA in the Sidebar menu to activate FMEA. Be sure that Design FMEA is selected.
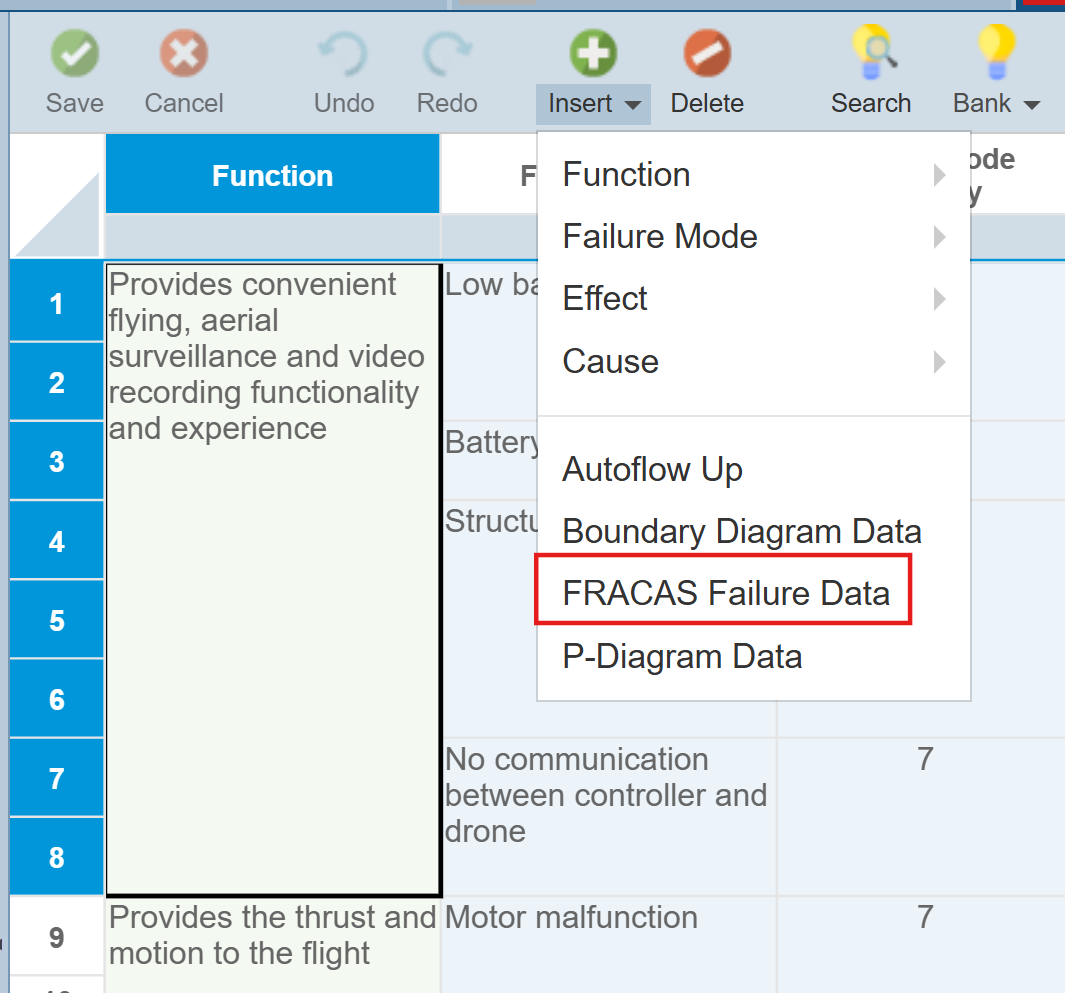
In the DFMEA Worksheet, from the toolbar, click Insert>FRACAS Failure Data.
The FRACAS Failure Data dialog appears. The dialog displays requests for new data additions to FMEA made by the FRACAS team. In this case, we can see the one new Failure Mode that was added via FRACAS. All new failure information requested for addition by the FRACAS team appears highlighted in yellow.
FRACAS Incident data related to the newly requested addition is also shown for informational purposes.
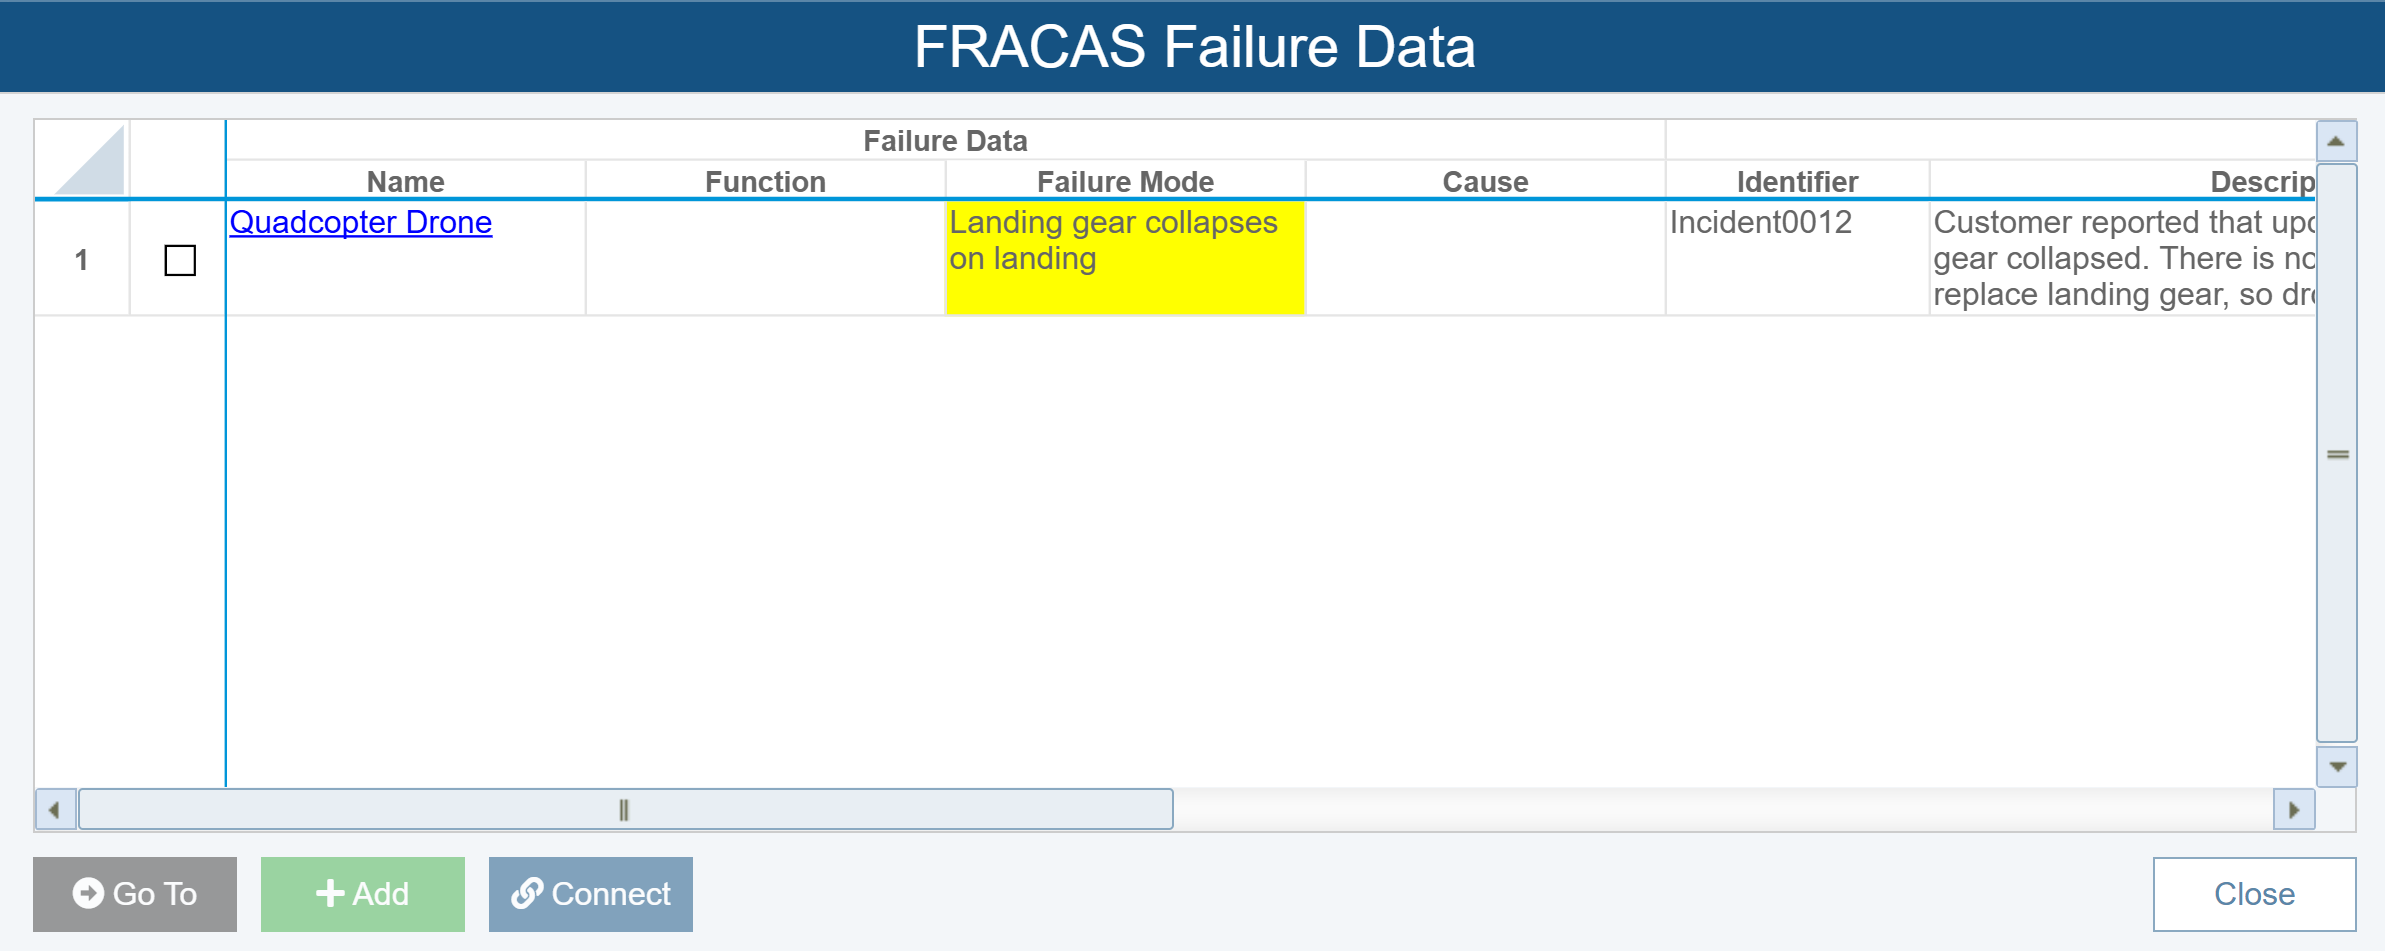
From a review of our FMEA, we can see that this Failure Mode was not covered, so we need to add it to the FMEA.
It is important to add it the correct location in our Worksheet.
 When using Failure Direct Connect, data is added to the FMEA Worksheet at the currently active location.
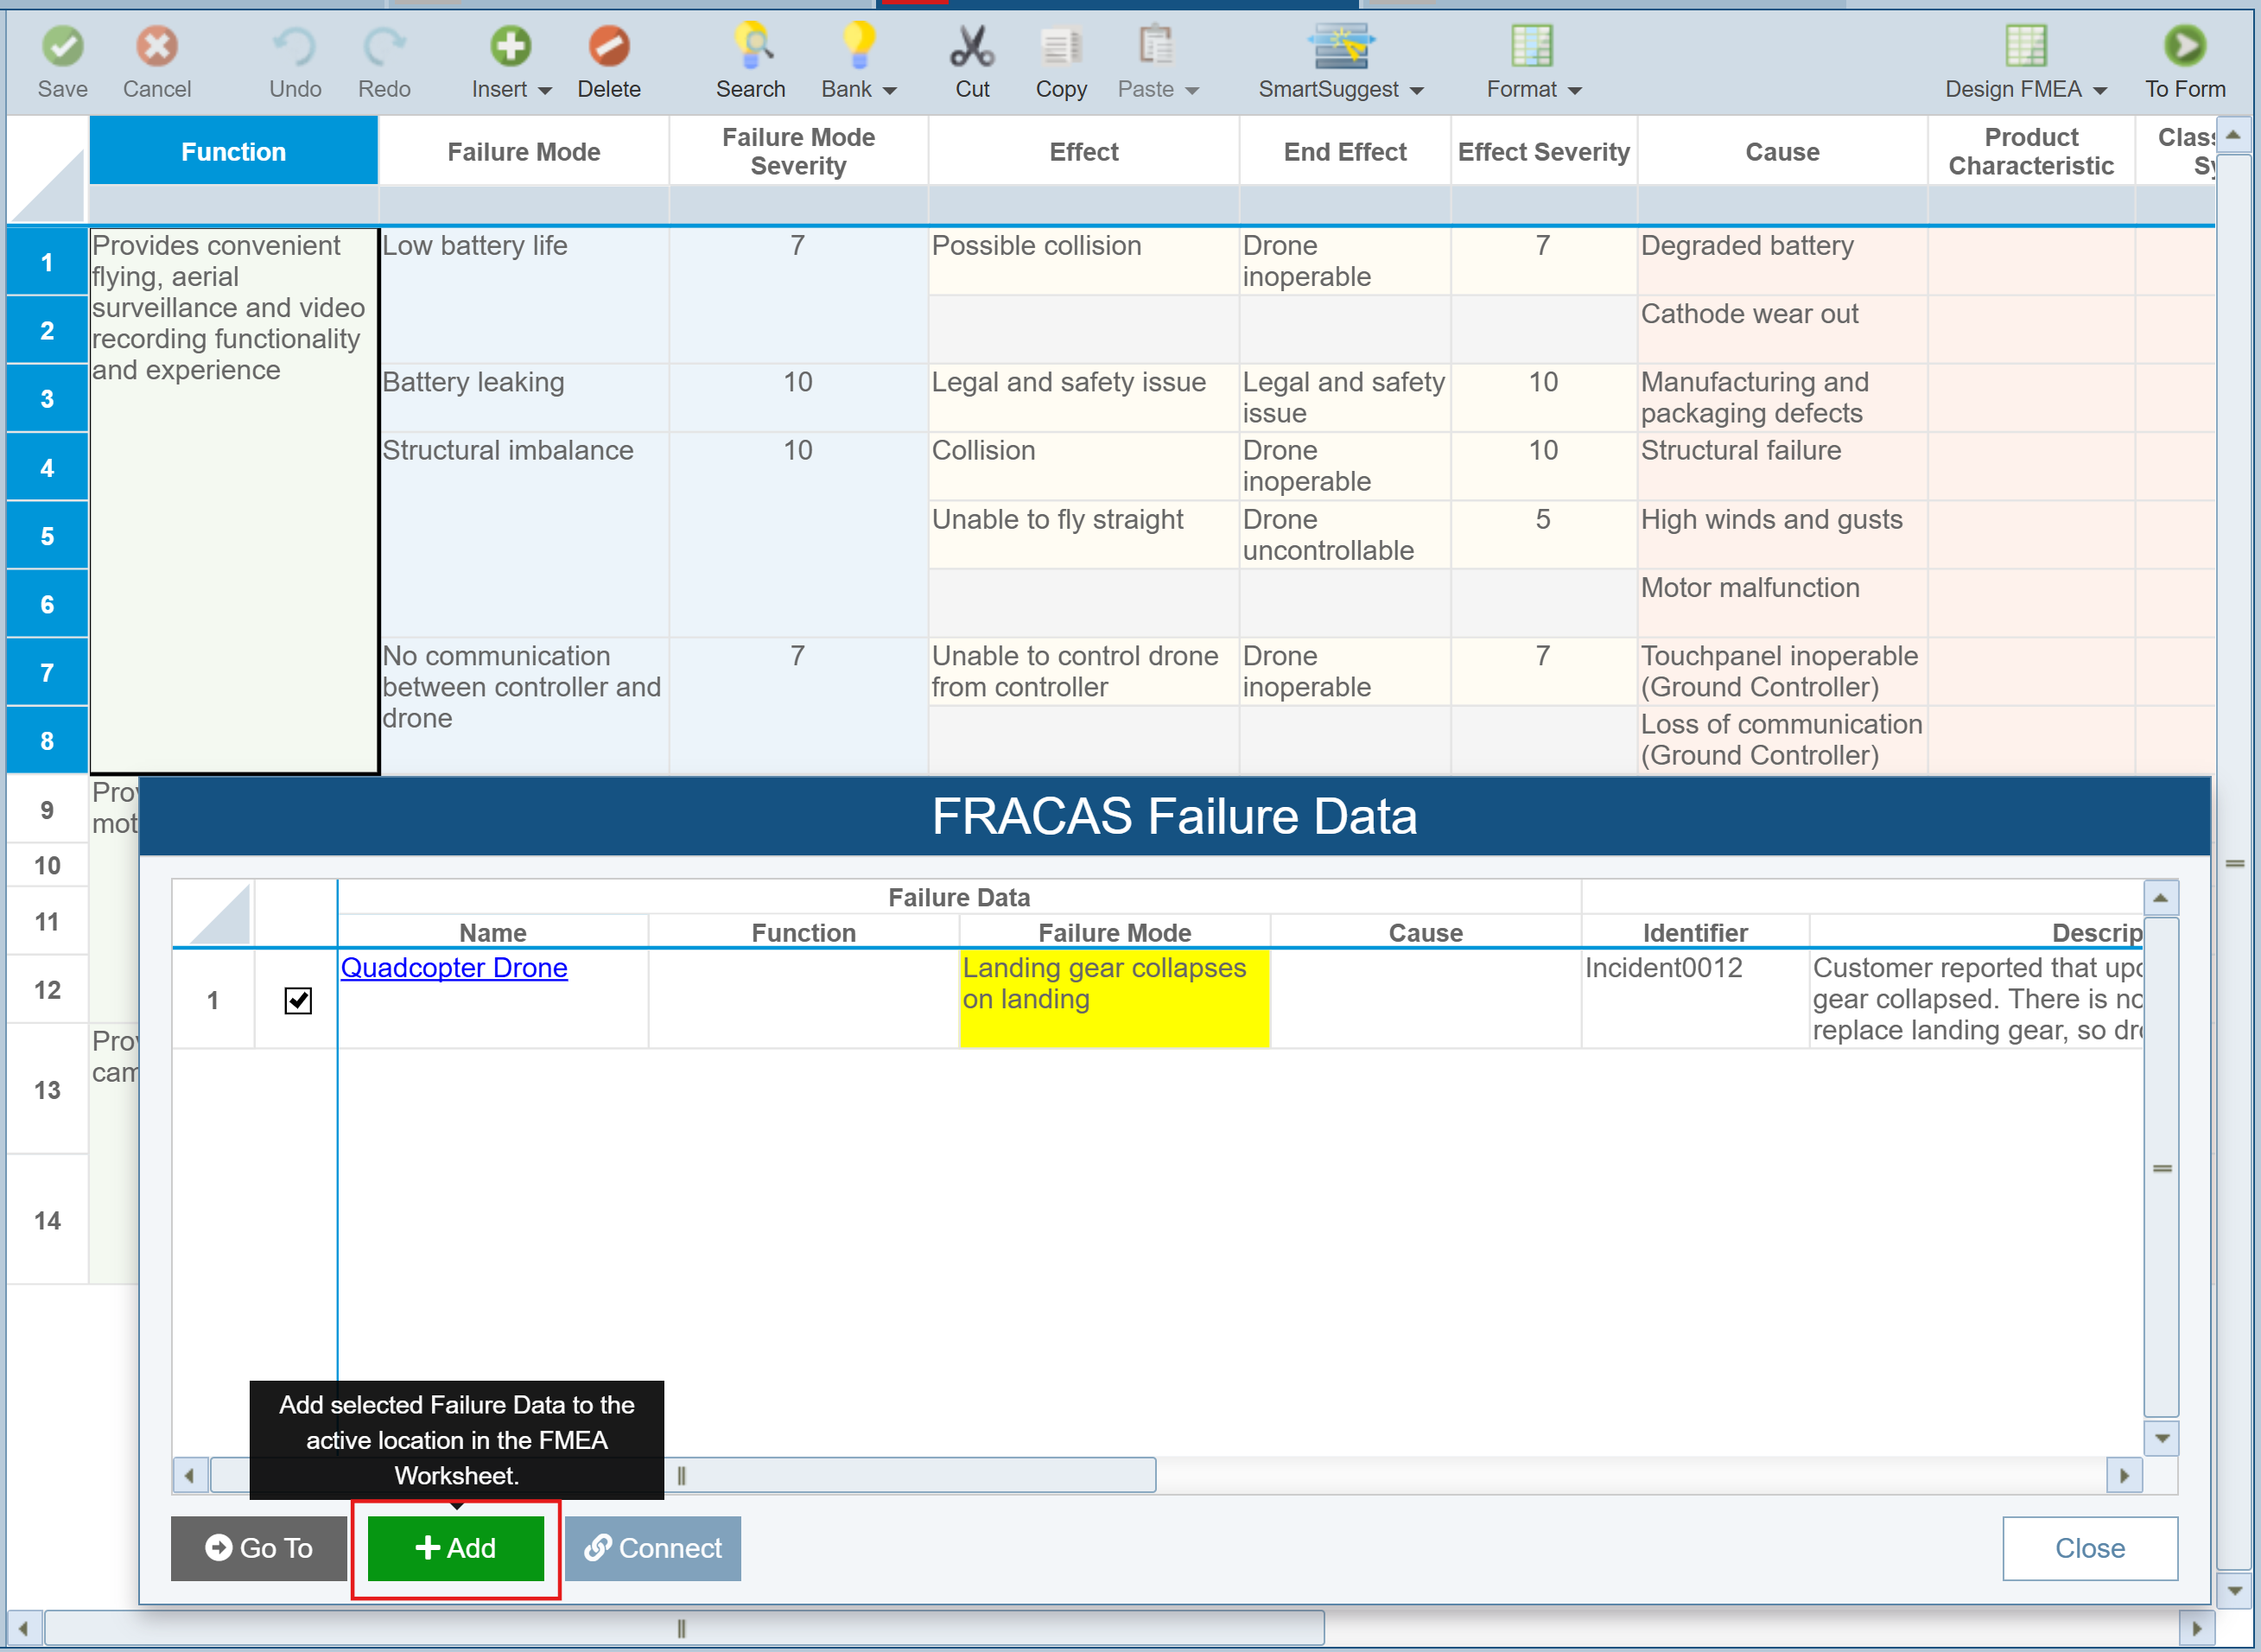
At this point, the Quadcopter Drone should be selected in the Analysis Tree and the Function "Provides convenient flying, aerial surveillance and video recording functionality and experience" selected in the Worksheet. If you were not at the appropriate location to add this data, you can select the checkbox for this item in the Table and click to Go To button navigate to it. Or, you can also use the hyperlinks that appear in the FRACAS Failure Data Table to navigate to the correct location.
Because the FRACAS team did not select a Function for this Failure Mode, we can choose the Function in the Worksheet to add this new Failure Mode to. In this case, the first Function "Provides convenient flying, aerial surveillance and video recording functionality and experience" is where we want to add this new Mode. If we had wanted to add it to the second Function "Provides thrust and motion to the flight", we would simply select that Function in the FMEA Worksheet so it is the active location.
To add the new Failure Mode, select the checkbox in the second column of the FRACAS Failure Data table and then click the Add button.
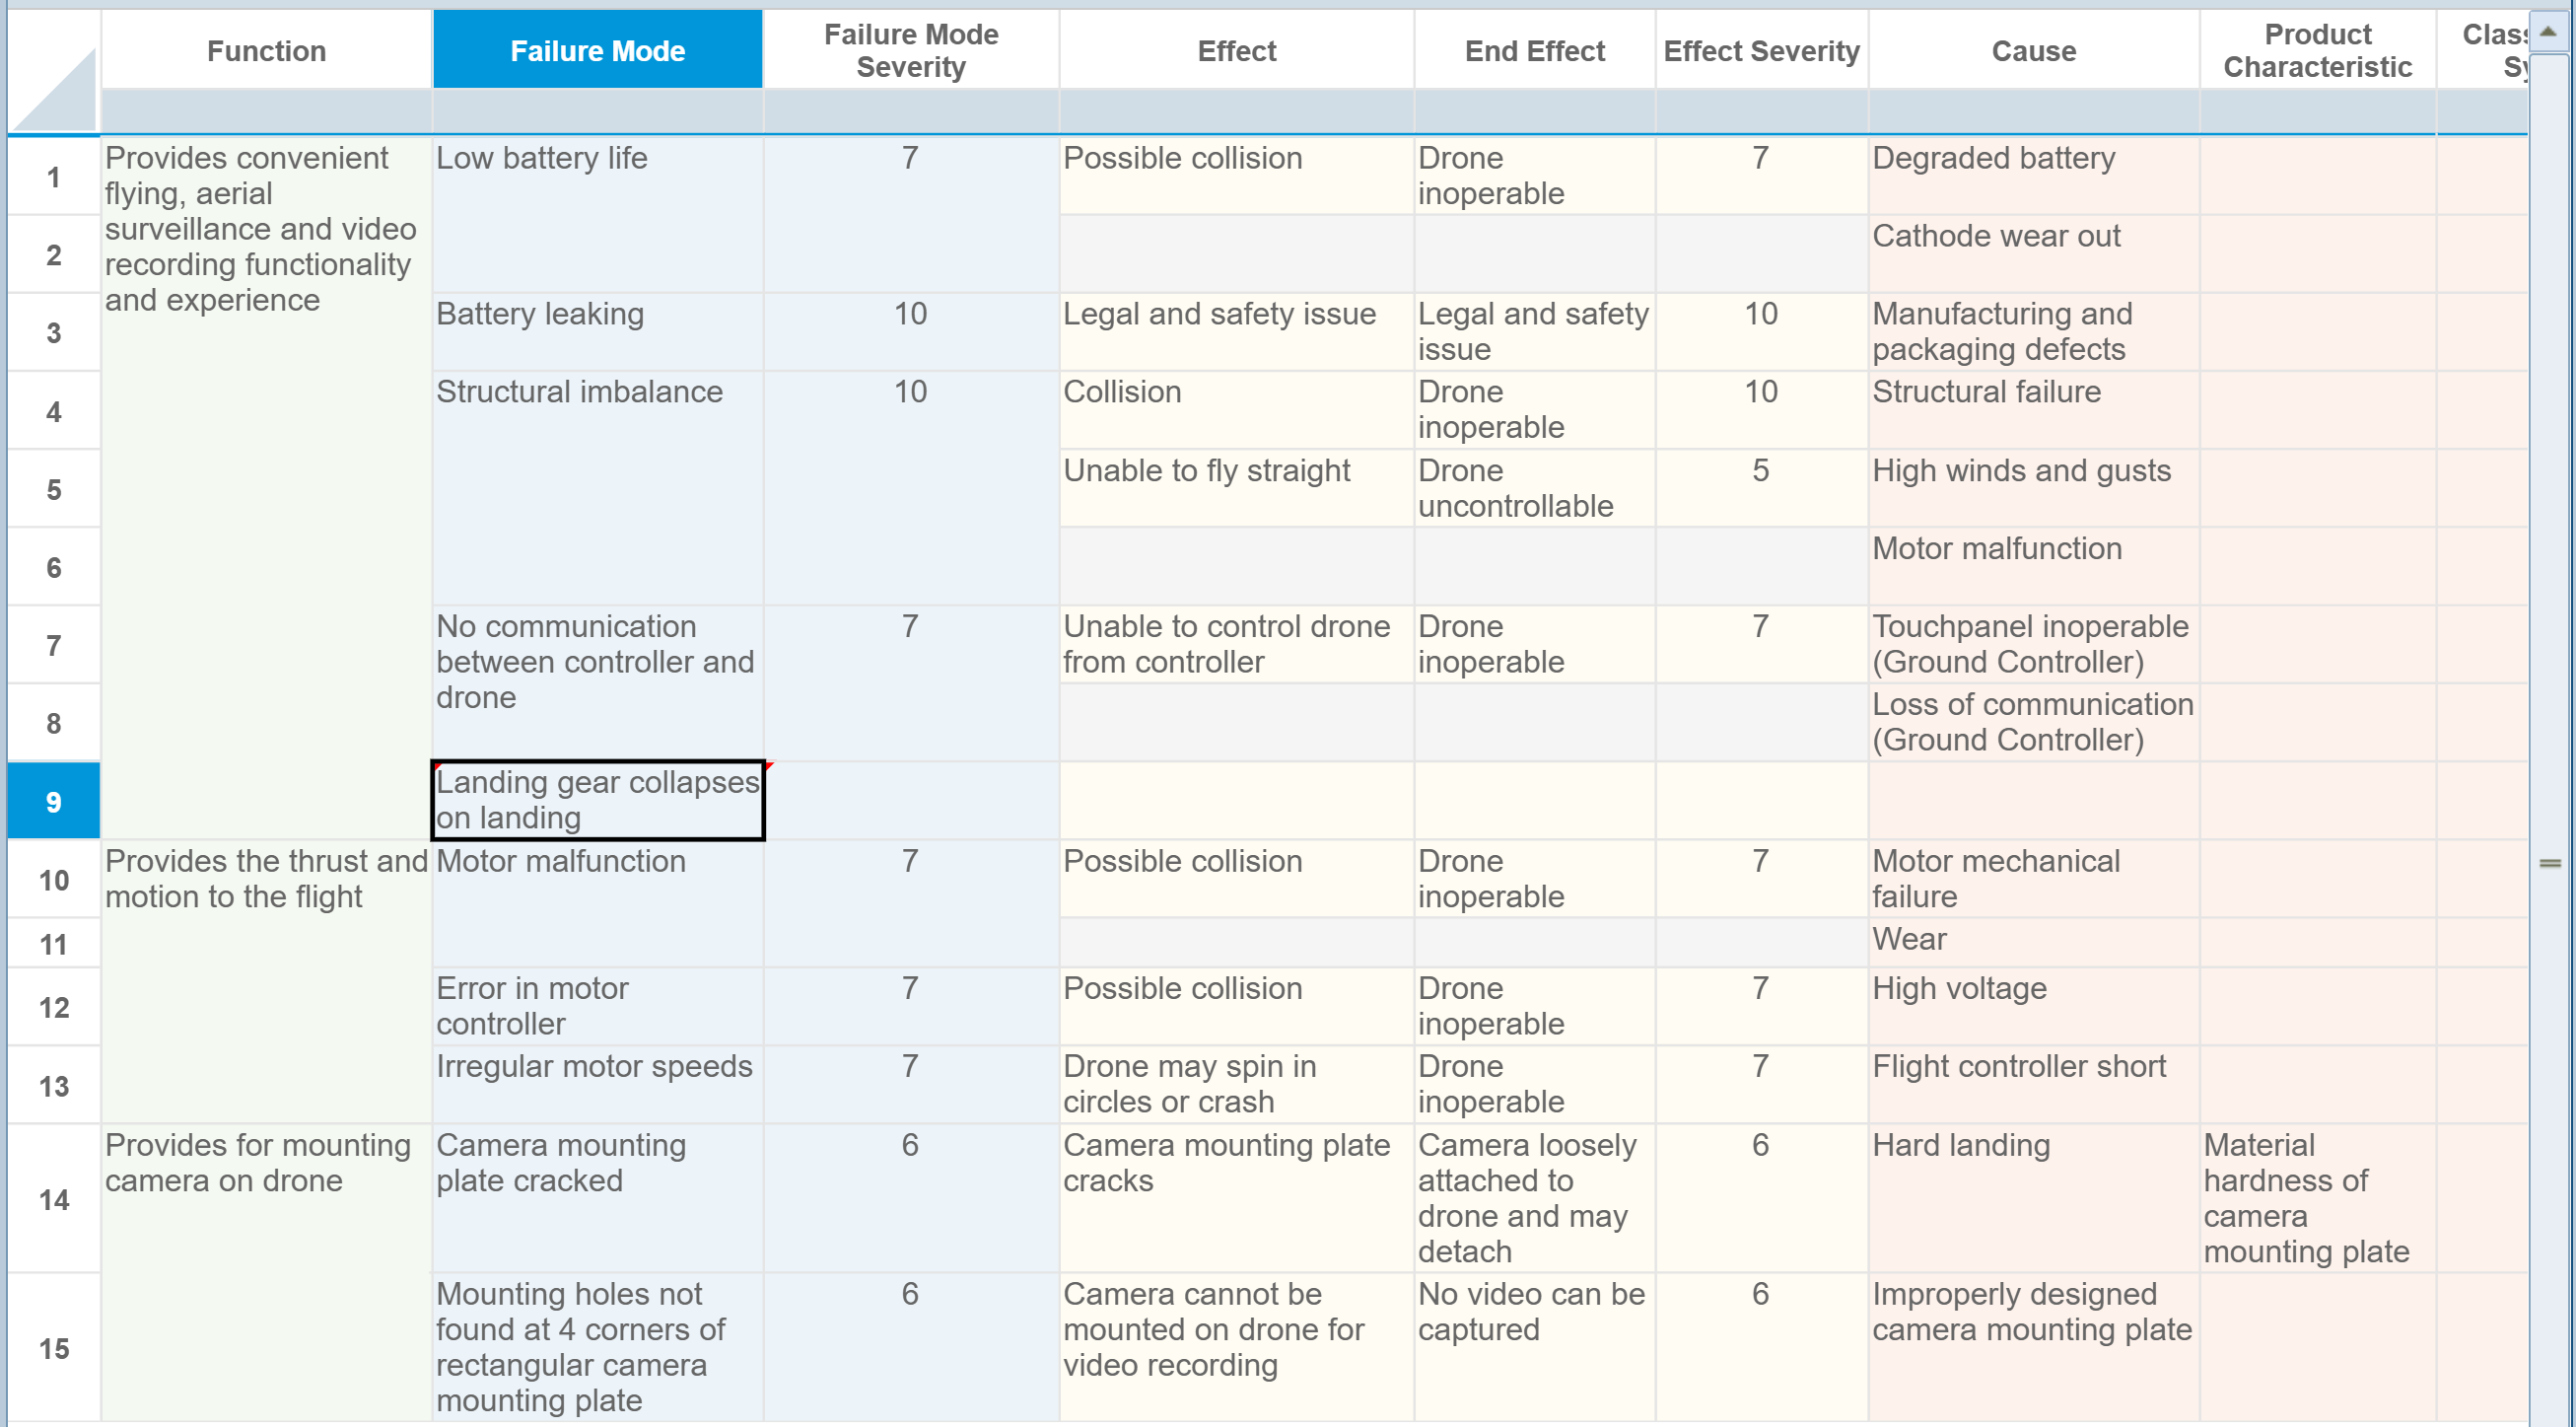
Click Close to close the FRACAS Failure Data dialog.
The new Failure Mode appears in the FMEA Worksheet and work can proceed to evaluate this failure and decide what recommended actions to take.
7. Moving on
Congratulations! You have successfully completed the Getting Started with Relyence Failure Direct Connect tutorial and are ready to move on!
In this tutorial, we have just touched the surface of the power of Relyence Failure Direct Connect. Feel free to test out difference scenarios, and review the other sections of this guide on Customizing Failure Direct Connect, and Failure Direct Connect in FRACAS and Failure Direct Connect in FMEA.