Getting Started with Relyence FRACAS
If you would like to review a video overview of this Getting Started Guide, go to our online videos for Relyence FRACAS.
1. Sign in to Relyence
To begin, make sure you are signed in to Relyence. For details on signing in, see Signing in and Signing out.
You must have a Relyence account to sign in to Relyence. If you do not yet have a Relyence account, you can register for one for free.
You may possibly see the Announcements dialog when first signing into Relyence. The Announcements automatically scroll, or you can review them using the previous and next arrow keys. For any Announcements you do not wish to see again, select the Don't show me this again checkbox. Once you have reviewed all the Announcements, click the 'x' (Close) button in the upper right corner of the Announcements dialog.
2. Open the Example Analysis
First, let's make sure Relyence FRACAS is active.
After you have signed in, you may see a Welcome dialog. If a Welcome dialog does not appear, click Welcome to Relyence from the Help dropdown menu in the upper right of the Relyence header bar.
If you were previously working on an Analysis, you will see the Continue Where I Left Off option at the top of this dialog, otherwise it will not appear. If you are using a Trial version, the Show this page when Relyence opens option will not appear. This option is only available using a licensed version of Relyence.
Click the FRACAS tab on the left to activate Relyence FRACAS. Then click Open Example Analysis.
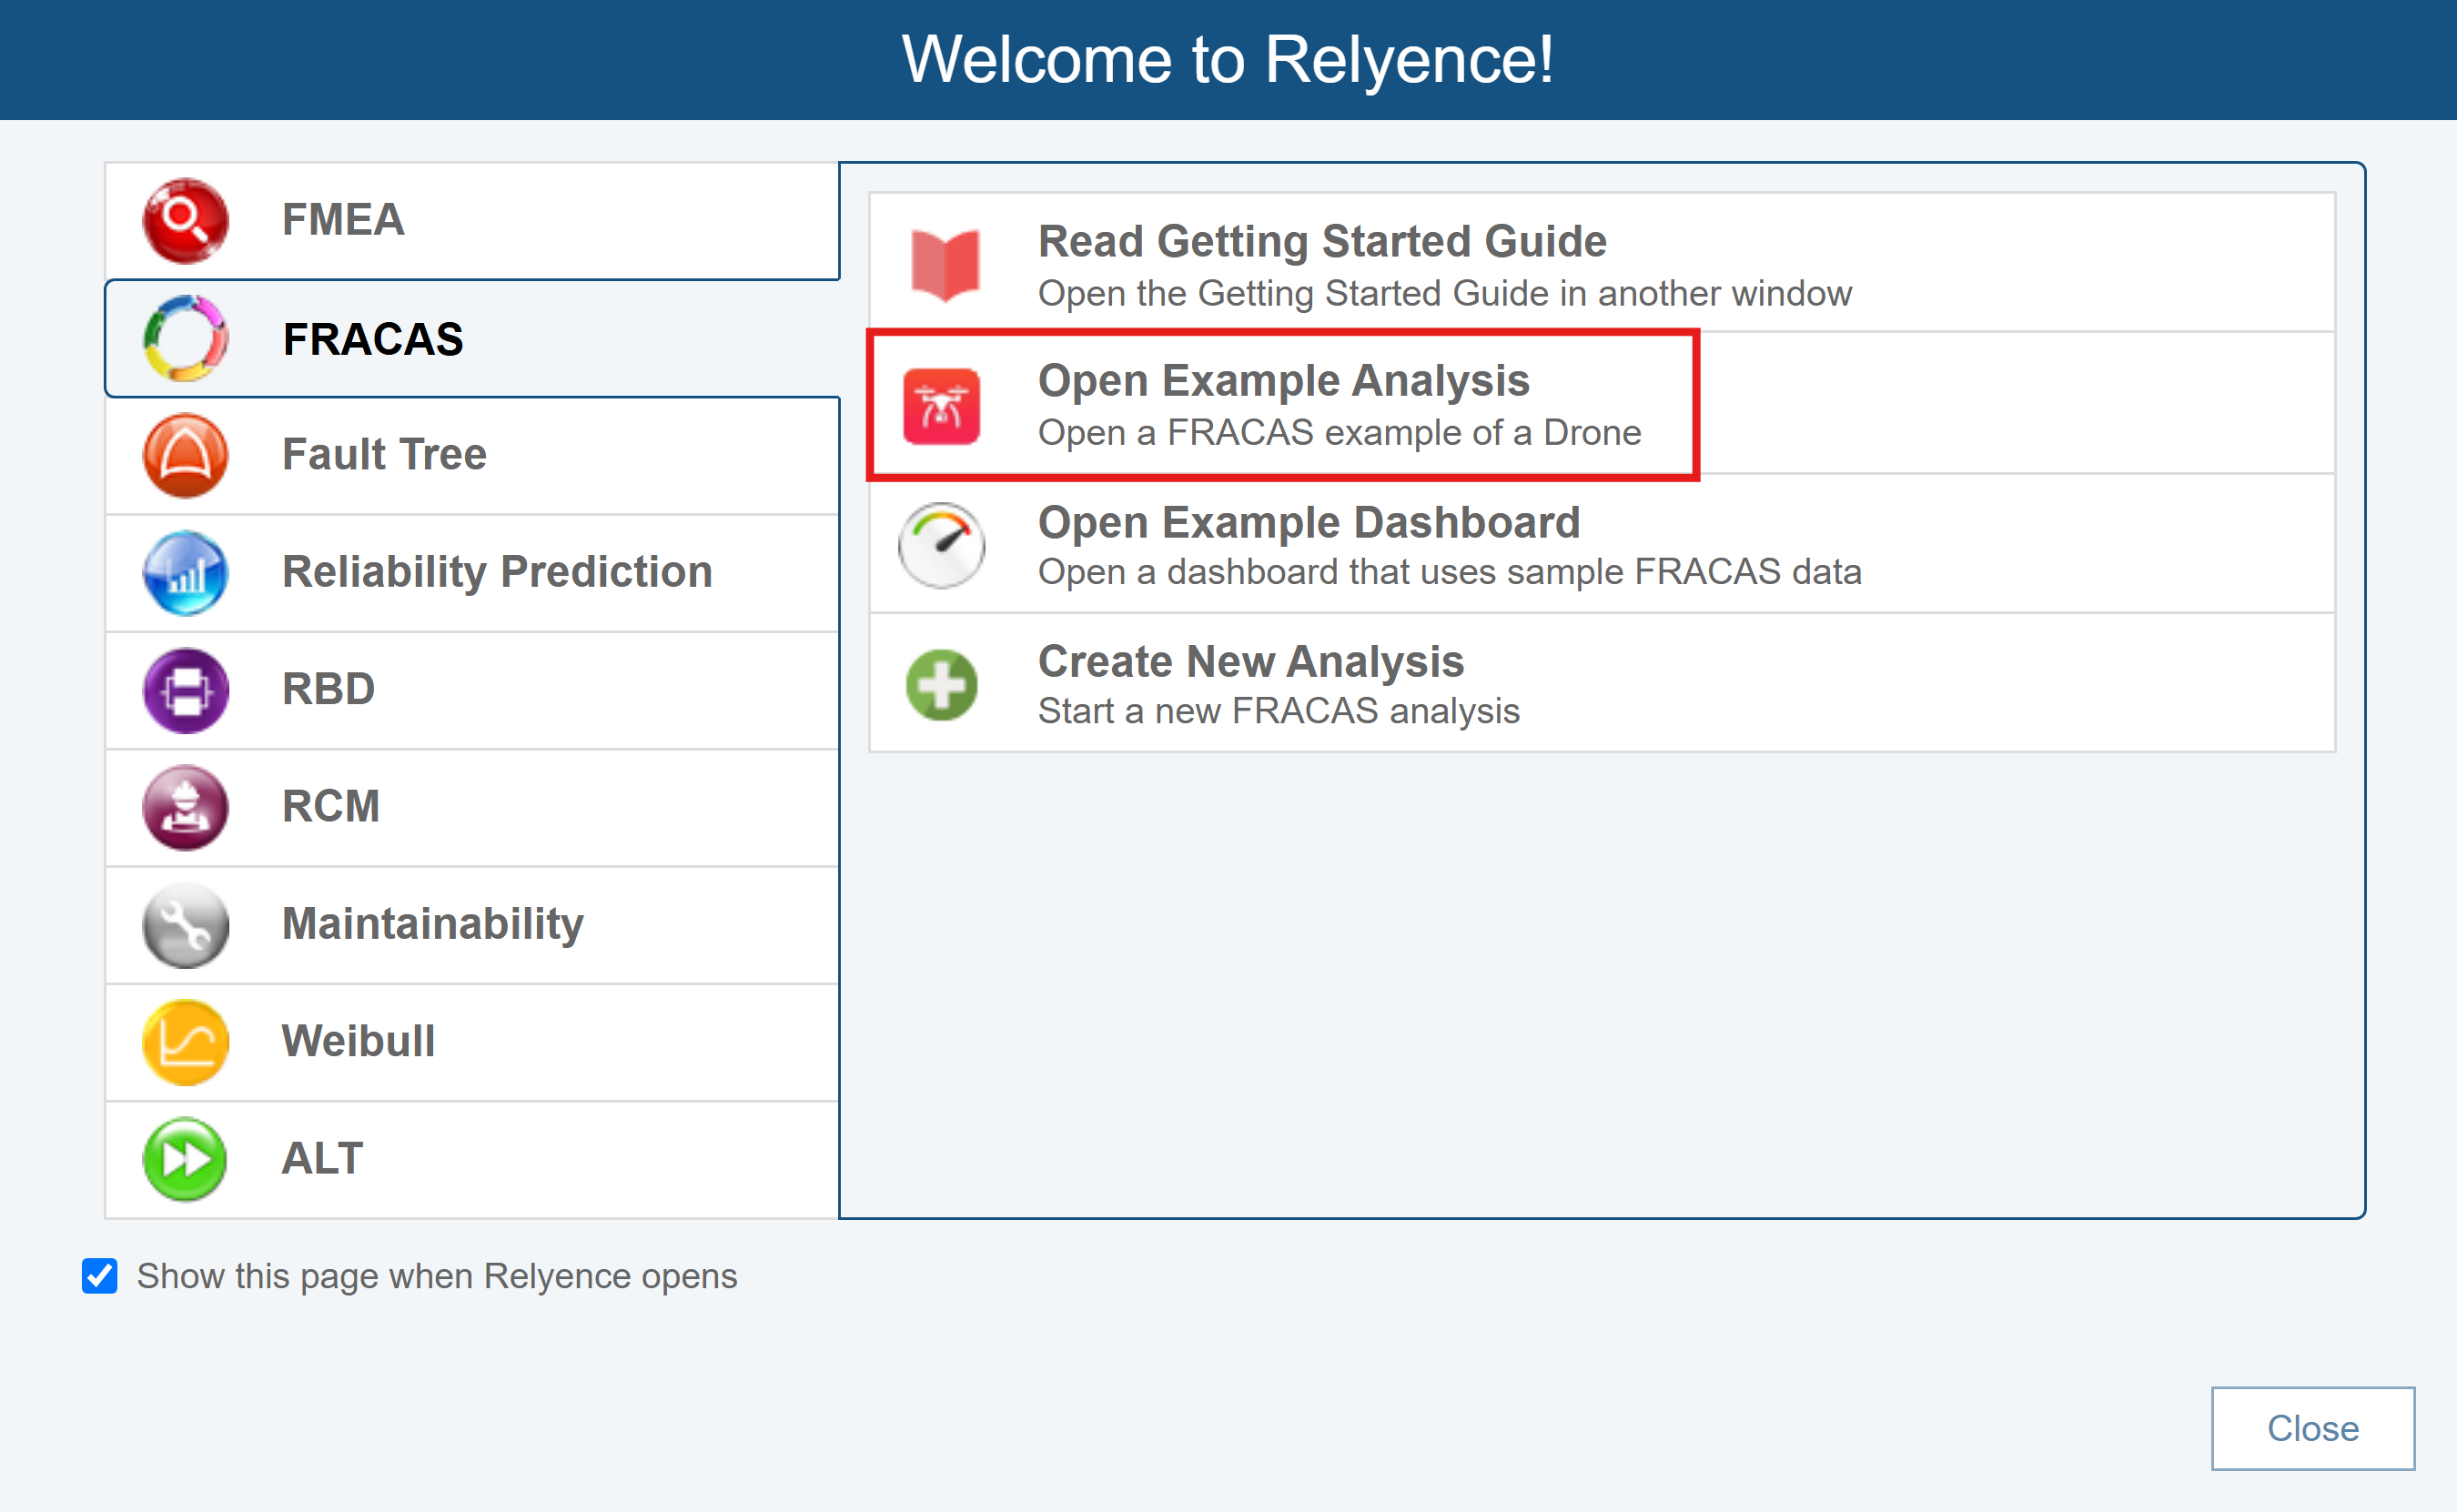
For this tutorial, we will use the Drone Example supplied with Relyence FRACAS.
When you open an Example for the first time, you will see the Revert Example pop up appear. You are free to make changes and save your changes to the Example Analyses. If you want to revert to the original Example at any time, click Revert Example. You will get a message asking if you are sure before your changes are discarded. Click Got it! to dismiss the pop up.
For this tutorial, we assume an unmodified original Example is being used. If you are not sure if you are using an unmodified version of the Example, click Revert Example from the Sidebar. You will be asked if you want to lose your changes and reopen the Example in its original version. Click Yes.
If you continue with a modified version, just be aware that screen shots or other functions may not operate exactly as described in this tutorial.
When complete, your Drone Example with its data appears in the main window.
3. Review Incidents and Problems
Note: You can change the default terms "Incidents" and "Problems" used in Relyence FRACAS. Therefore, you may see your or your organization's preferred terms instead of "Incidents" and "Problems" in the software. For ease of understanding, the default terms of Incidents and Problems will be used throughout this documentation. For details on customizing these terms see the Relyence FRACAS Settings topic.
Before we begin the FRACAS tutorial, it is important to note that FRACAS processes are typically very unique to each organization. Relyence FRACAS is completely customizable for your use, and this tutorial is meant to show an example setup. This tutorial will not cover how to customize the Relyence FRACAS interface to meet your needs. To find information on customizing Relyence FRACAS, please review Customizing the FRACAS Interface. Also, our implementation team can help you in customizing the Relyence FRACAS interface to meet your needs. We can also aid in defining your process, or establishing a new FRACAS. Feel free to contact us for details.
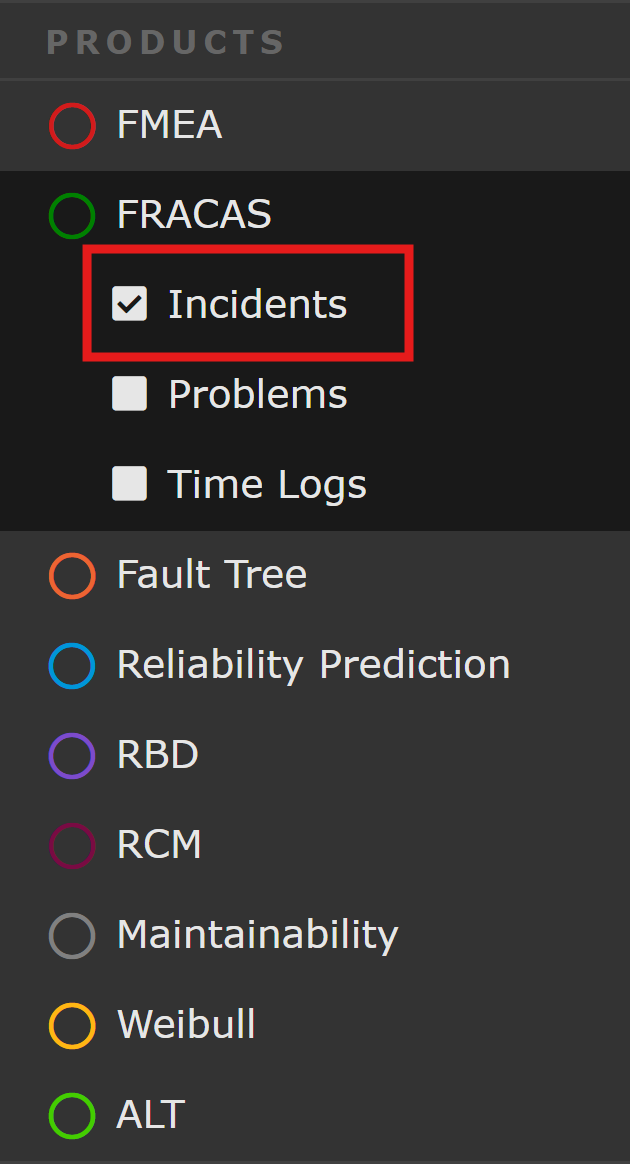
Relyence FRACAS has three components: Incidents, Problems, and Time Logs. You are not required to use all three of these entities. This Example demonstrates the usage of Incidents and Problems. Time Logs are used if you want to use FRACAS to compute field-based metrics. For more details about Time Logs, refer to the Using FRACAS Time Logs topic. To switch between entities, click Incidents, Problems, or Time Logs in the Sidebar menu under FRACAS.
Incident reports, sometimes referred to as IFRs (Incident Failure Reports), are the heart of any FRACAS process. An incident is any item you want to track - an issue, a failure, a customer complaint, etc. In this Example, an Incident represents a customer reported failure or issue.
If the Incident Table is not in view, click Incidents in the Sidebar menu under the FRACAS heading.
The Incident Table displays a list of all the Incidents logged to date associated with the item selected in the Analysis Tree. In this case, the Incidents associated with the Quadcopter Drone are displayed.
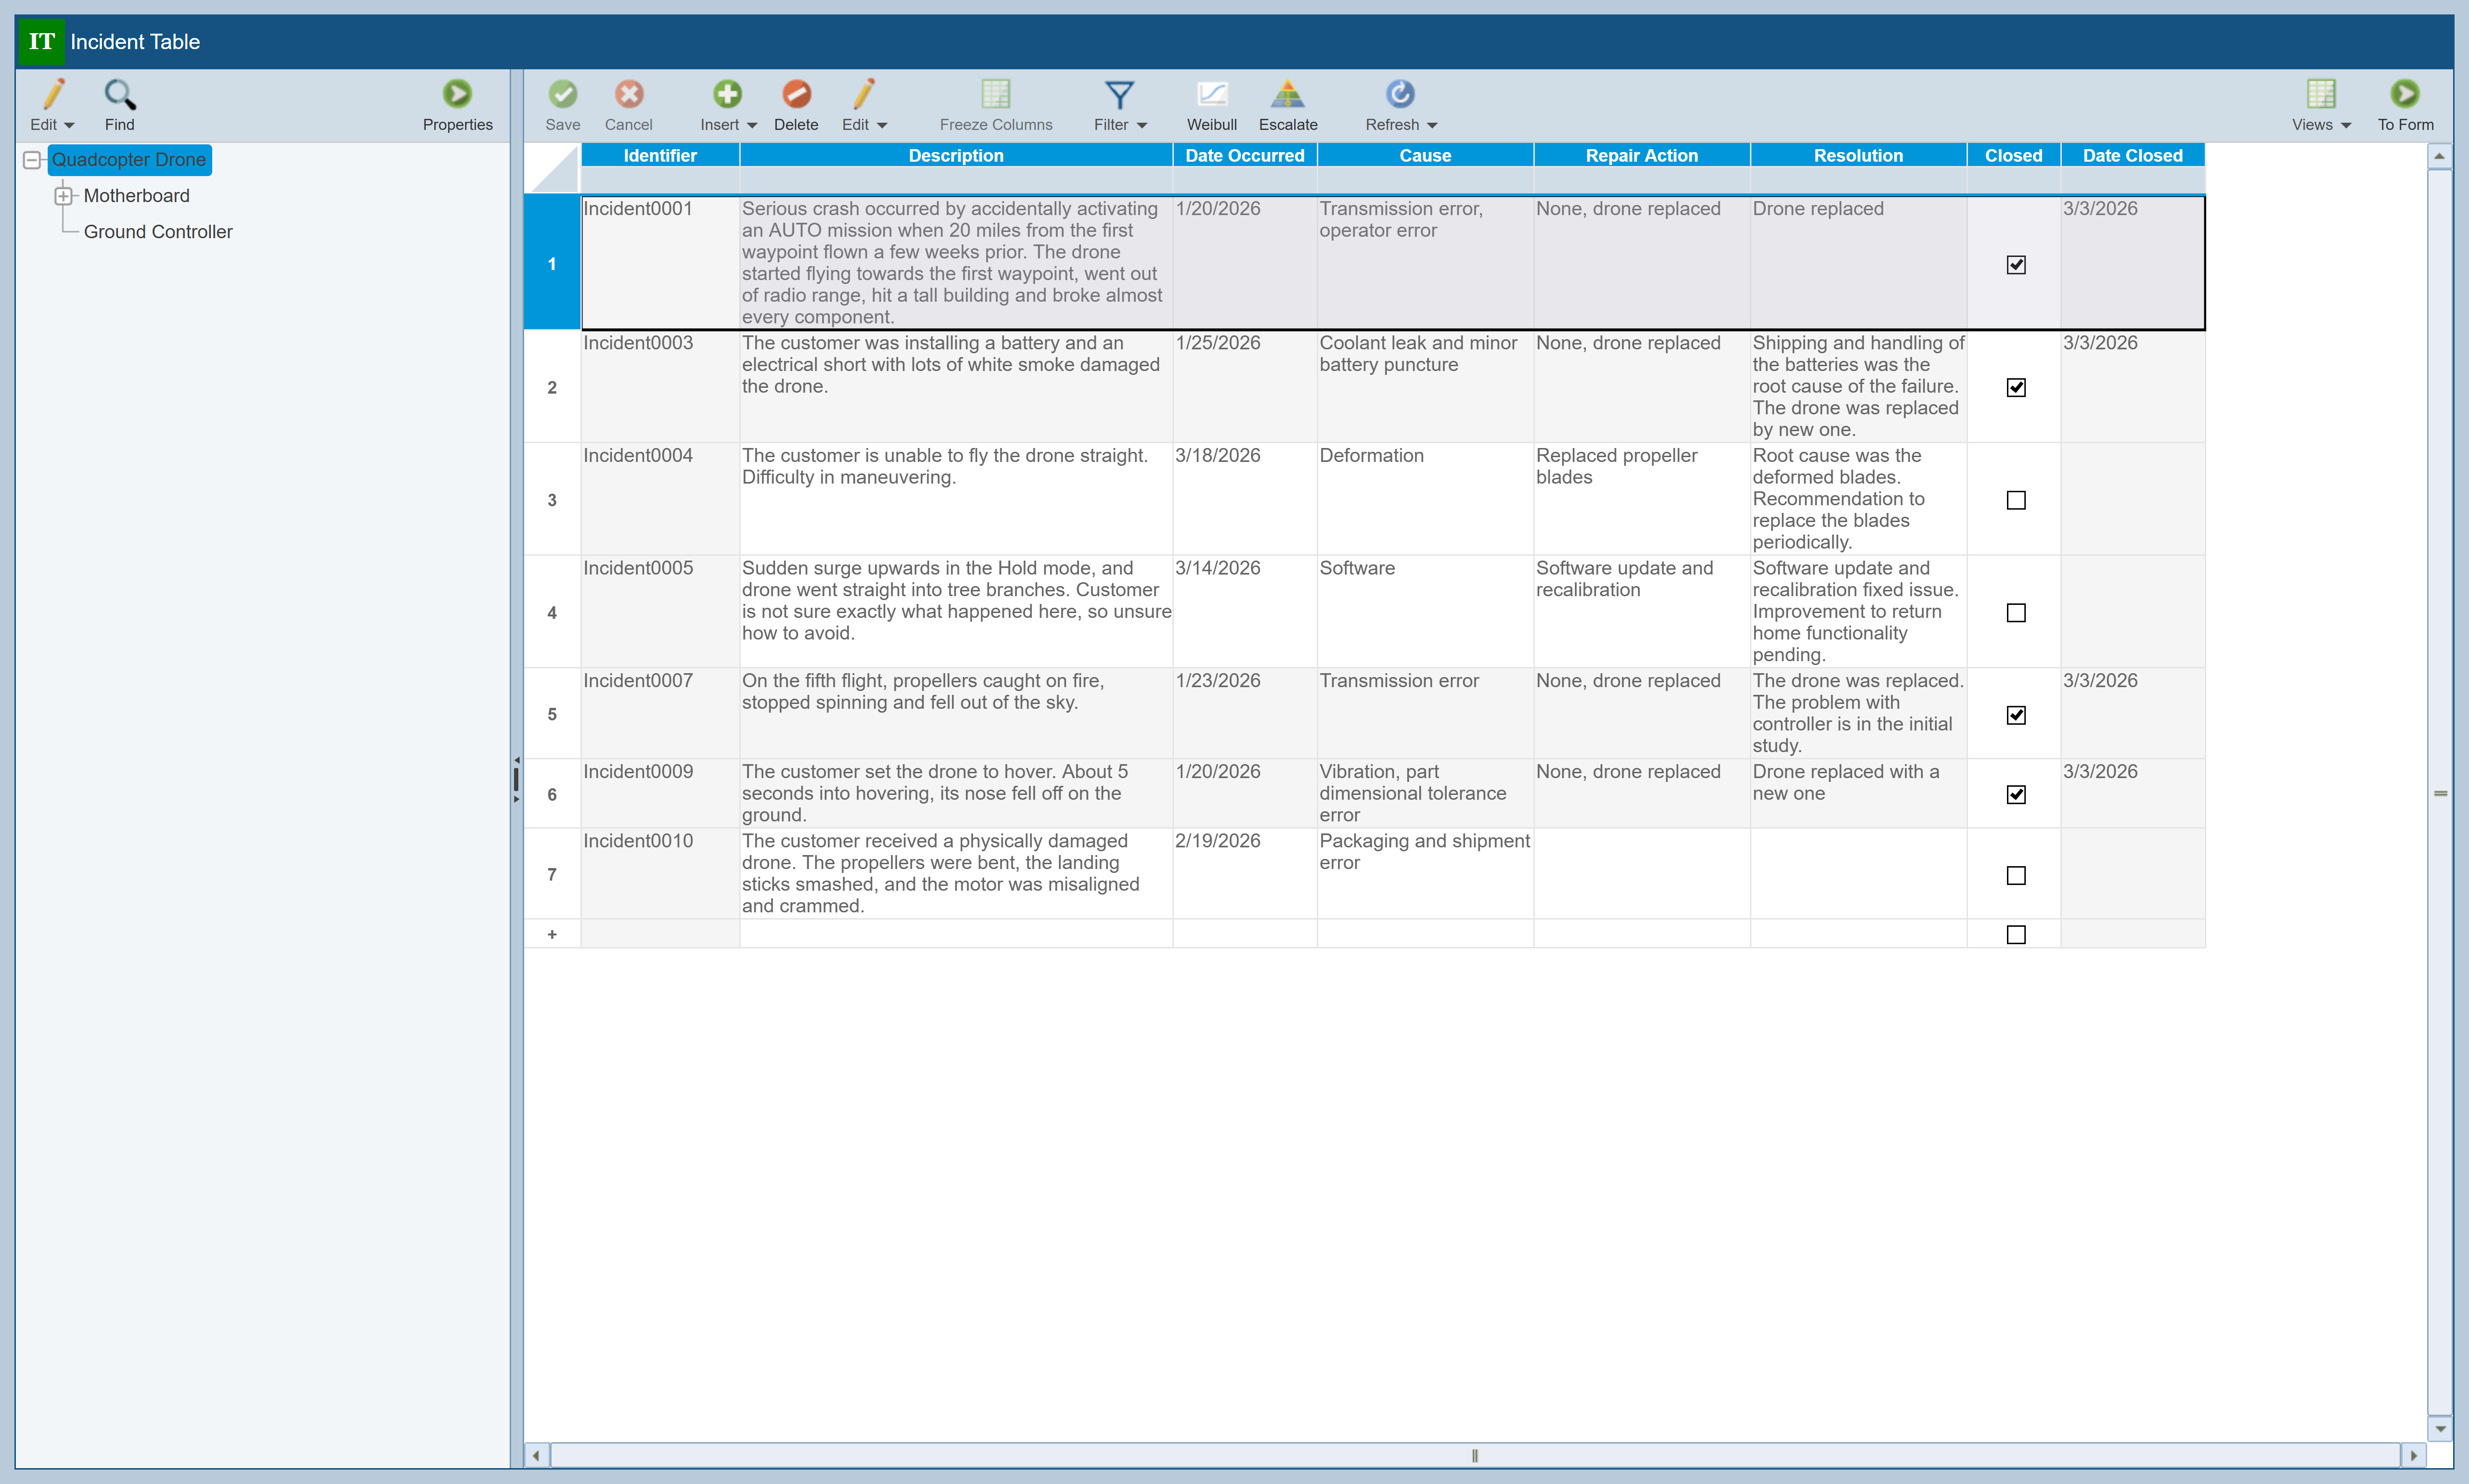
To view Incidents associated with other Subsystems in the Analysis Tree, click on the various Subsystem names in the left-most Analysis Tree pane. When finished, click to select Quadcopter Drone in the Analysis tree.
You may or may not want to use the Analysis Tree in Relyence FRACAS. You can use your Analysis Tree to model your product or system and then tie reported issues to the appropriate Analysis Tree item. However, you may just want to log all your issues and not associate them to the Analysis Tree. Or, you can even log all your items and associate them to tree items at a later date if you decide to. For this tutorial using the Example Analysis, Incidents and Problems are associated with the appropriate items of the Quadcopter Drone as defined in the Analysis Tree.
If you do not want to use the Analysis Tree, you can hide it from view by clicking the left pointing arrow in the splitter control.
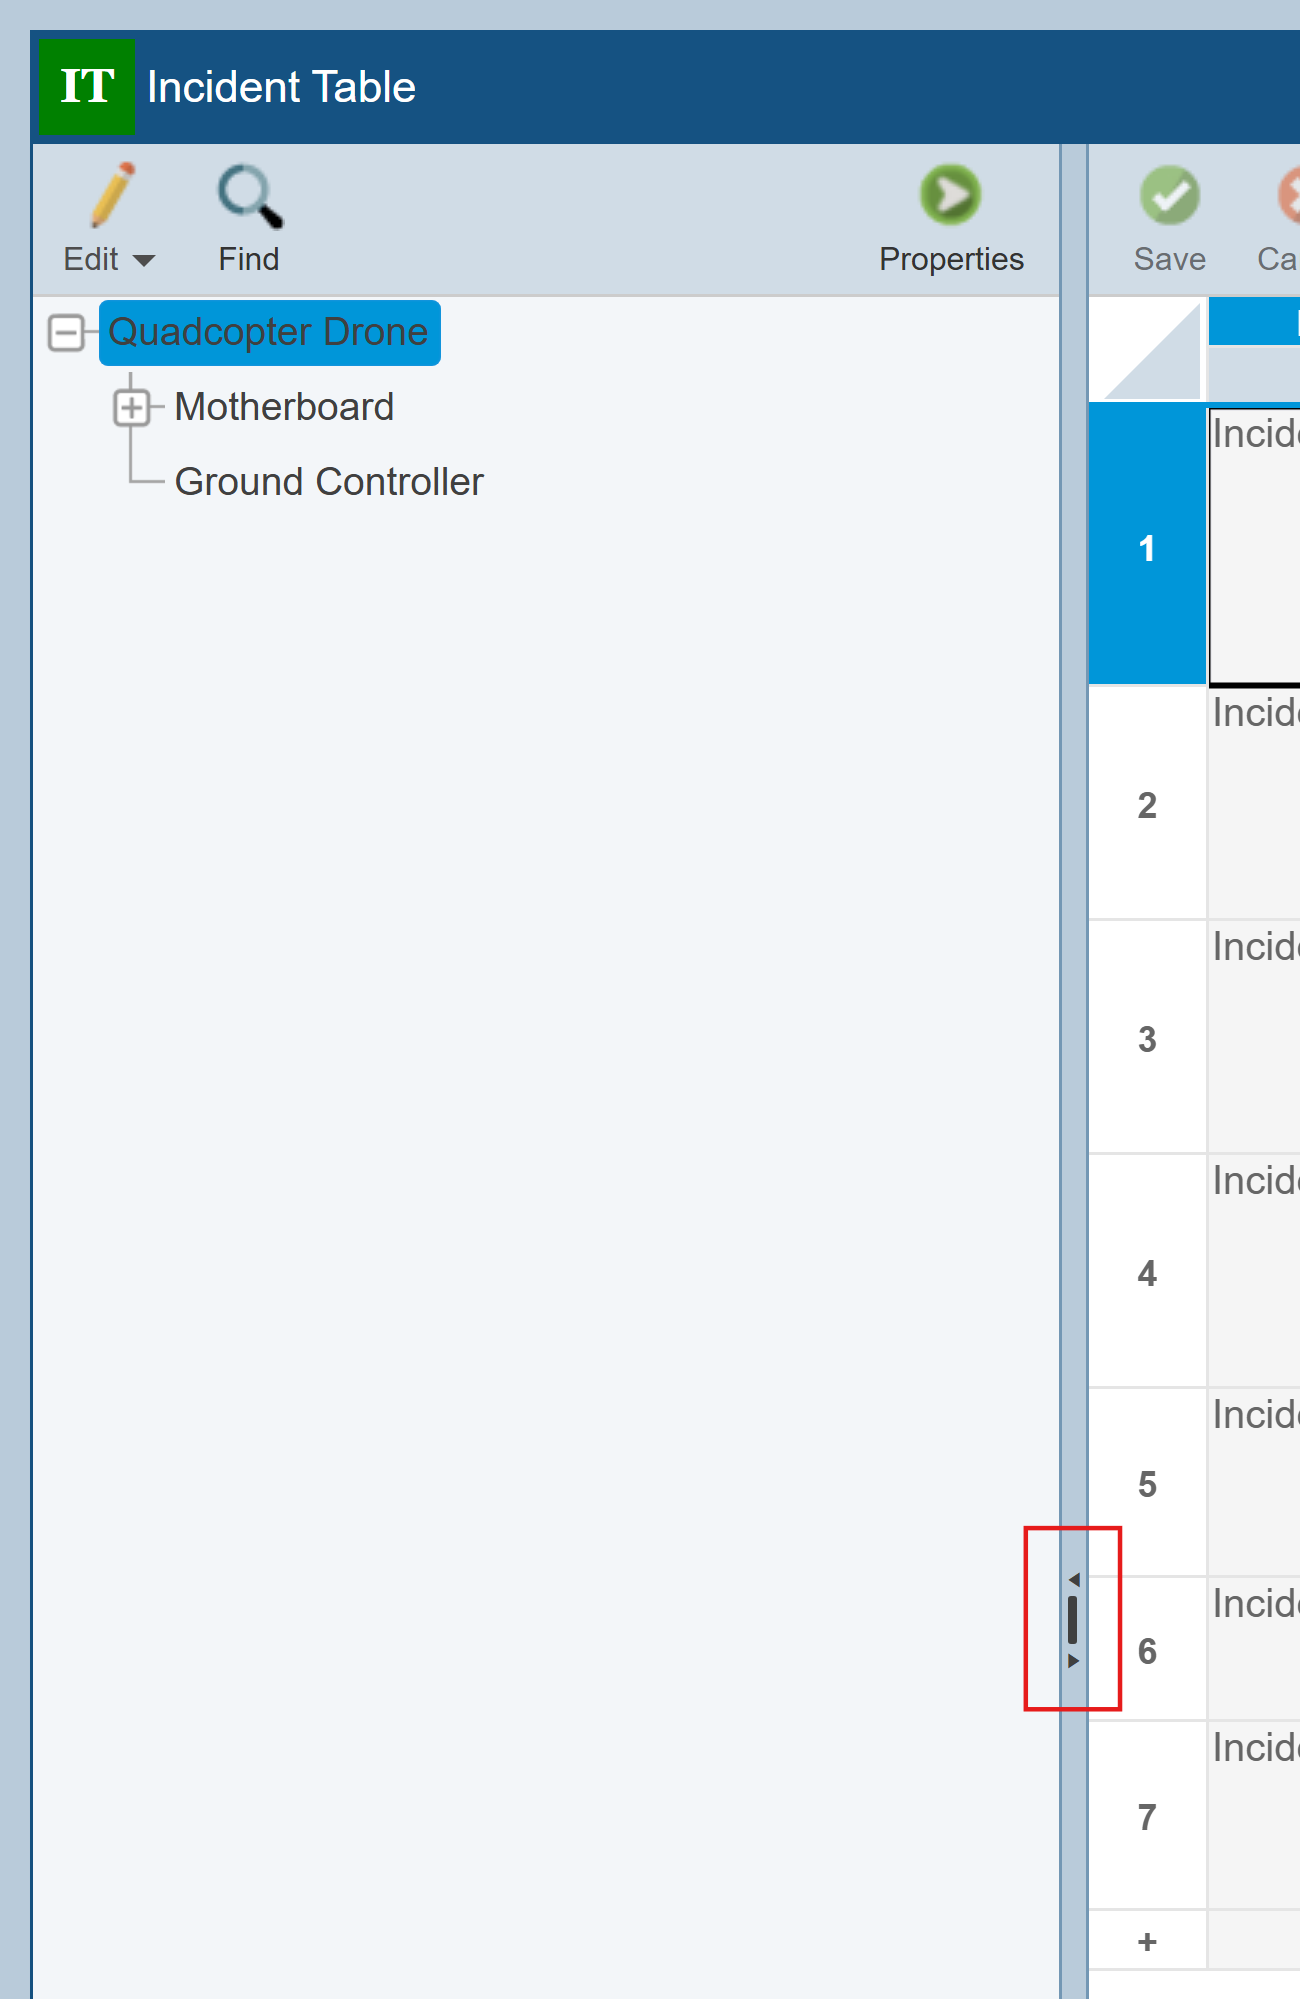
If you hide the Analysis Tree and want to show it again, just click the right pointing arrow in the splitter control.
You can also change which Incidents and Problems are shown in your Tables using the Show options on the dropdown from the Filter button in the toolbar.
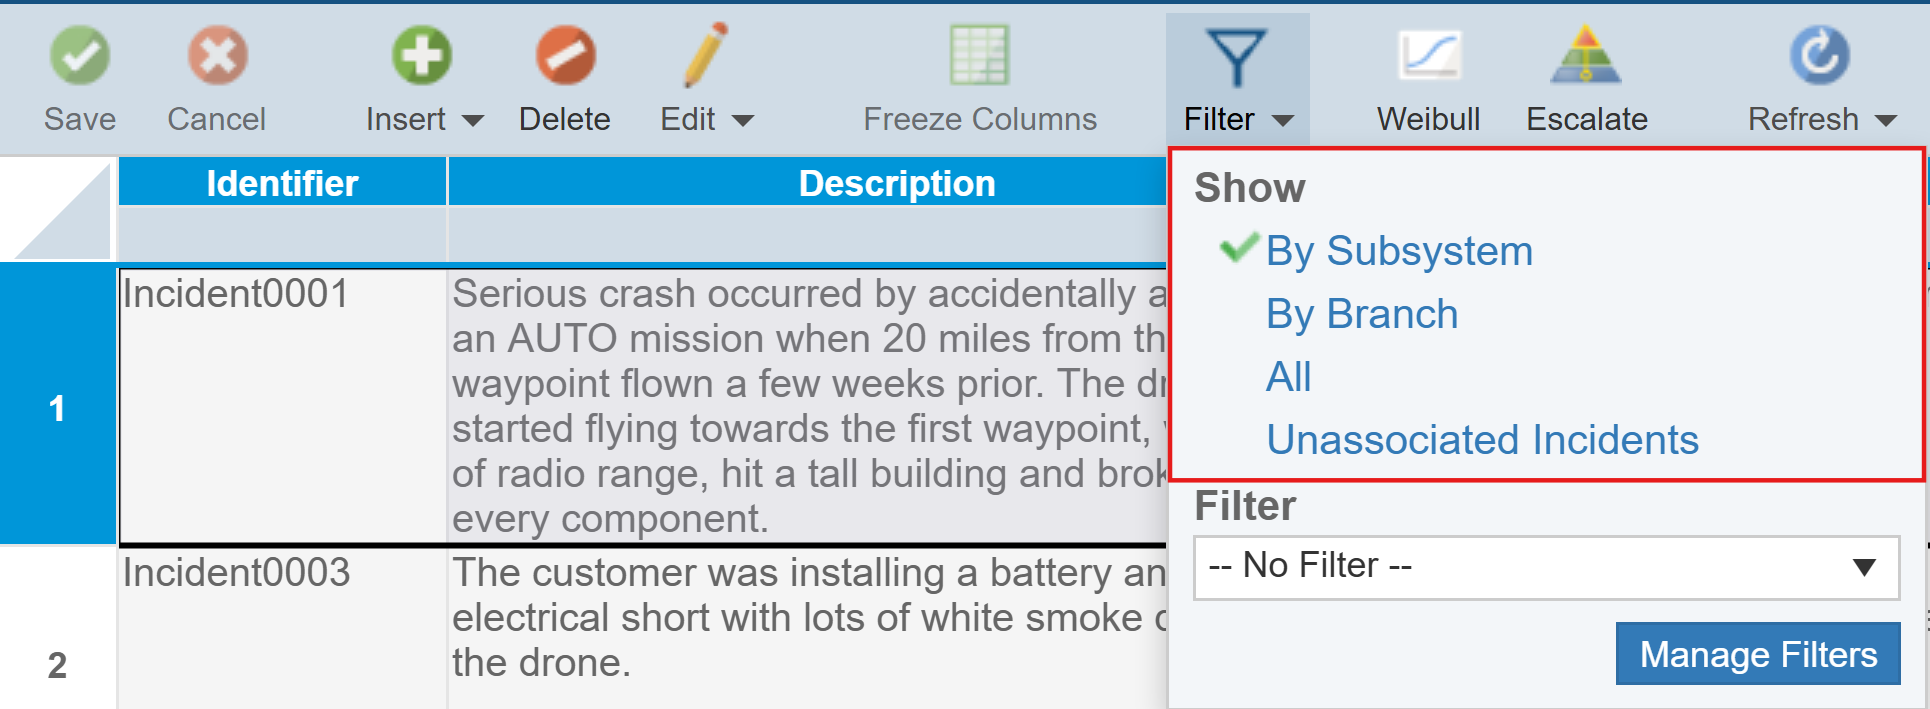
The Show options operate in the following manner:
- By Subsystem: The Incident or Problem Table includes the list of Incidents or Problems associated with the item selected in the Analysis Tree. This allows you to click through the items in your Analysis Tree and see the specific issues associated with that item.
- By Branch: The Incident or Problem Table includes the list of Incidents or Problems associated with the item selected in the Analysis Tree and all its children, i.e. all Incidents or Problems associated with the selected branch of the Analysis Tree. If this option does not appear, you do not have permission to use it; contact your Relyence Administrator for assistance.
- All: All Incidents or Problems are shown. If this option does not appear, you do not have permission to use it; contact your Relyence Administrator for assistance.
- Unassociated Incidents (Unassociated Problems when on the Problem Table): The Incident or Problem Table will show only those Incidents or Problems that are not associated with any tree item. This enables you to view unassociated issues and then associate them to tree items if you choose to.
Note that you can also apply filters to your Incident and Problem Tables to filter your FRACAS data in a manner that is helpful for you. See the Filtering FRACAS Data topic for details.
For this tutorial, make sure By Subsystem is selected.
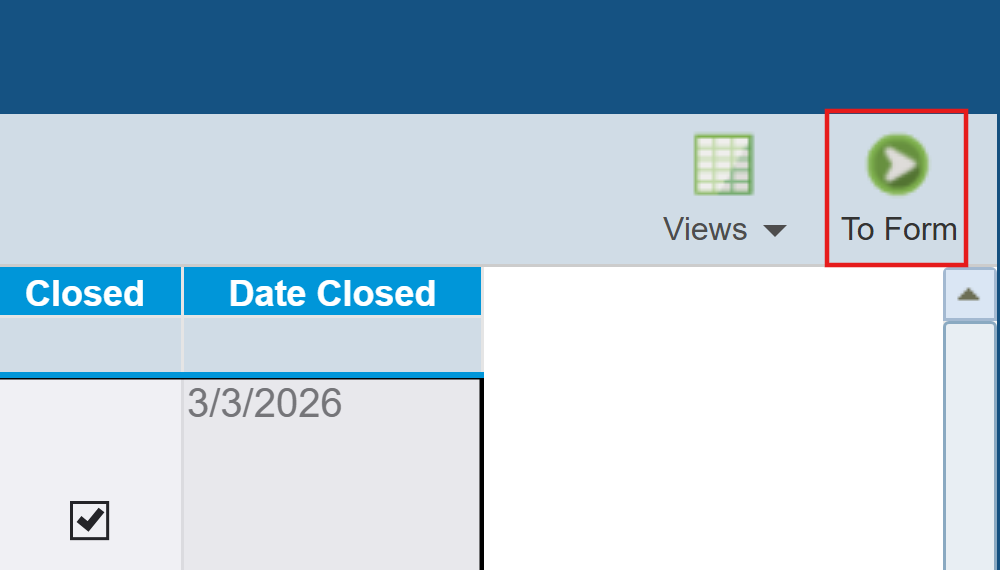
To review more details about a particular Incident, you go to the Incident Form. Make sure Incident001 in the Quadcopter Drone is selected in the Incident Table, and then click the To Form button in the toolbar.
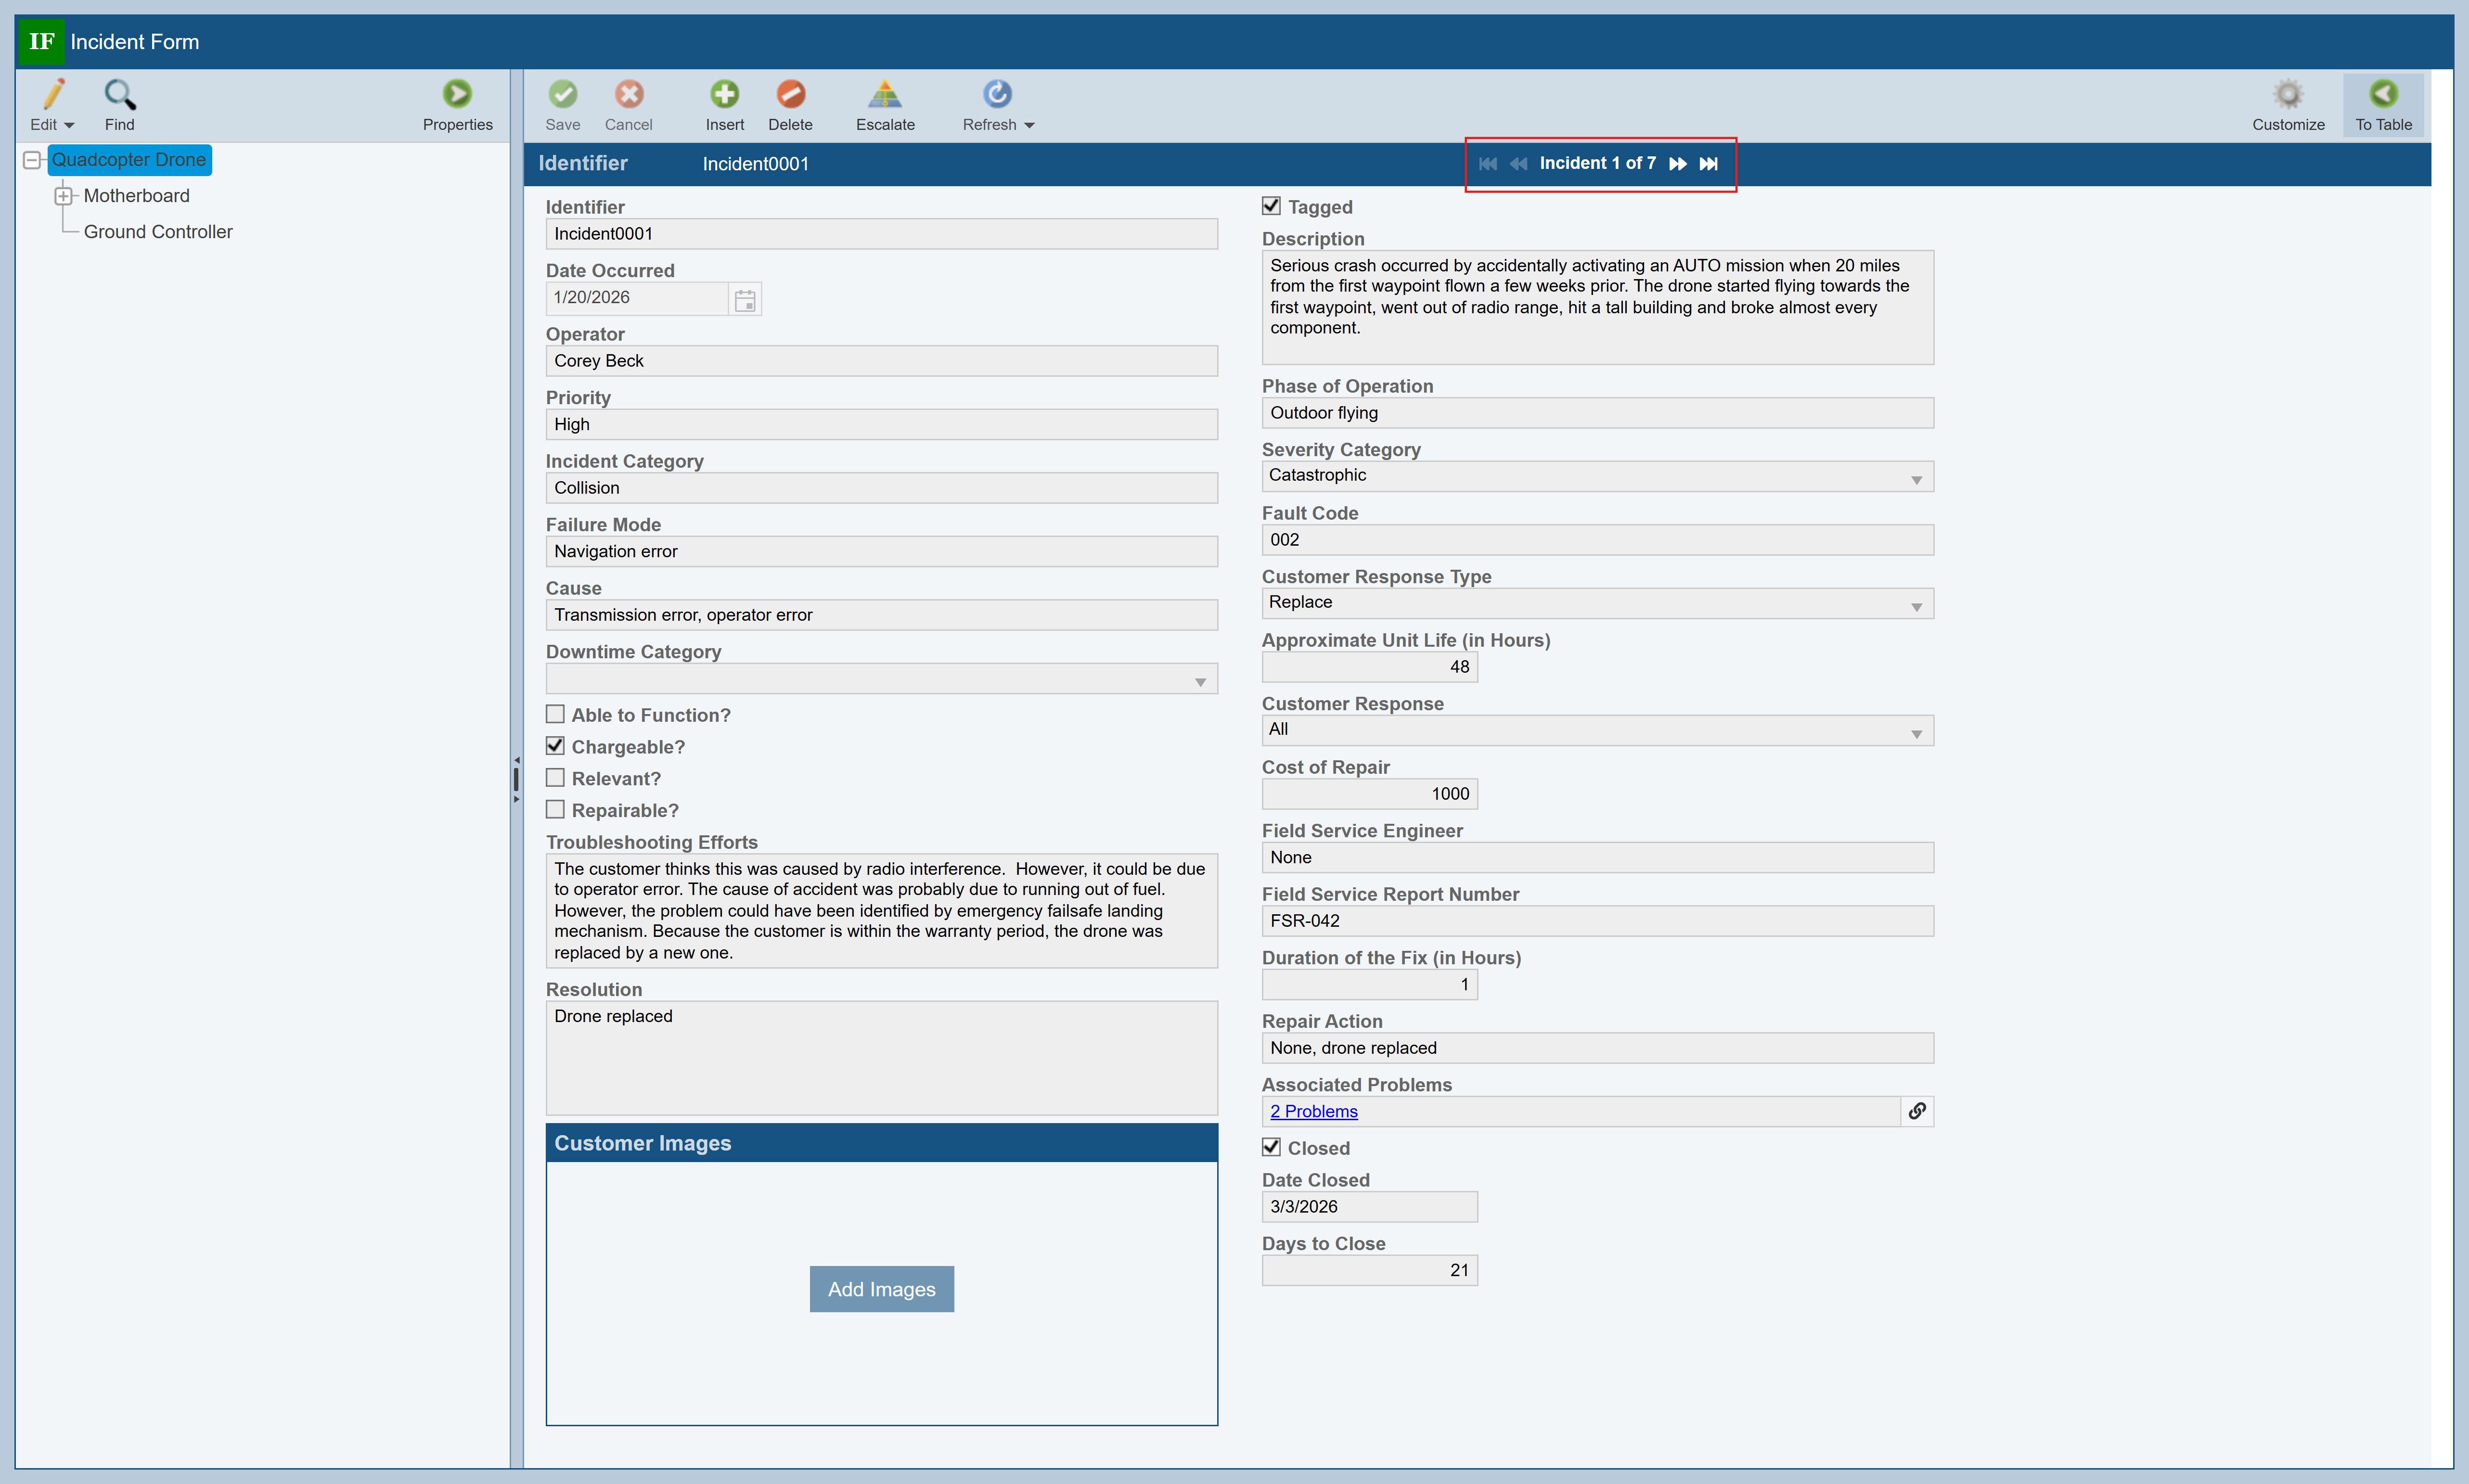
This will display a form with a number of data fields with specific details about the Incident. You can use the navigation buttons at the top of the form to move between Incidents and review and update information as needed.
When you are done reviewing the Incidents, return to the Incident Table by clicking the To Table button in the toolbar.
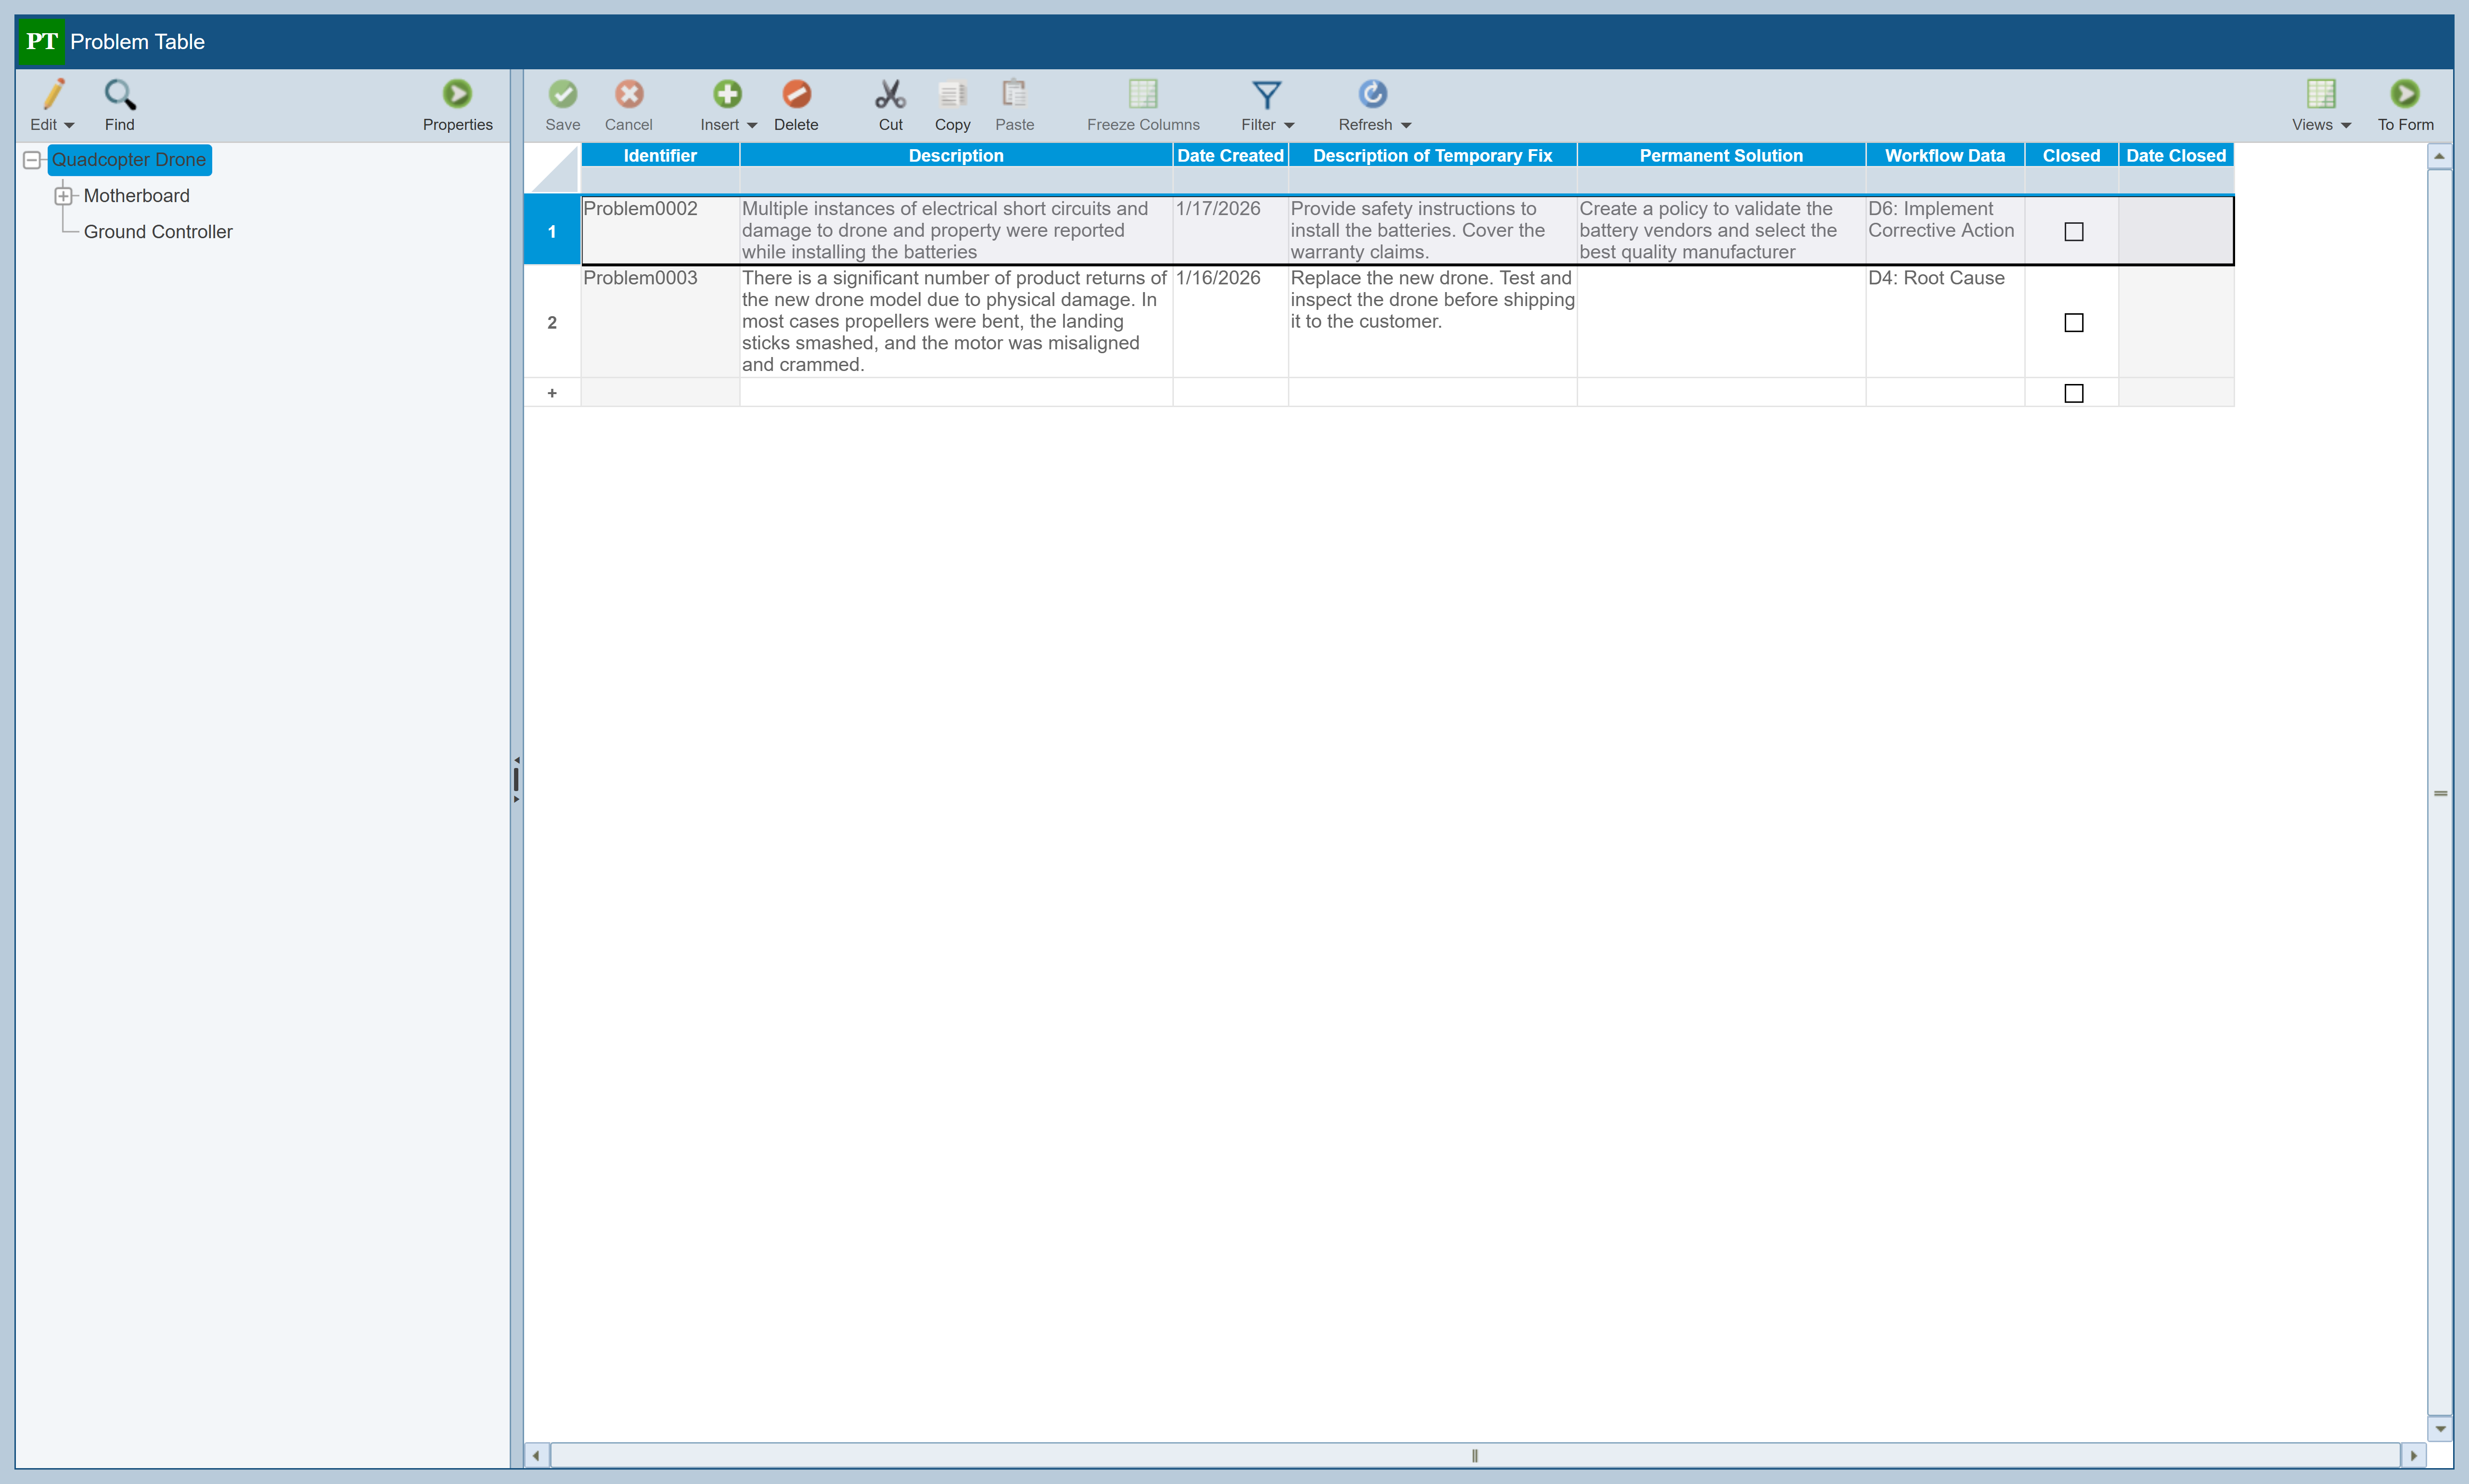
Now, click Problems in the Sidebar menu under FRACAS to display the Problem Table. The Problem Table, like the Incident Table, displays a list of the Problems being tracked.
Problems are used in order to track critical issues through a fully closed-loop corrective action process such as 8D, DMAIC or PDCA. Problems can also be a mechanism to allow you to group Incidents together; this enables you to track Incidents with common underlying causes or corrective actions together for more efficient tracking. In this Example, the Problems are defined based on the commonly used FRACAS 8D process. When an Incident, or a group of Incidents, is elevated to a Problem, a specific process is put into place to define, control, and ensure corrective action is completed.
Click on the To Form button in the toolbar to display the Problem Form.
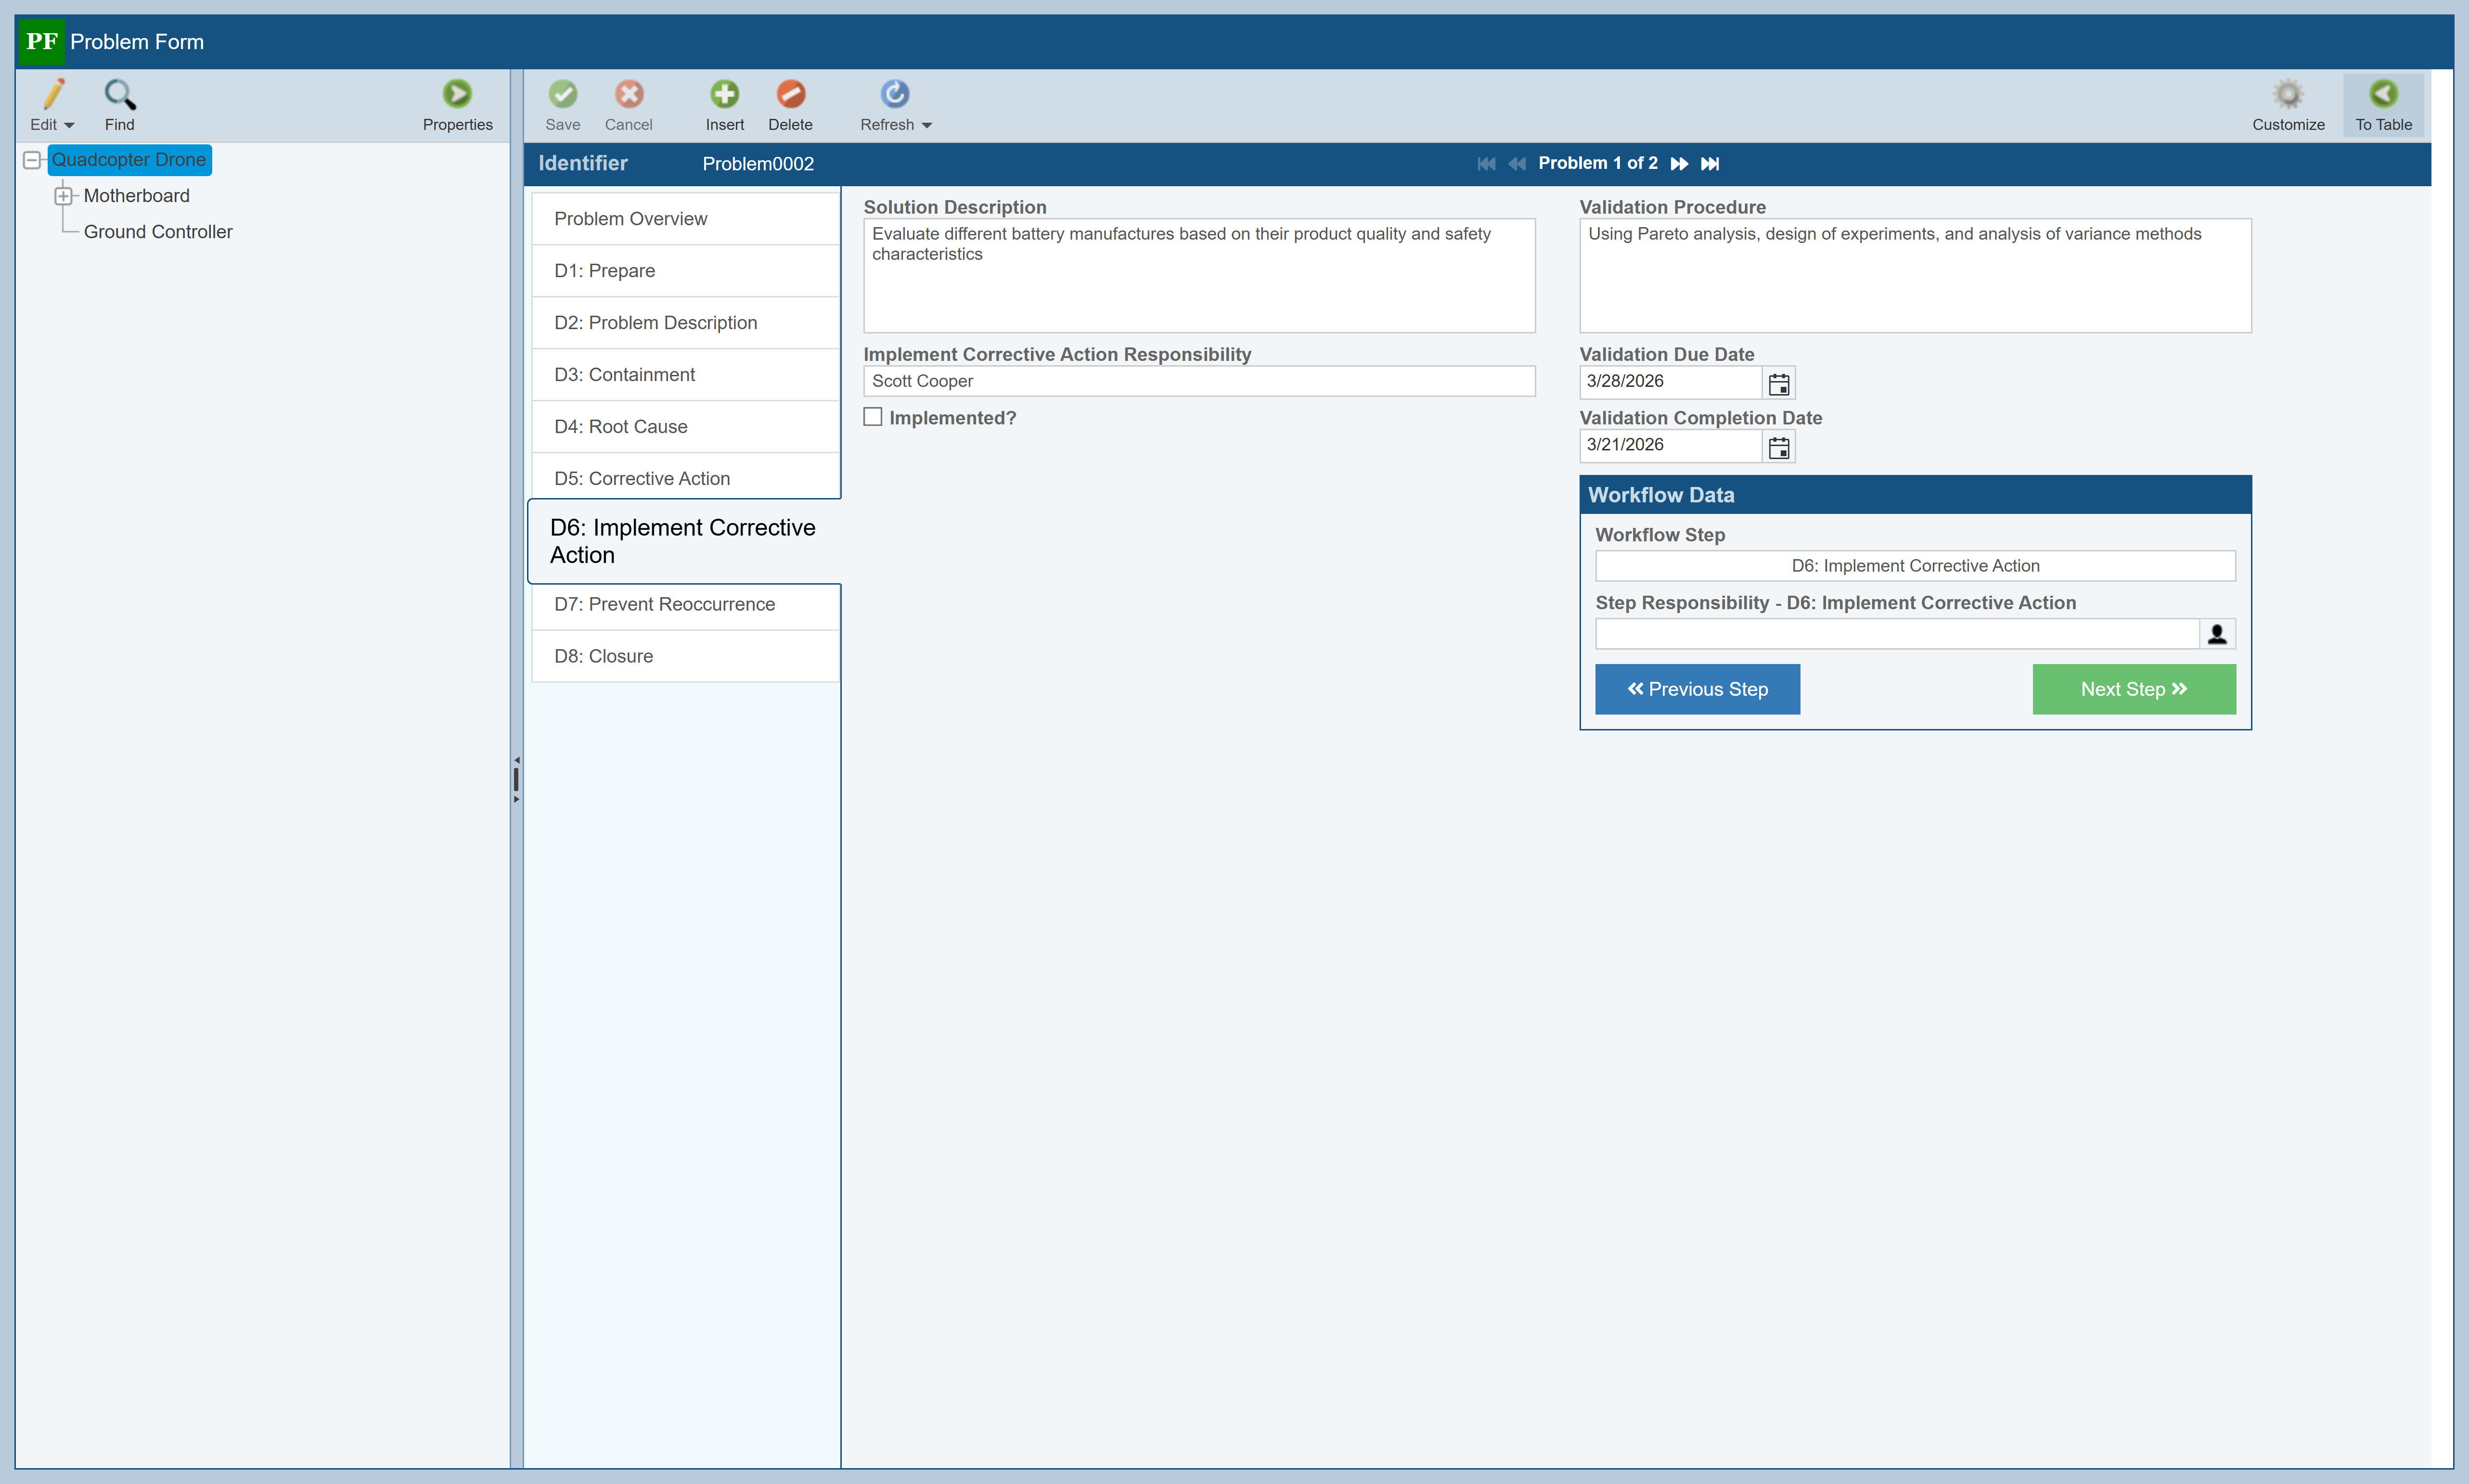
You can navigate through the data for each Problem using the navigation buttons just as with Incident Forms. Notice that as you navigate through the Problem Forms, you are automatically taken to the appropriate form for whatever step in the Problem workflow you are currently on. This Example uses the common 8D process for Problem resolution, and you can see how the various Problems are progressing through the workflow. You can click on any of the tabs on the left side of the Problem Form to review the data associated with each step.
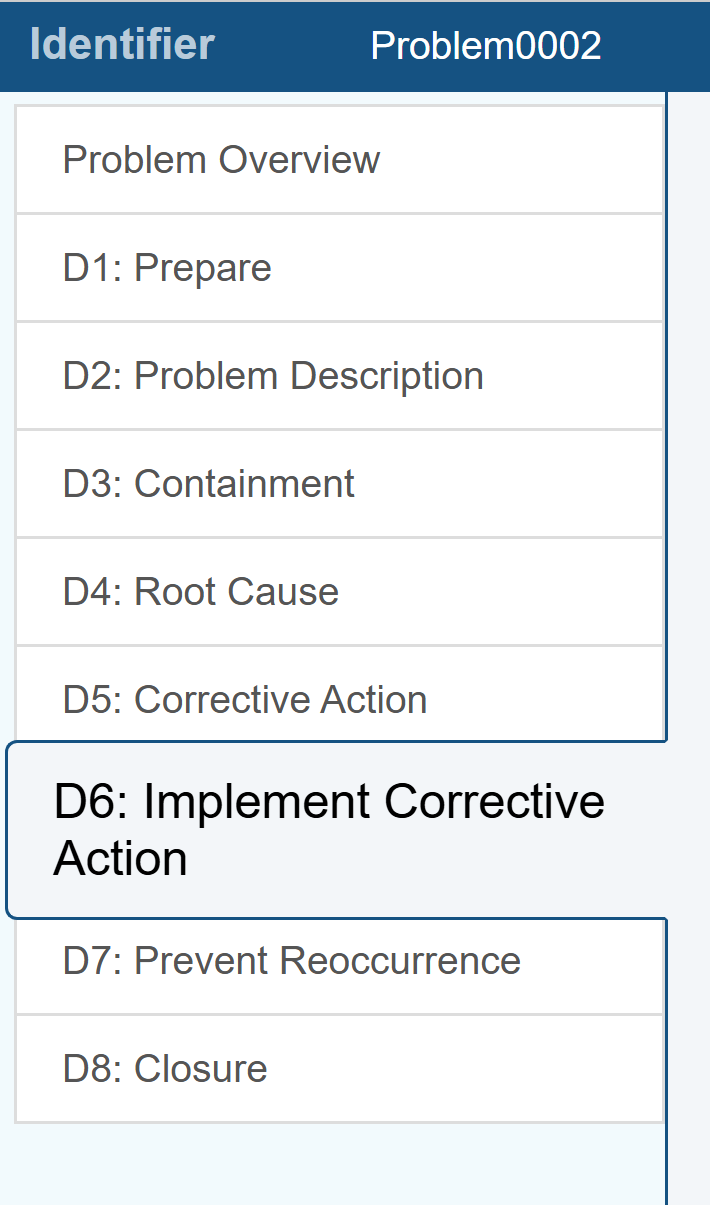
Go to the second Problem (Problem0003) in the Problem Form using the navigation buttons. Problems allow you to group related Incidents together for corrective action and close out. Click on the first tab on the left labeled Problem Overview.
Notice the Associated Incidents table. This special field indicates that there are two Incidents associated with this Problem and shows the details for those associated Incidents in the table. If needed, you can use the Edit button to associate additional Incidents to this Problem. No changes need to be made for this example.
Also notice the Associated Subsystems data field. This field allows you to associate Problems to specific subsystems in your Analysis Tree. Clicking the link icon brings up a dialog that allows you to associate or disassociate Incidents to a specific Subsystem. No changes need to be made for this example. You can also associate your Incidents to subsystems in the same manner.
When you have finished reviewing the Problem Forms, click the To Table button in the Problem Form toolbar to return to the Problem Table.
4. Report
You can generate a report on any element of your FRACAS.
To generate a report of your FRACAS Incidents, make sure the Incident Table is active by selecting Incidents in the Sidebar menu under FRACAS.
Click Report from the Sidebar.
The Report Options dialog appears.
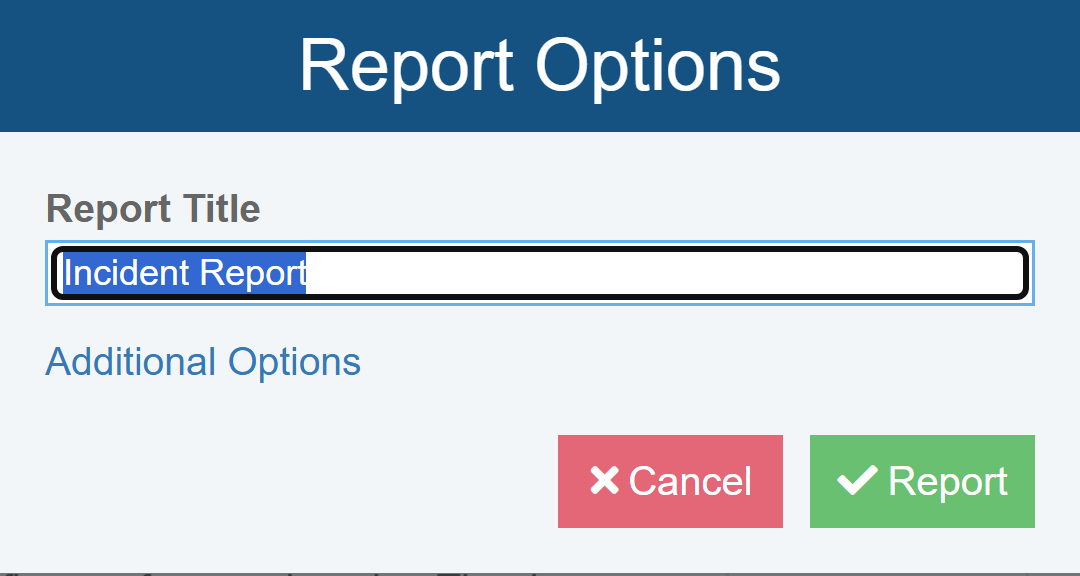
Keep the default Report Title "Incident Report".
Note that you can click the Additional Options link to set additional reporting options. See Generating FRACAS Reports for more details.
Click Report to generate the report.
The report appears in a new browser tab.
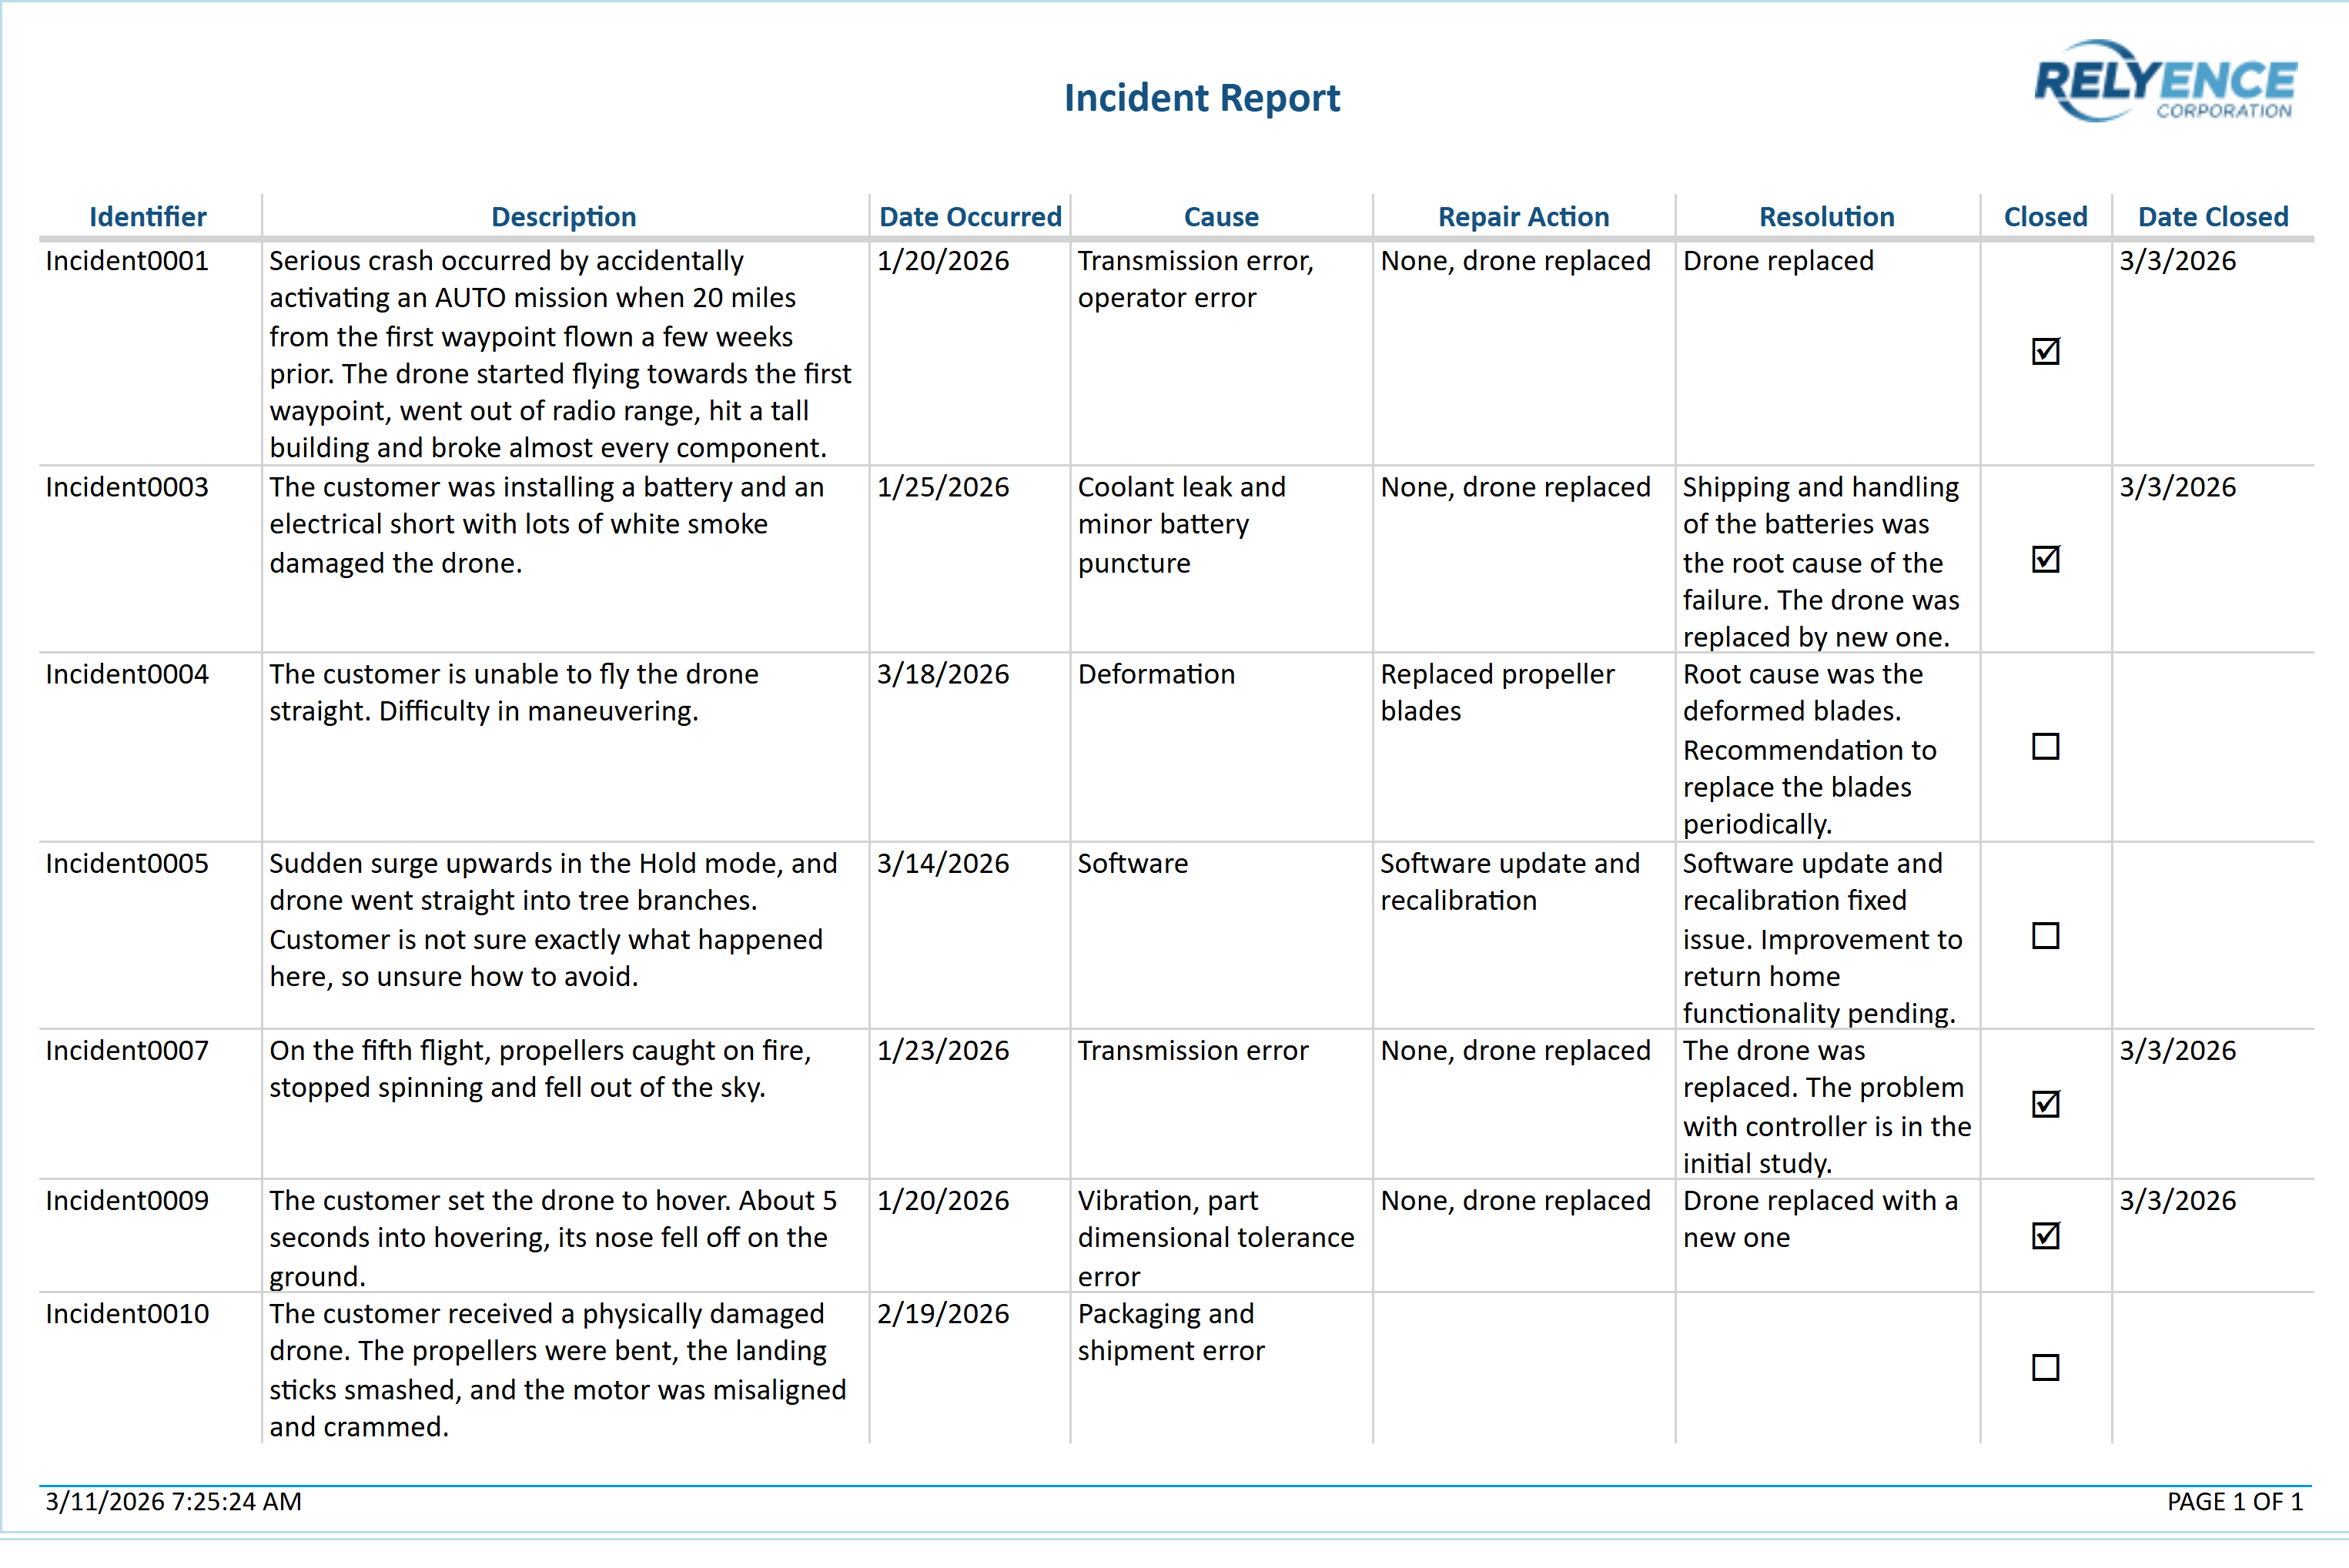
You can print the report, or save it in a PDF, Excel, PowerPoint, TIFF, or Word format.
Close the browser tab when you are done viewing the report.
You can also generate a report of the Incident Form data. Click the To Form button in the toolbar.
Click Report in the Sidebar. The Report Options dialog for the Incident Form appears.
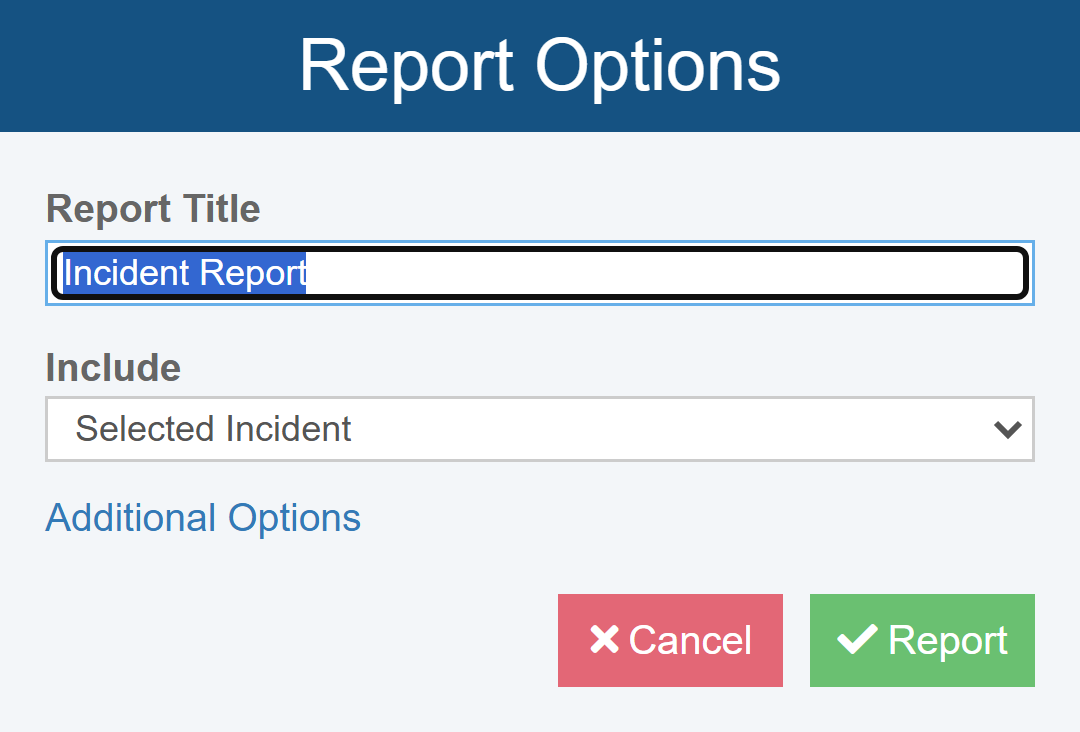
Keep the default Report Title "Incident Report".
For Include, select Selected Incident.
Note that you can click the Additional Options link to set additional reporting options. See Generating FRACAS Reports for more details.
Click Report to generate a single page report for this Incident.
Again, close the browser tab when you are done viewing the report.
Click the To Table button in the Incident Form toolbar to return to the Incident Table.
In a similar manner, you can generate reports for your Problem Table and Problem Form.
5. Add FRACAS Data
We are now going to add an additional Incident to see how you would log and track issues as they occur.
In this case, a customer has called in to complain of a hard landing.
Make sure that the Quadcopter Drone is selected in the Analysis Tree. Go to the empty row at the bottom of the Incident Table.
![]()
Click in the cell for Description. Enter the following data, using the Tab key to move to the next cell as you complete data entry for each cell.
Description: The customer was flying the drone and something caused it to return to the take-off point. It landed hard and damaged the landing pads. Notice that once you press Tab after entering the Description, the Identifier is automatically filled in for you. Relyence FRACAS automatically generates the Identifiers for your Incidents and Problems. You can customize the autonumbering if you would like under Properties in the Sidebar. For more information on Incident and Problem Identifier autonumbering customization, refer to details in the Customizing Incident and Problem Identifier Autonumbering section in the FRACAS Properties topic.
Date Occurred: Today's date is automatically filled in. You can enter a different date if you prefer, or use the date control dropdown to select it from the calendar.
Cause: Hard landing
Repair Action: Replace damaged landing pads
Resolution: Emergency landing functionality needs to be improved
Closed? Leave the Closed checkbox clear. Closed has a special meaning in FRACAS and indicates that Incident resolution is complete. This Incident is not yet Closed.
Date Closed: Relyence FRACAS will automatically fill in the Date Closed when you select the Closed checkbox.
Also note that on the Incident Table, Problem Table, and Time Log Table in Relyence FRACAS, keyboard support for Insert is supported using the <Insert> key and <Ctrl>+<Shift>+<NumPad +>.
Click the To Form button to go to the Incident Form.
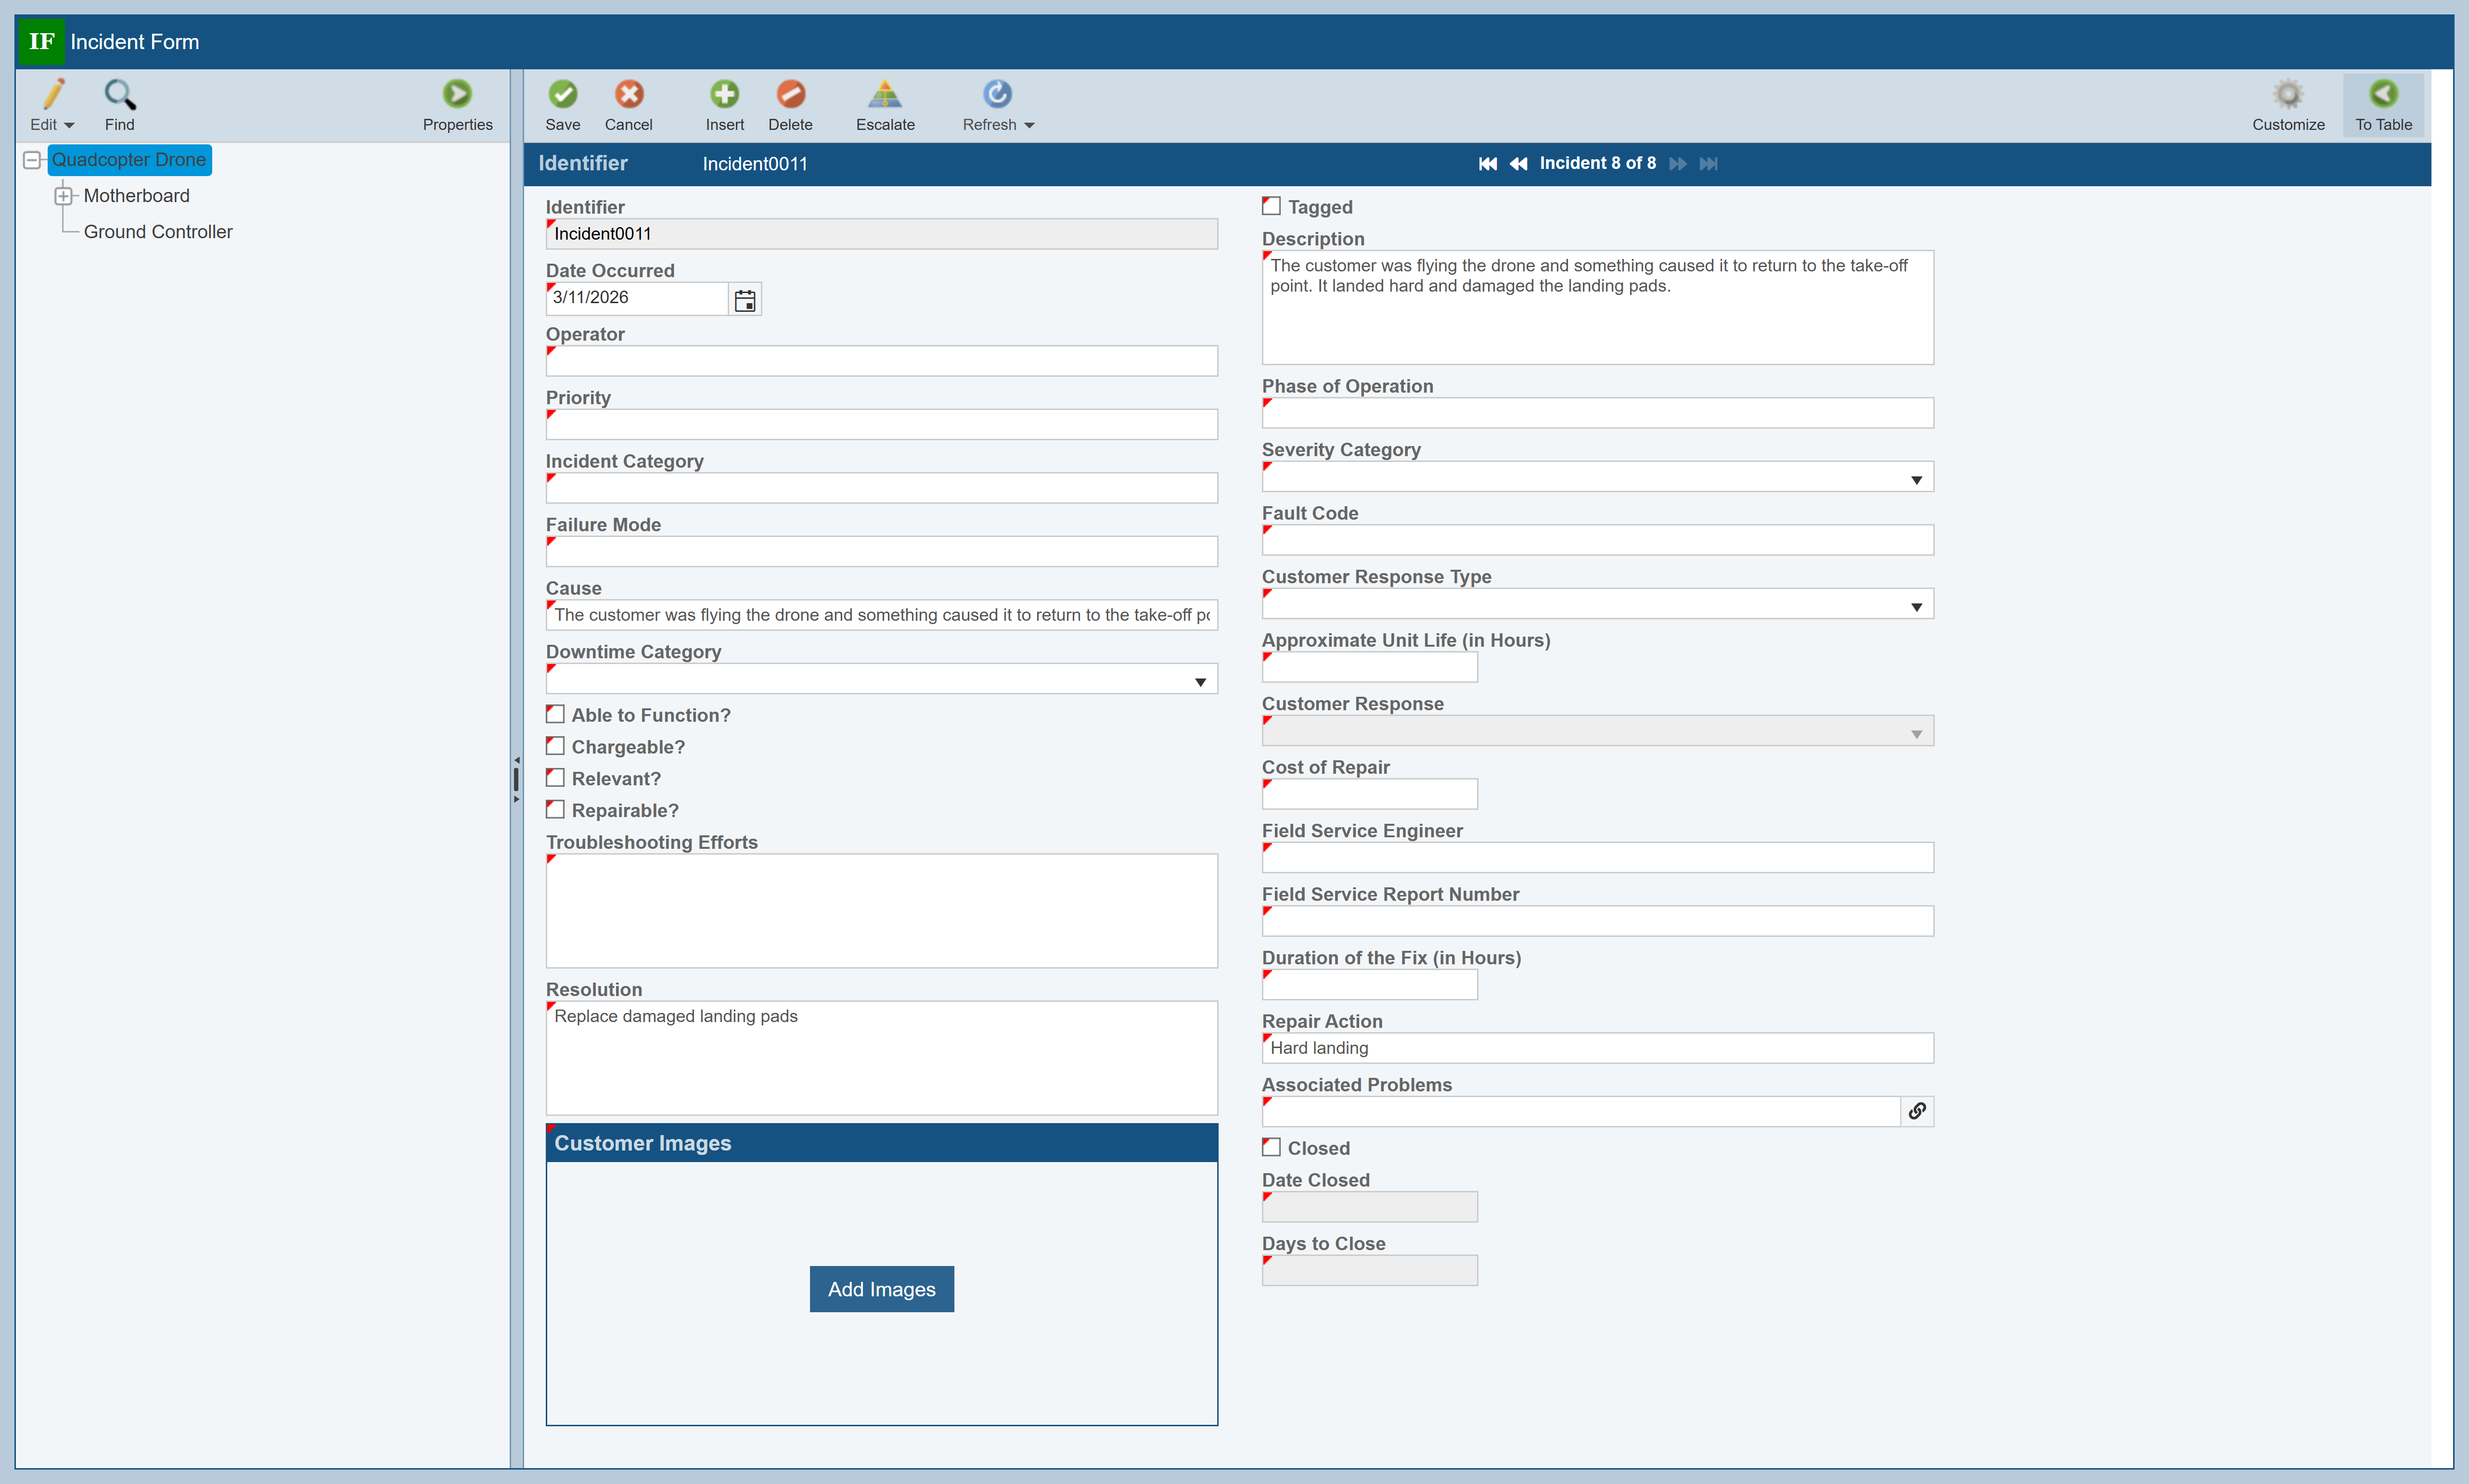
Notice that the Incident data you entered in the Incident Table is filled in. Also notice that the fields are marked with a red mark in the upper left corner, just as they were on the Incident Table. The red marks indicate that this data has not yet been saved.
We just need to complete a few additional details. Add this information:
Operator: Stephanie Dawson
Priority: High
Incident Category: Hard landing
Failure Mode: Physical damage
Downtime Category: Unscheduled
Repairable?: Yes (select checkbox)
Troubleshooting Efforts: The drone may have returned home due to loss of wifi because the customer said they were flying the drone a long distance away. Though the return home sequence operated well, the landing should not be hard enough to damage the unit.
Phase of Operation: Landing
Severity Category: Marginal
Fault Code: 010
Customer Response Type: Repair
Approximate Unit Life (in Hours): 10
Customer Response: Drone
Cost of Repair: 10
Field Service Engineer: None
Field Service Report Number: Leave this field blank because there was no field service for this Incident.
Duration of Fix: 0.5
Again, note that the fields on the Incident Table and Incident Form are completely customizable - this is just one example.
Once the corrective action has been completed, you would close out this Incident by marking is Closed. Assume corrective actions have been completed and click to mark the Incident as Closed. When you do this, note how Relyence FRACAS automatically fills in the Date Closed for you.
Click on the To Table button to return to the Incident Table. Notice that the newly entered data is marked with red tags in the upper left corner of the cells. This indicates that data has been entered but is not yet saved. To save the data, click Save in the toolbar. The data is saved, and the red tags no longer appear.
Now, let's move to the Problem Table and see if this new Incident should be grouped in with a Problem already created. Click Problems in the Sidebar to display the list of Problems associated with the Drone. This new incident does not appear to be similar to the Problems listed. Click on Ground Controller in the Analysis Tree. Notice that Problem0001 refers to an uncontrolled drone, similar to what was reported in the new Incident. This suggests we should associate the new Incident to Problem001 so duplicate effort does not occur for corrective action.
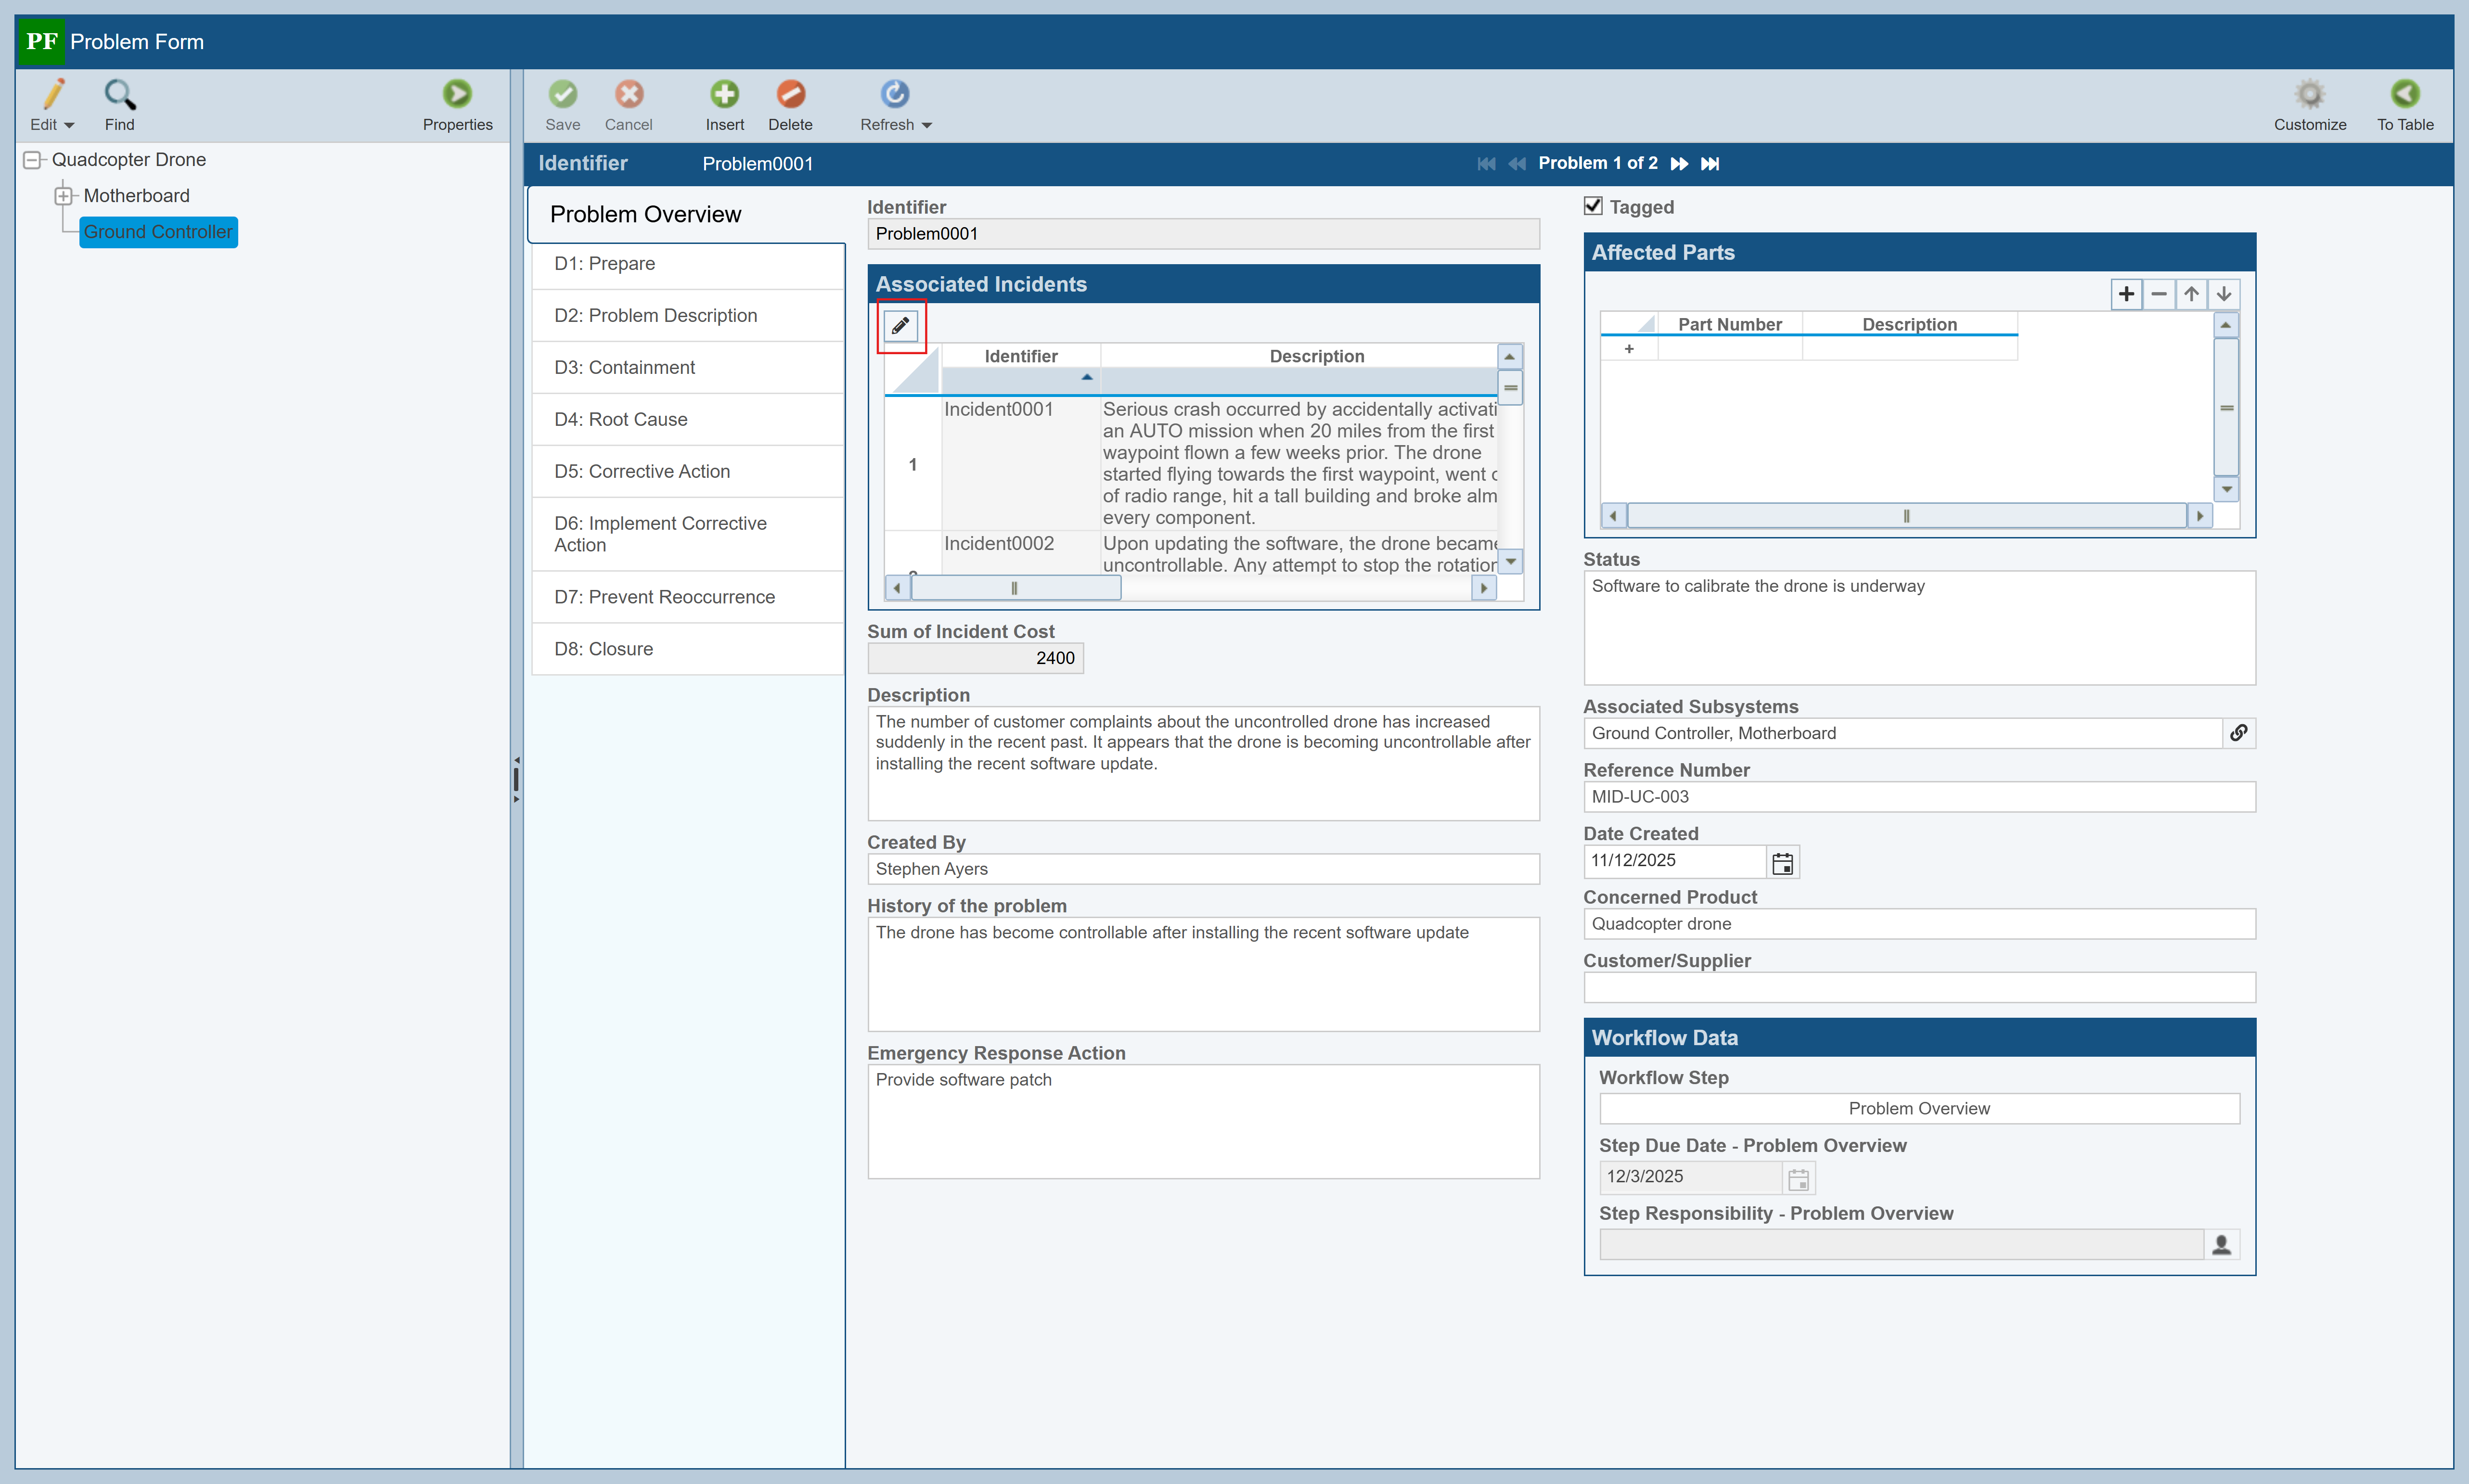
To associate our new Incident to this existing Problem, click on the row for Problem0001 in the Problem Table, and then click on the To Form button to display the Problem Form.
Click on the left tab labeled Problem Overview.
In the Associated Incidents field, click the Edit button.
Scroll down in the list of Incidents to find Incident0011 and click the checkmark to associate the Incident with this Problem (Problem0001).
Where the Edit button was, click the checkmark Close Editor button.
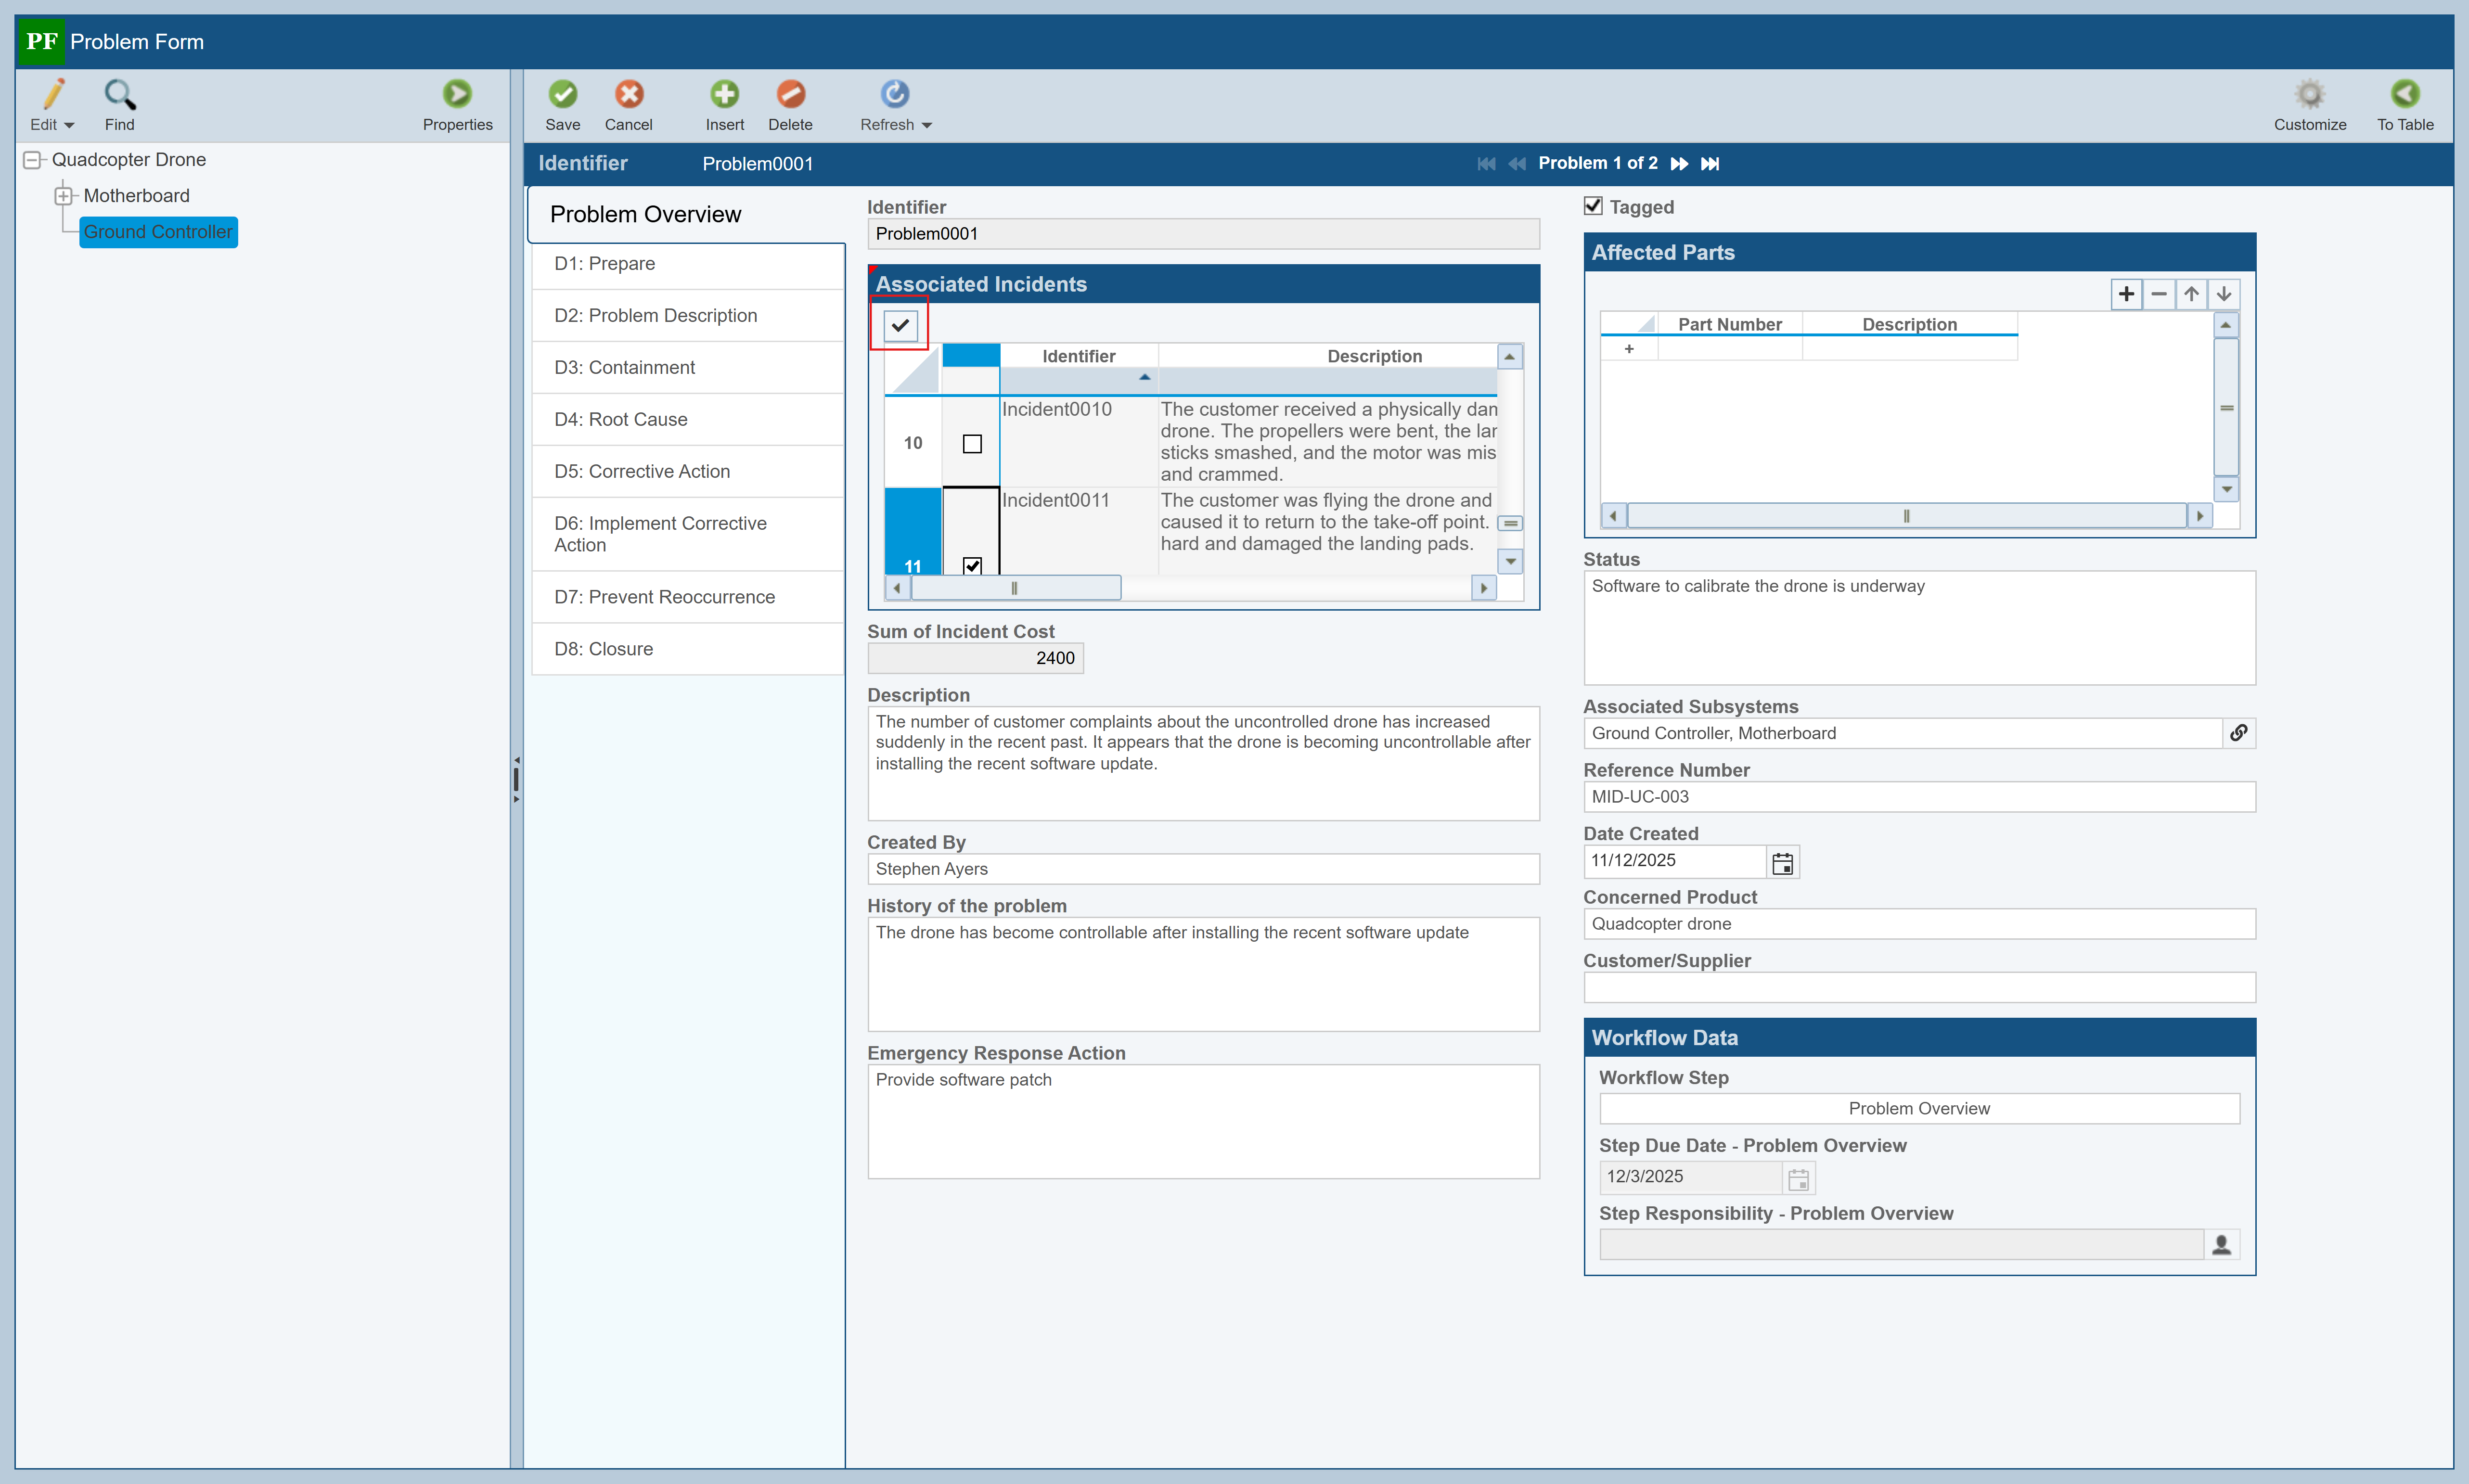
Click Save to save your changes.
6. Calculating FRACAS Metrics
Relyence FRACAS has the ability to compute an array of metrics based on your field data. For example, you can compute Failure Rate, MTBF, MTTR, and Trend Score. For more information about Relyence FRACAS calculated metrics, see the FRACAS Calculations topic.
Additionally, you can define your own custom calculations in Relyence FRACAS to compute your own field-based metrics. See the Creating Your Own FRACAS Formulas topic for more details.
7. The Analysis Tree and Analysis Diagram
Relyence FRACAS supports modeling your product or system visually using the Analysis Diagram. The Analysis Tree pane toggles between the Analysis Tree view and the Analysis Diagram view using the Edit>Show Diagram and Edit>Show Tree commands on the Analysis Tree pane toolbar.
For an overview of using the Analysis Diagram, go to Getting Started with Relyence Analysis Diagram.
8. Moving On
Congratulations! You have successfully completed the Relyence FRACAS Getting Started tutorial! You are ready to move on!
You are welcome to continue using the Drone Example to try out some other features and functions or start with a new Analysis. To create a new Analysis, click on Drone Example on the Sidebar menu, and then click Create New... on the submenu, or select Welcome to Relyence from the Help dropdown menu and click Create New Analysis. Remember that you can also click Revert Example to start over with an original Example.
Please note that there are limitations in the Trial version in the amount of data that can be entered. You will be notified when you have reached these limits.
There are additional features not covered in the Getting Started tutorial, such as the ability to completely customize your FRACAS process and interface. For more information on these features, go to Relyence FRACAS Advanced Features.