Getting Started with Relyence FMEA
If you would like to review a video overview of this Getting Started Guide, go to our online videos for Relyence FMEA.
1. Sign in to Relyence
To begin, make sure you are signed in to Relyence. For details on signing in, see Signing in and Signing out.
You must have a Relyence account to sign in to Relyence. If you do not yet have a Relyence account, you can register for one for free.
You may possibly see the Announcements dialog when first signing into Relyence. The Announcements automatically scroll, or you can review them using the previous and next arrow keys. For any Announcements you do not wish to see again, select the Don't show me this again checkbox. Once you have reviewed all the Announcements, click the 'x' (Close) button in the upper right corner of the Announcements dialog.
2. Open the Example Analysis
First, let's make sure Relyence FMEA is active.
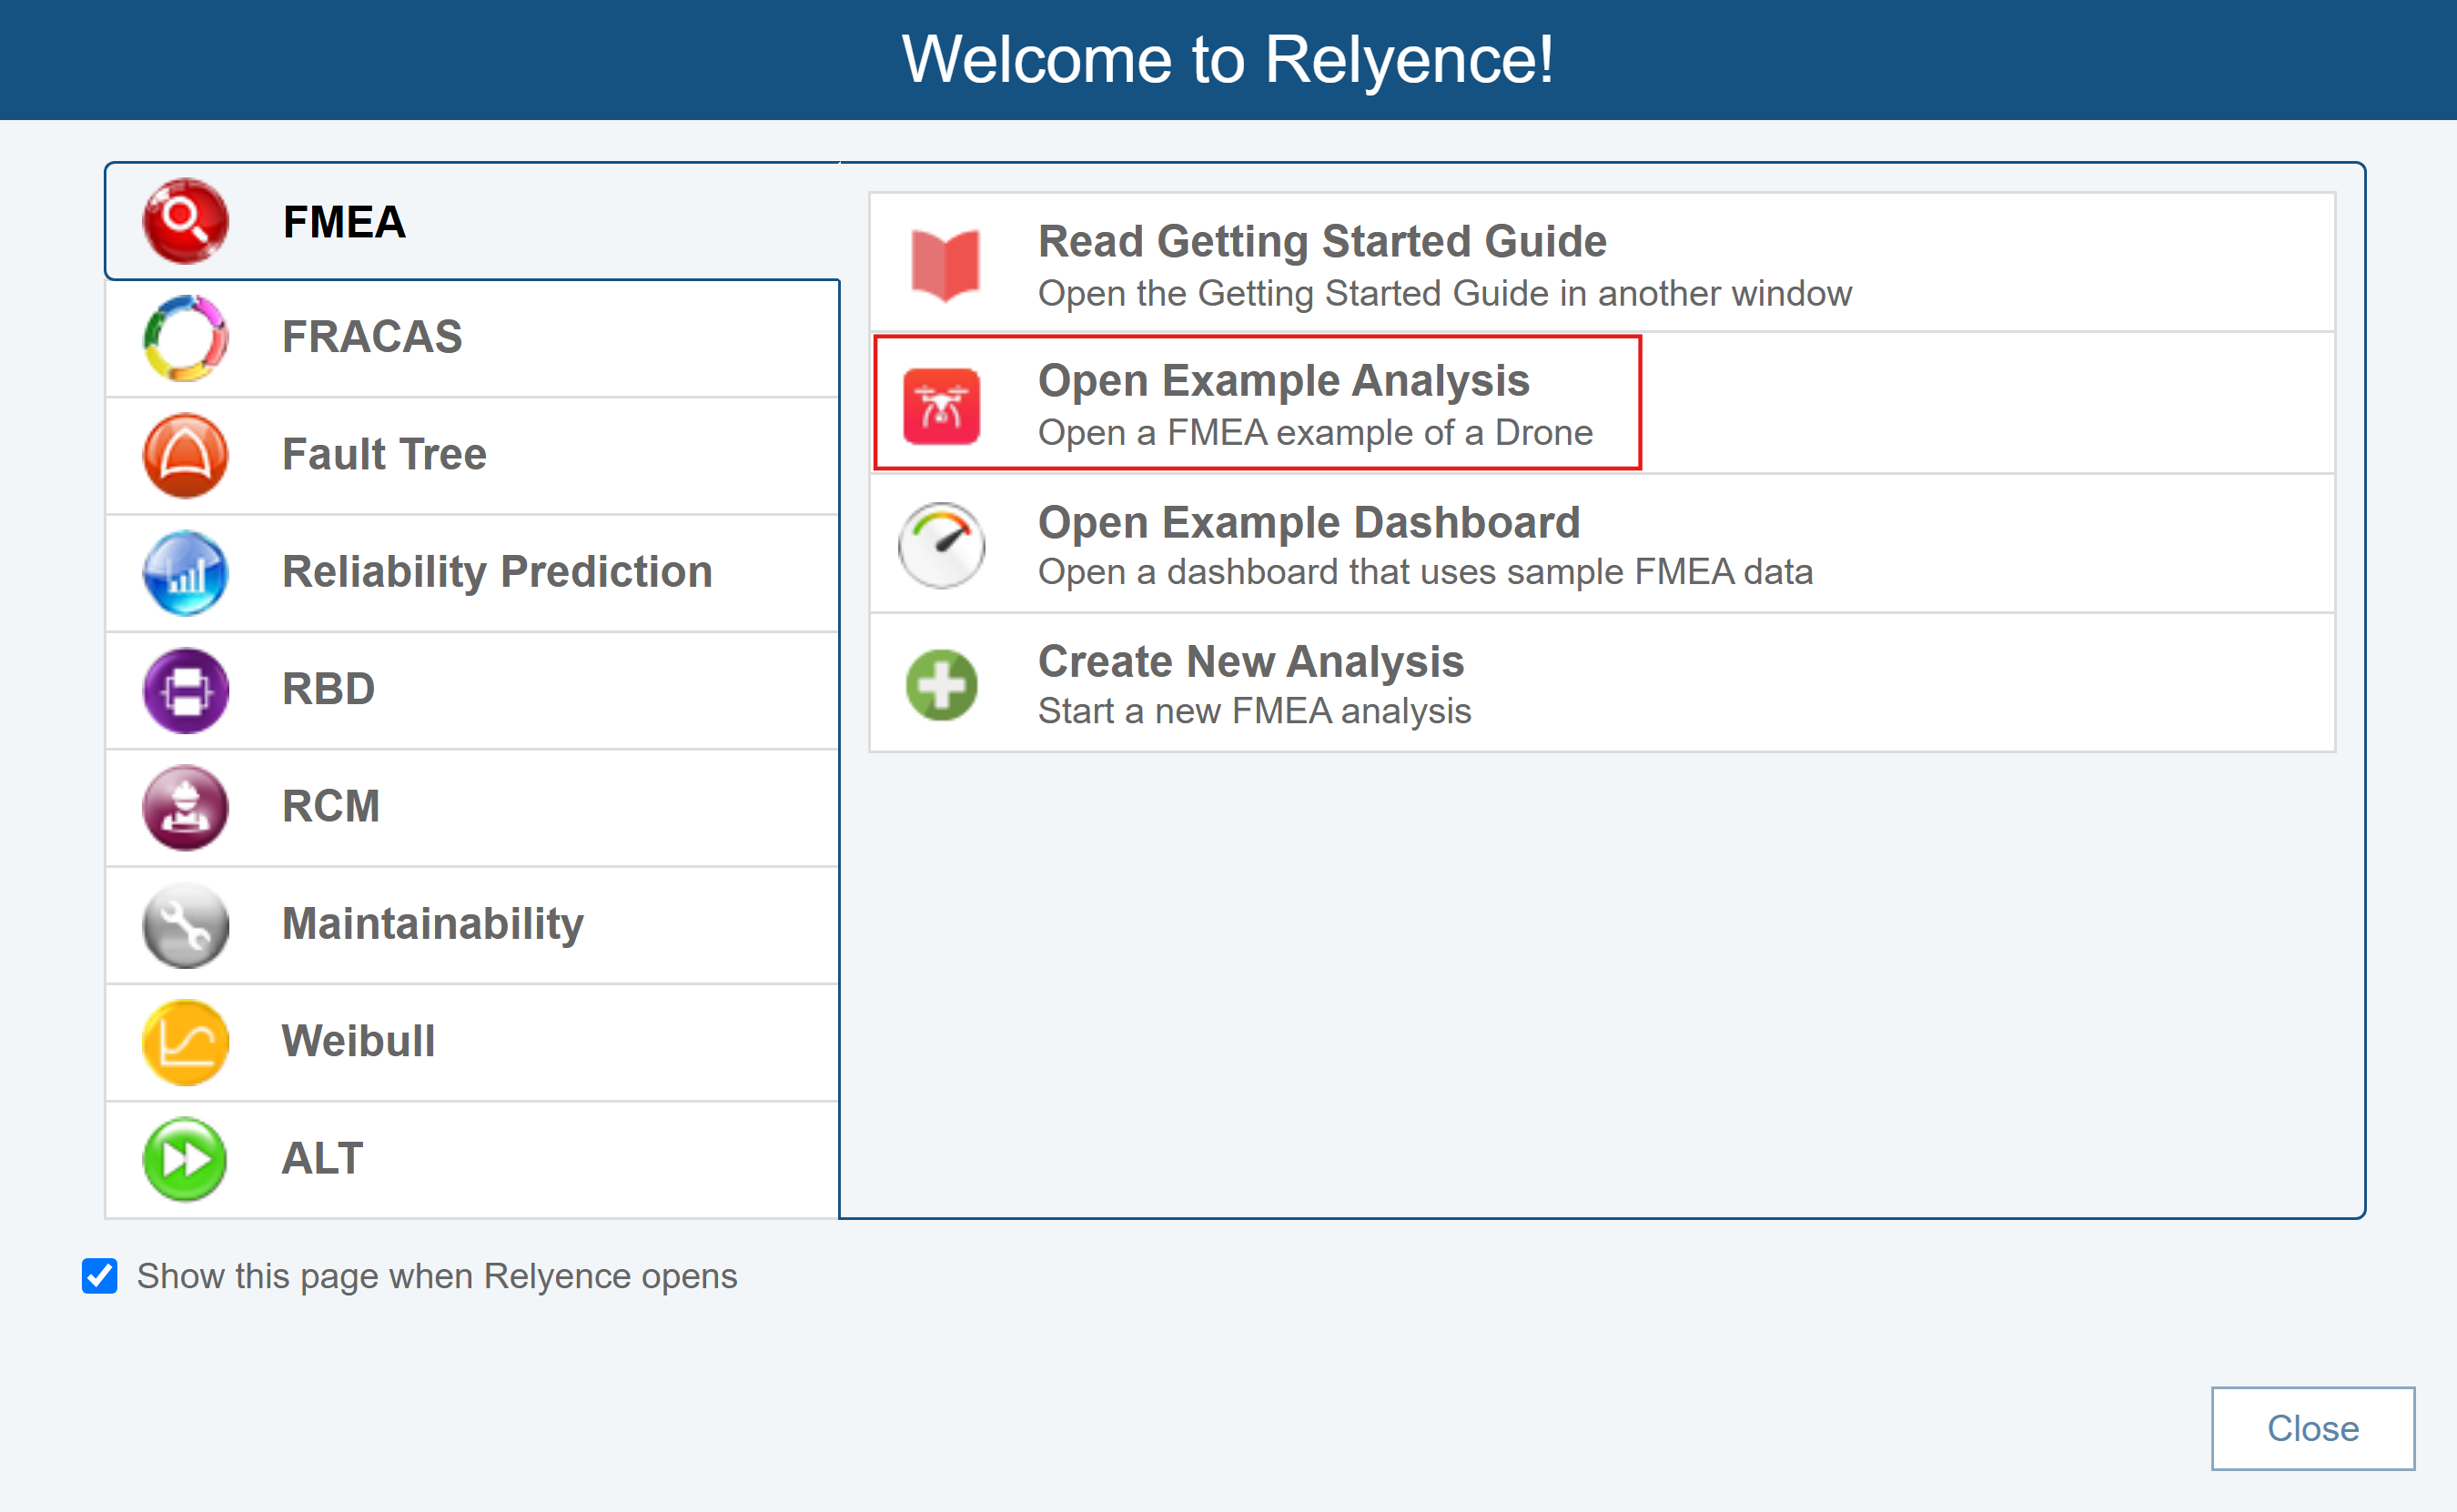
After you have signed in, you may see a Welcome dialog. If a Welcome dialog does not appear, click Welcome to Relyence from the Help dropdown menu in the upper right of the Relyence header bar.
If you were previously working on an Analysis, you will see the Continue Where I Left Off option at the top of this dialog, otherwise it will not appear. If you are using a Trial version, the Show this page when Relyence opens option will not appear. This option is only available using a licensed version of Relyence.
Click the FMEA tab on the left to activate Relyence FMEA. Then click Open Example Analysis.
For this tutorial, we will use the Drone Example Design FMEA (DFMEA) supplied with Relyence FMEA. Relyence FMEA supports various other types of FMEAs; however, they will not be covered in this tutorial. For more information on other FMEA types, including Process FMEA (PFMEA), Piece-Part FMECAs, and Monitoring and System Response FMEAs (FMEA-MSR), please review the Types of FMEA topic of this guide.
When you open an Example for the first time, you will see the Revert Example pop up appear. You are free to make changes and save your changes to the Example Analyses. If you want to revert to the original Example at any time, click Revert Example. You will get a message asking if you are sure before your changes are discarded. Click Got it! to dismiss the pop up.
For this tutorial, we assume an unmodified original Example is being used. If you are not sure if you are using an unmodified version of the Example, click Revert Example from the Sidebar. You will be asked if you want to lose your changes and reopen the Example in its original version. Click Yes.
If you continue with a modified version, just be aware that screen shots or other functions may not operate exactly as described in this tutorial.
When complete, your Drone Example with its data appears in the main window.
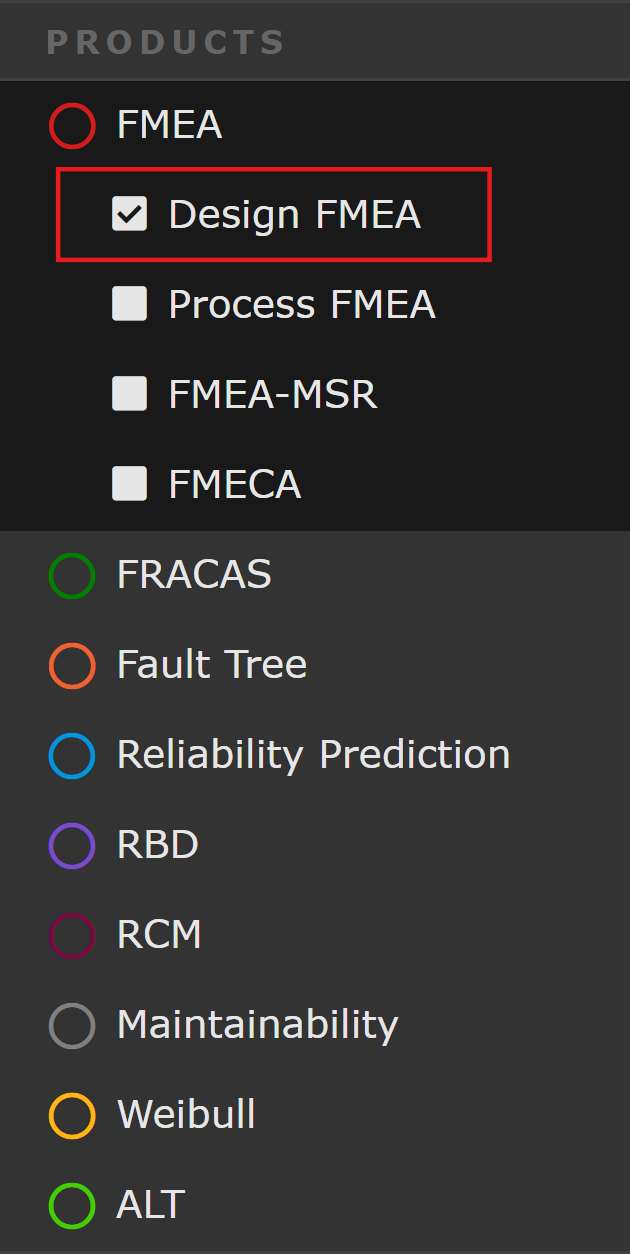
The Drone Example includes both a sample Design FMEA and Process FMEA, as well as sample FMEA-MSR and FMECA data. Make sure that the Design FMEA is in view. If Design FMEA is not selected in the Sidebar, click to select it.
3. Review the DFMEA Worksheets and Forms
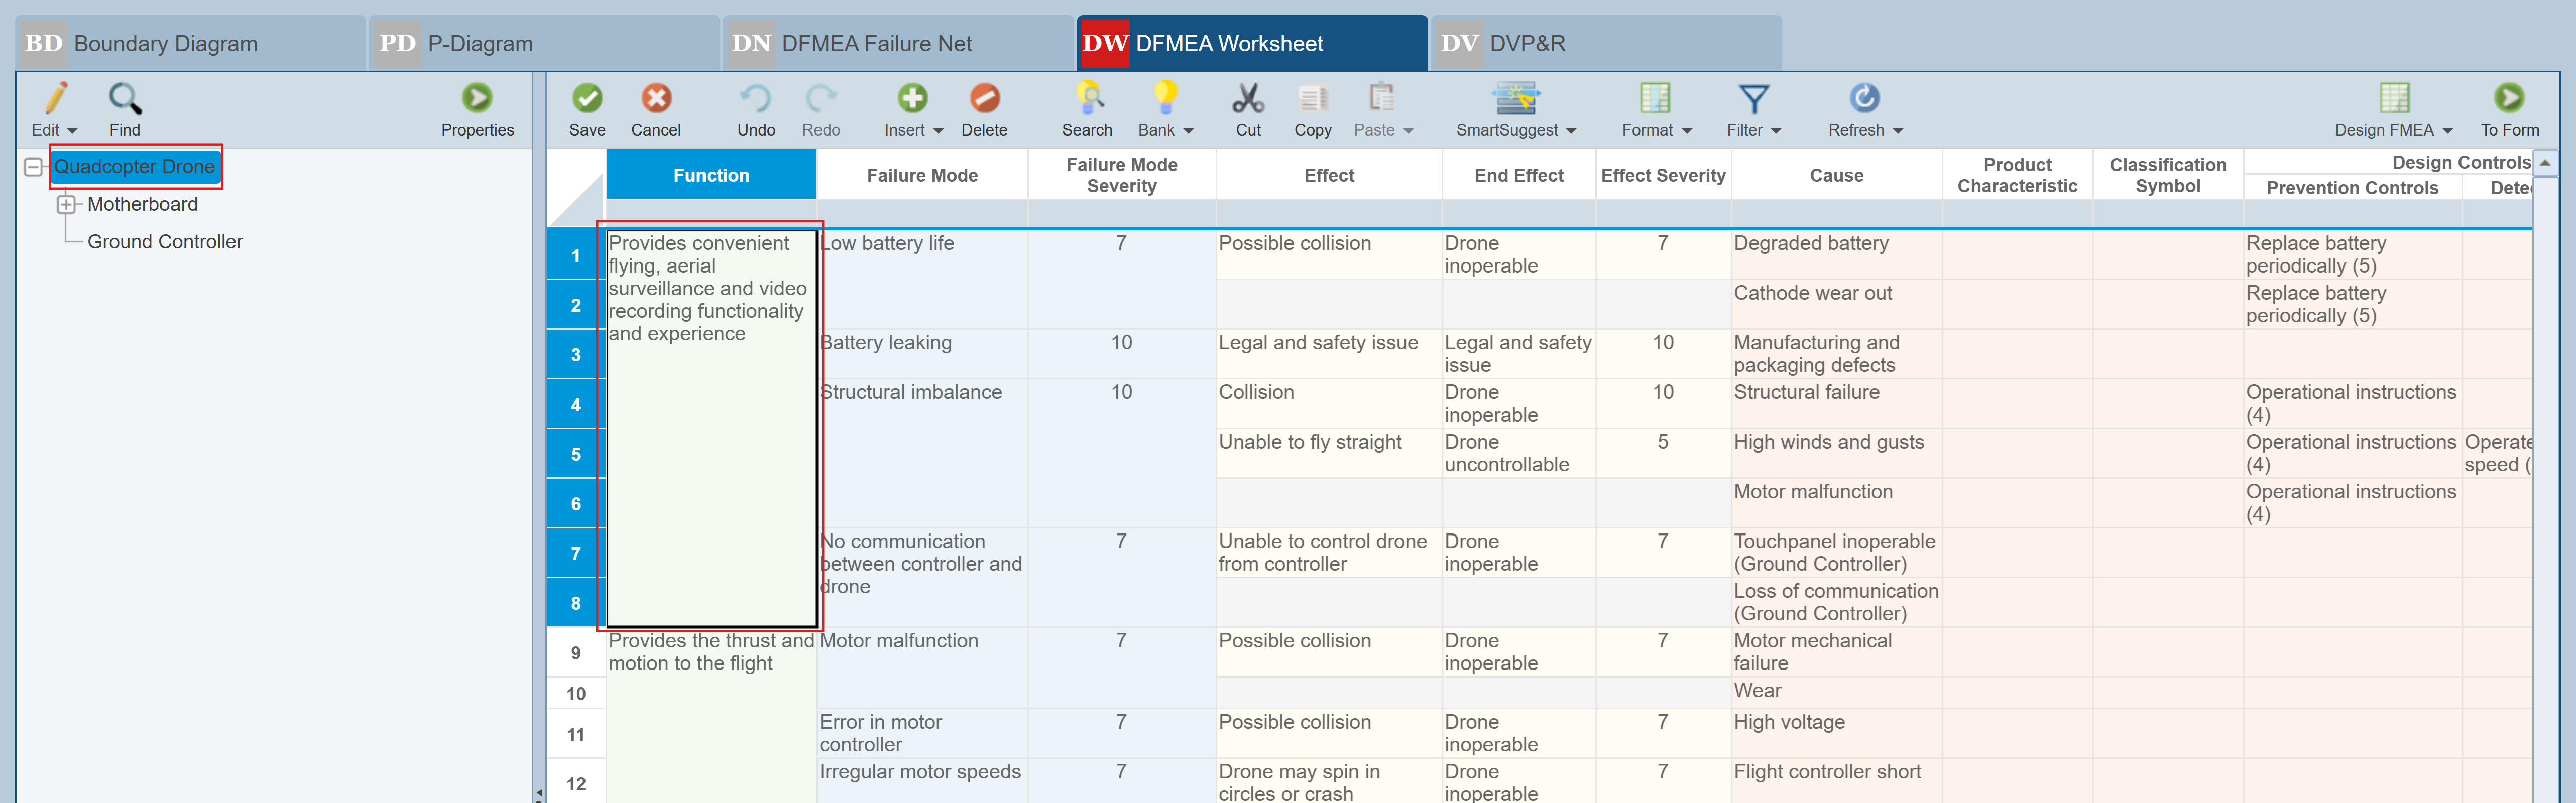
There are six parts to the FMEA window when working with Design FMEA in a Relyence Analysis. The left pane is the Analysis Tree and the large right pane is a tabbed view of your Boundary Diagram, P-Diagram, DFMEA Net, DFMEA Worksheet and DVP&R worksheet. The first tab shows the Boundary Diagram, the second tab shows the P-Diagram, the third tab shows the DFMEA Function Net, the fourth tab shows the DFMEA Worksheet, and the fifth tab shows the DVP&R worksheet. We will review the six sections of the Design FMEA window from left to right.

Analysis Tree and Analysis Diagram Pane
The leftmost portion of the FMEA window displays the Analysis Tree or Analysis Diagram. The Analysis Tree section allows you to create a hierarchical representation of the system or process you are analyzing. You can use the Analysis Tree to break down your system in any way you want for easier data management. You do not have to use the Analysis Tree if you prefer not to.
You can control the size of the Analysis Tree pane by using the splitter controls.
The left pointing arrow at the top collapses the Analysis Tree pane. To reopen the pane, click the right pointing arrow. To adjust the size of the pane, use the splitter control in the center. The right pointing arrow at the bottom will reopen the pane if it is collapsed or size it to full screen if the pane is visible.
Relyence FMEA supports modeling your product or system visually using the Analysis Diagram. For an overview of using the Analysis Diagram, go to Getting Started with Relyence Analysis Diagram.
FMEA Worksheets Pane
The main Design FMEA window has five tabs that include all the data related to the DFMEA process: the Boundary Diagram, the P-Diagram, the DFMEA Function Net, the DFMEA Worksheet, and the DVP&R worksheet.
Boundary Diagram Worksheet
The first tab displays the Boundary Diagram.
The FMEA process optionally begins with the creation of one or more Boundary Diagram(s). Boundary Diagrams provide a visual representation of a given system including its interfaces to other systems, environmental effects, and customer usage. Developing a well-defined Boundary Diagram can provide useful input for the FMEA, including details such as Functions that should be evaluated as part of the DFMEA. For the purposes of this Getting Started Guide, we will simply review the example Boundary Diagram.
Click the Boundary Diagram tab to activate the Boundary Diagram worksheet.

If the message box stating "Click Edit BD to add Subsystems, External Items, and Interfaces to your Boundary Diagram." appears by Edit BD in the toolbar, click Got it! to clear the message.
The Boundary Diagram worksheet displays the example Boundary Diagram for the Quadcopter Drone.
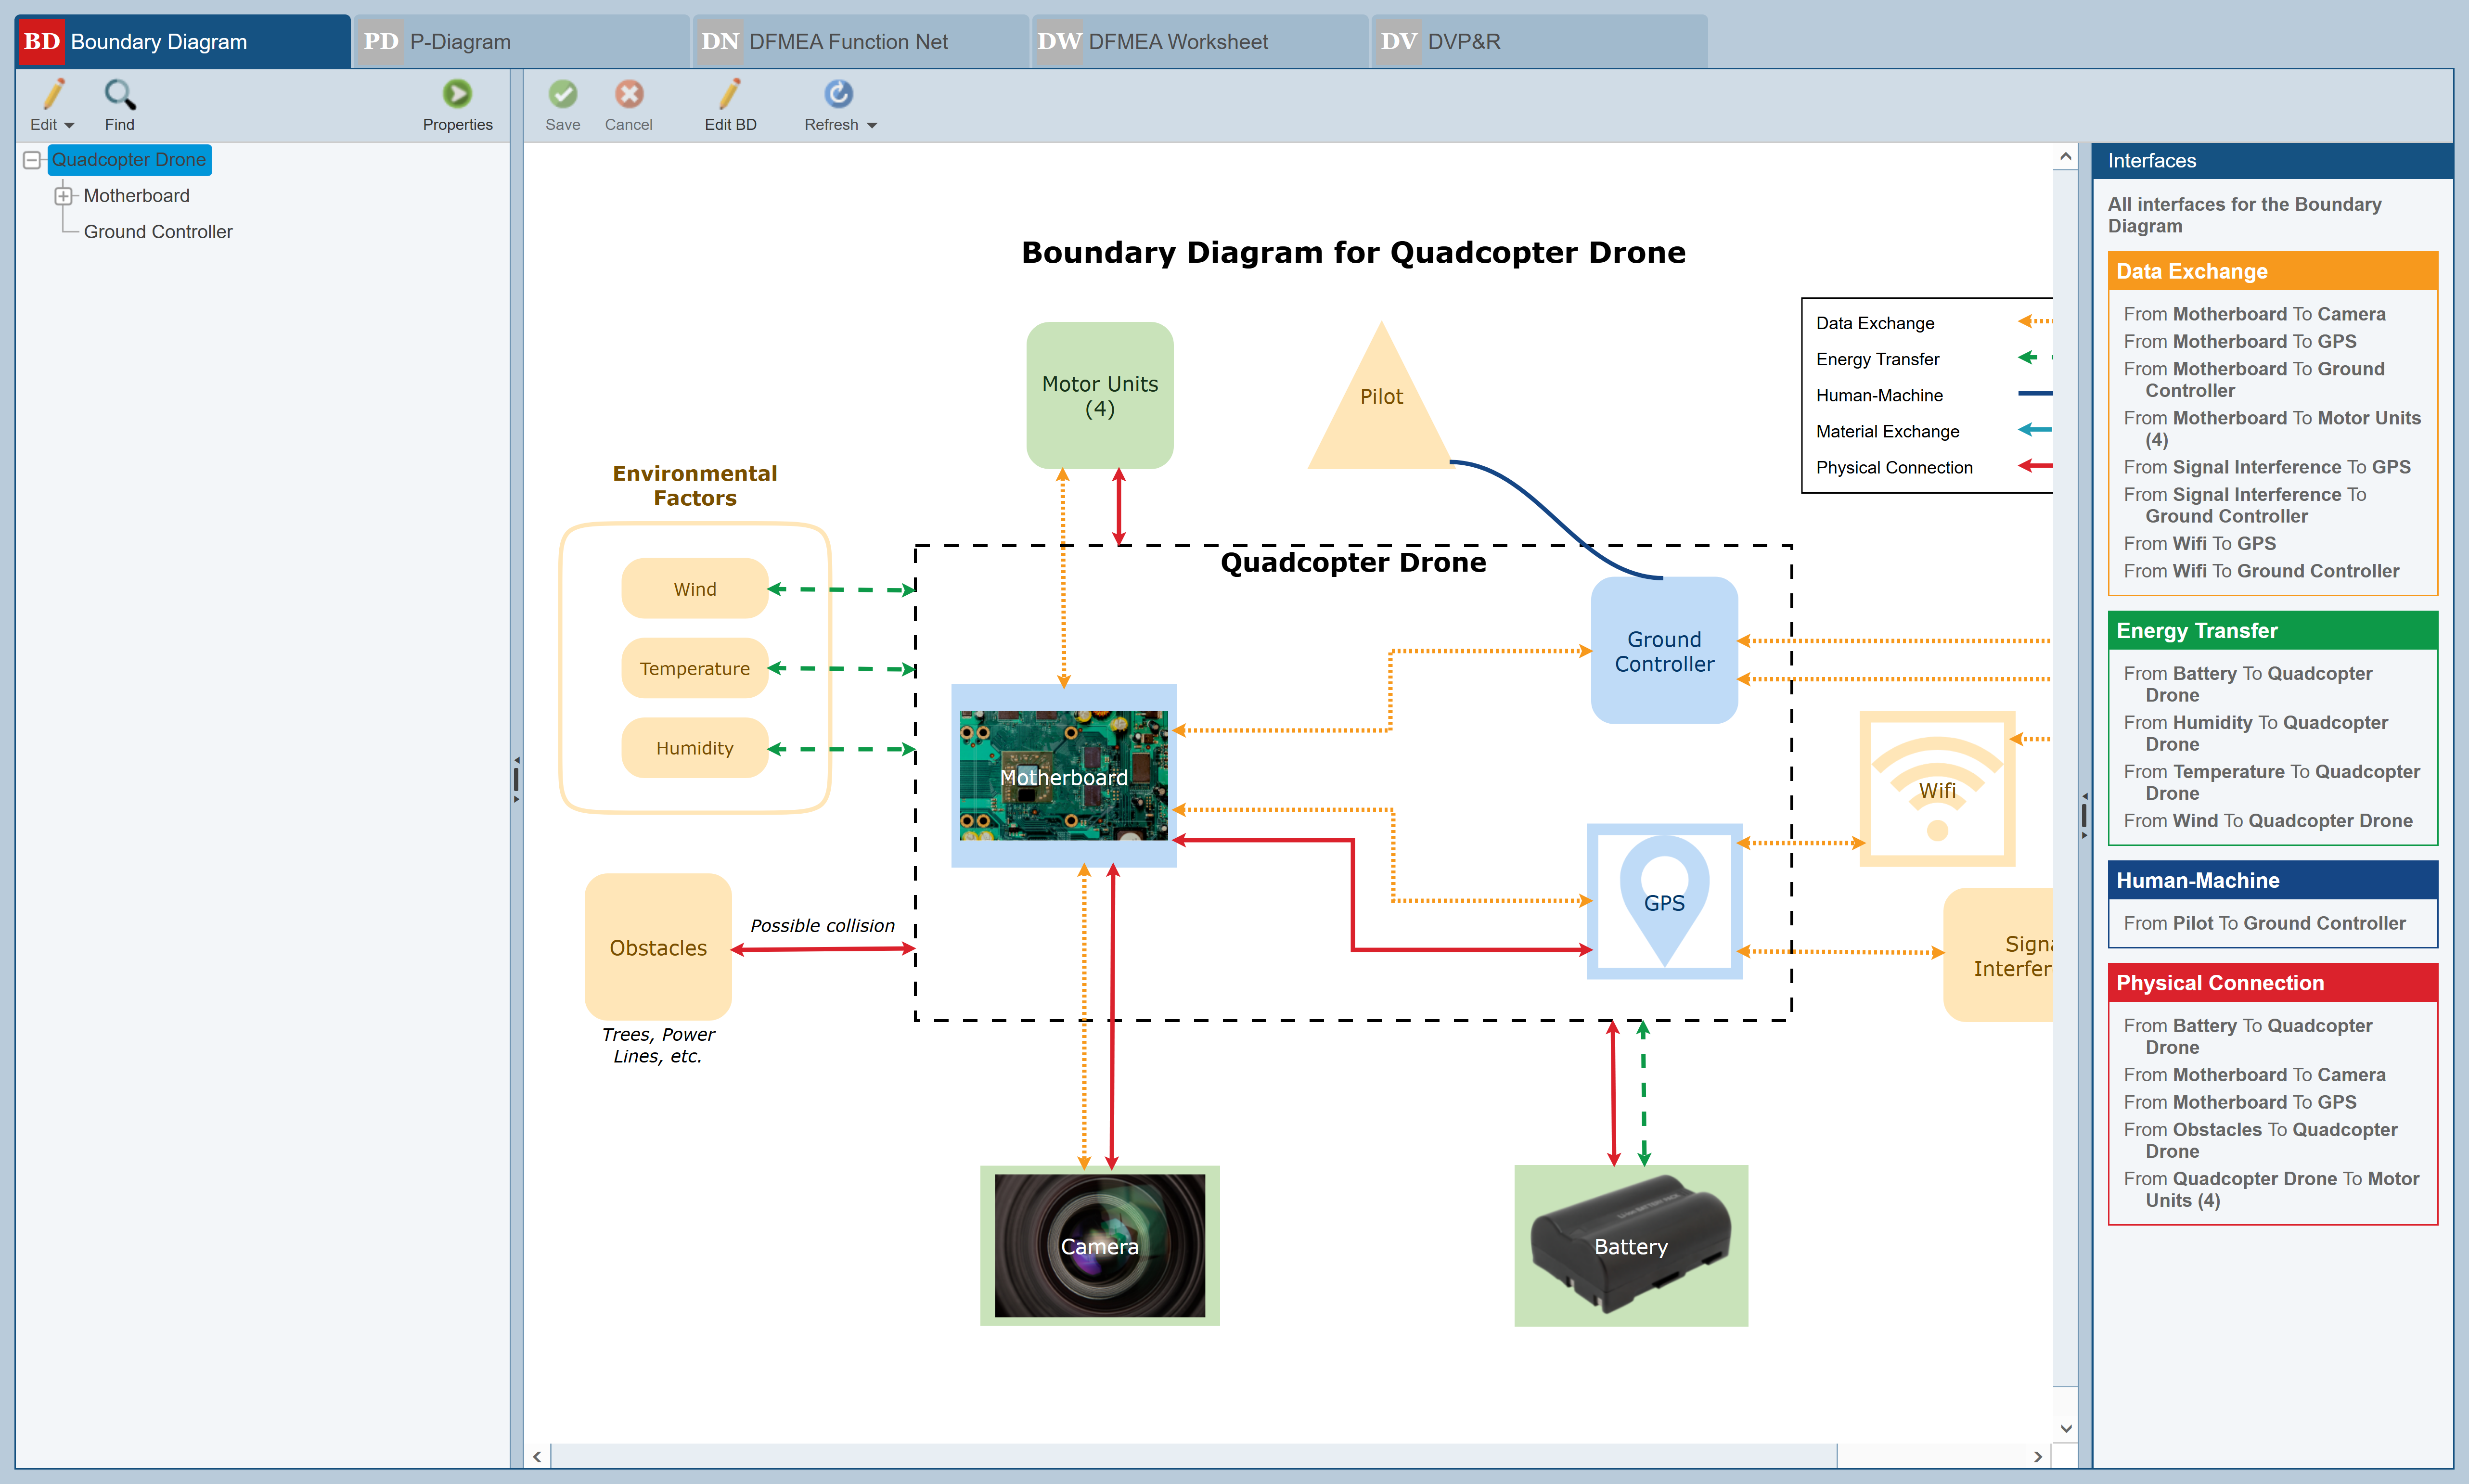
Review the information detailed in the Boundary Diagram for the Quadcopter Drone, including all blocks and interfaces. The Boundary Diagram is a helpful overview of all the items to consider when performing your failure mode and effects analysis.
See the DFMEA Boundary Diagrams topic for more information on using and customizing Boundary Diagrams.
P-Diagram Worksheet
The second tab displays the P-Diagram.
The FMEA process optionally includes the creation of a P-Diagram, or Parameter Diagram. The P-Diagram describes inputs and expected outputs, along with unintended outputs, noise factors, and control factors. Developing a well-defined P-Diagram can provide useful input for the FMEA, including details like Failure Causes, Failure Modes, Effects, Current Controls, and Recommended Actions. For the purposes of this Getting Started Guide, we will simply review the example P-Diagram.
Click the P-Diagram tab to activate the P-Diagram worksheet.

The P-Diagram worksheet displays the example P-Diagram analysis for the Quadcopter Drone.
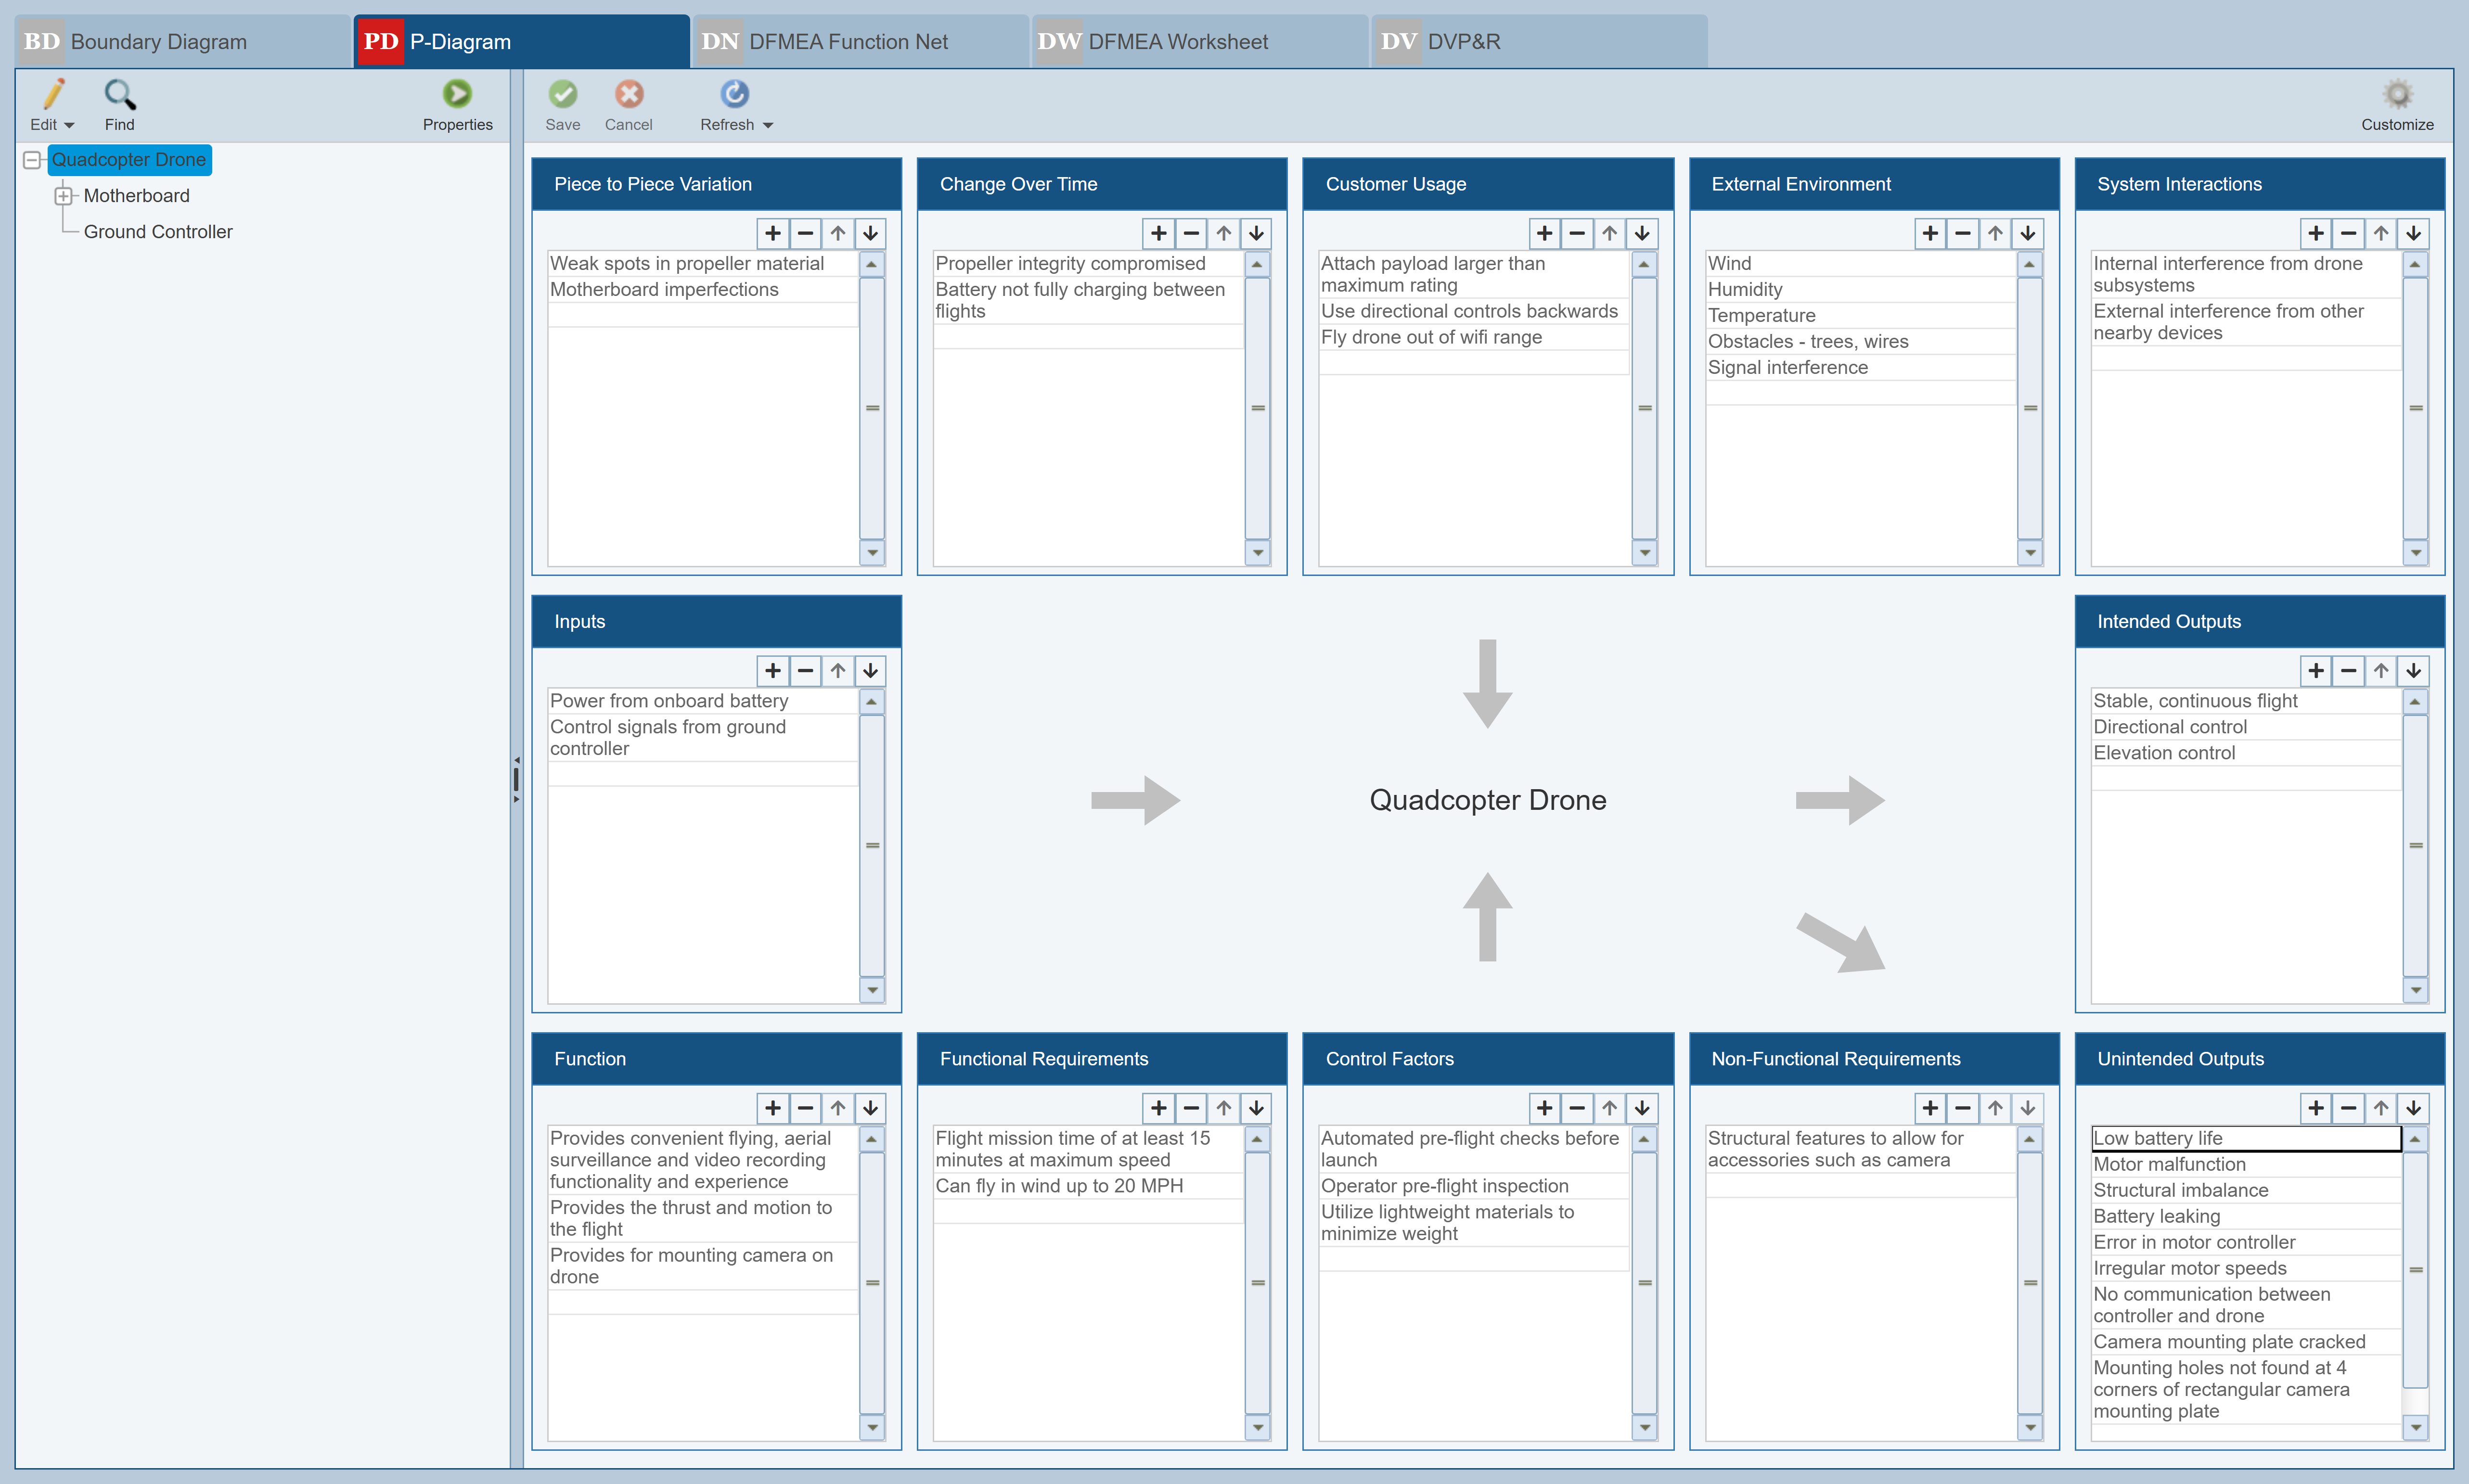
Review the information detailed in the P-Diagram for the Quadcopter Drone, including all the elements related to identifying the inputs, requirements, and outputs. The P-Diagram is a helpful overview of all the items to consider when performing your failure mode and effects analysis. You can also see how the Functions identified in the P-Diagram carry over into the DFMEA Worksheet.
See the DFMEA P-Diagrams topic for more information on using and customizing P-Diagrams.
DFMEA Function Net Worksheet
The third tab displays the DFMEA Function Net tab.
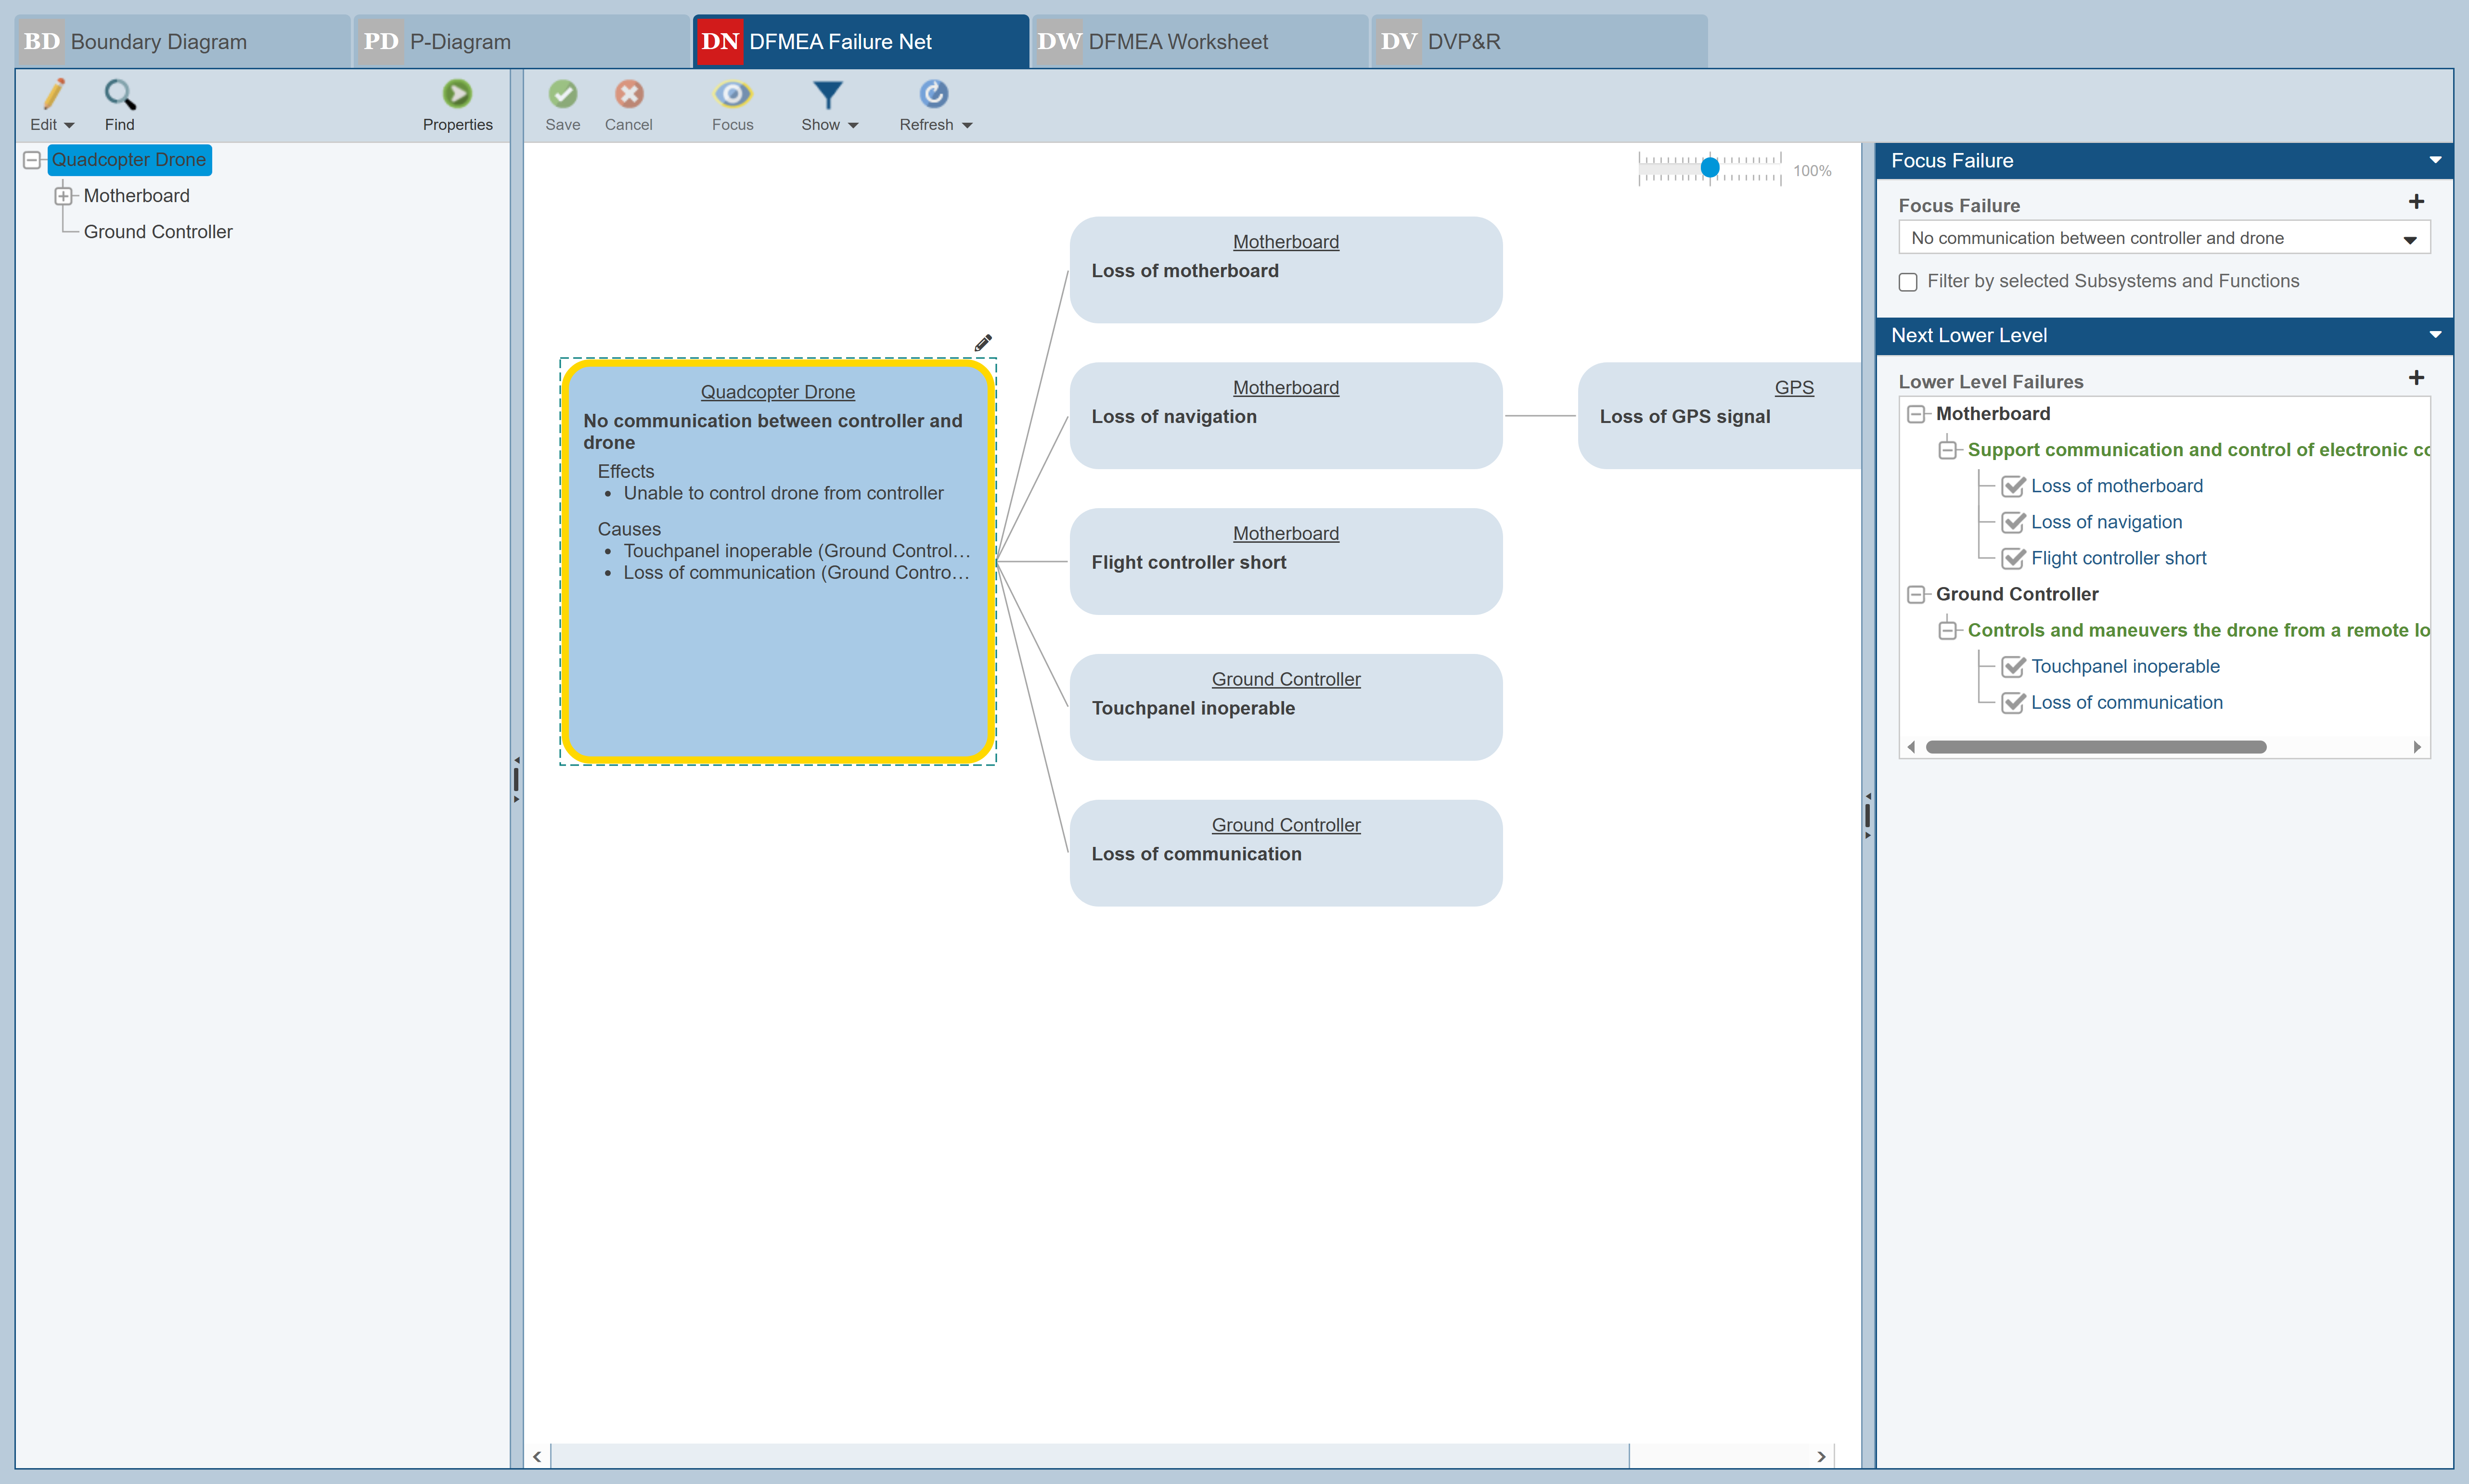
The FMEA process for DFMEA optionally includes the creation of Function Nets and/or Failure Nets. Function Nets and Failure Nets offer a dynamic, visual representation of your DFMEA data including Functions, Failure Modes, and their associated Causes and Effects across your system. For the purposes of this Getting Started Guide, we will simply review the example Function Net and Failure Net details.
Click the DFMEA Function Net tab to activate the DFMEA Function Net tab.

The DFMEA Function Net tab displays the example Function Net and Failure Net details for the Quadcopter Drone.
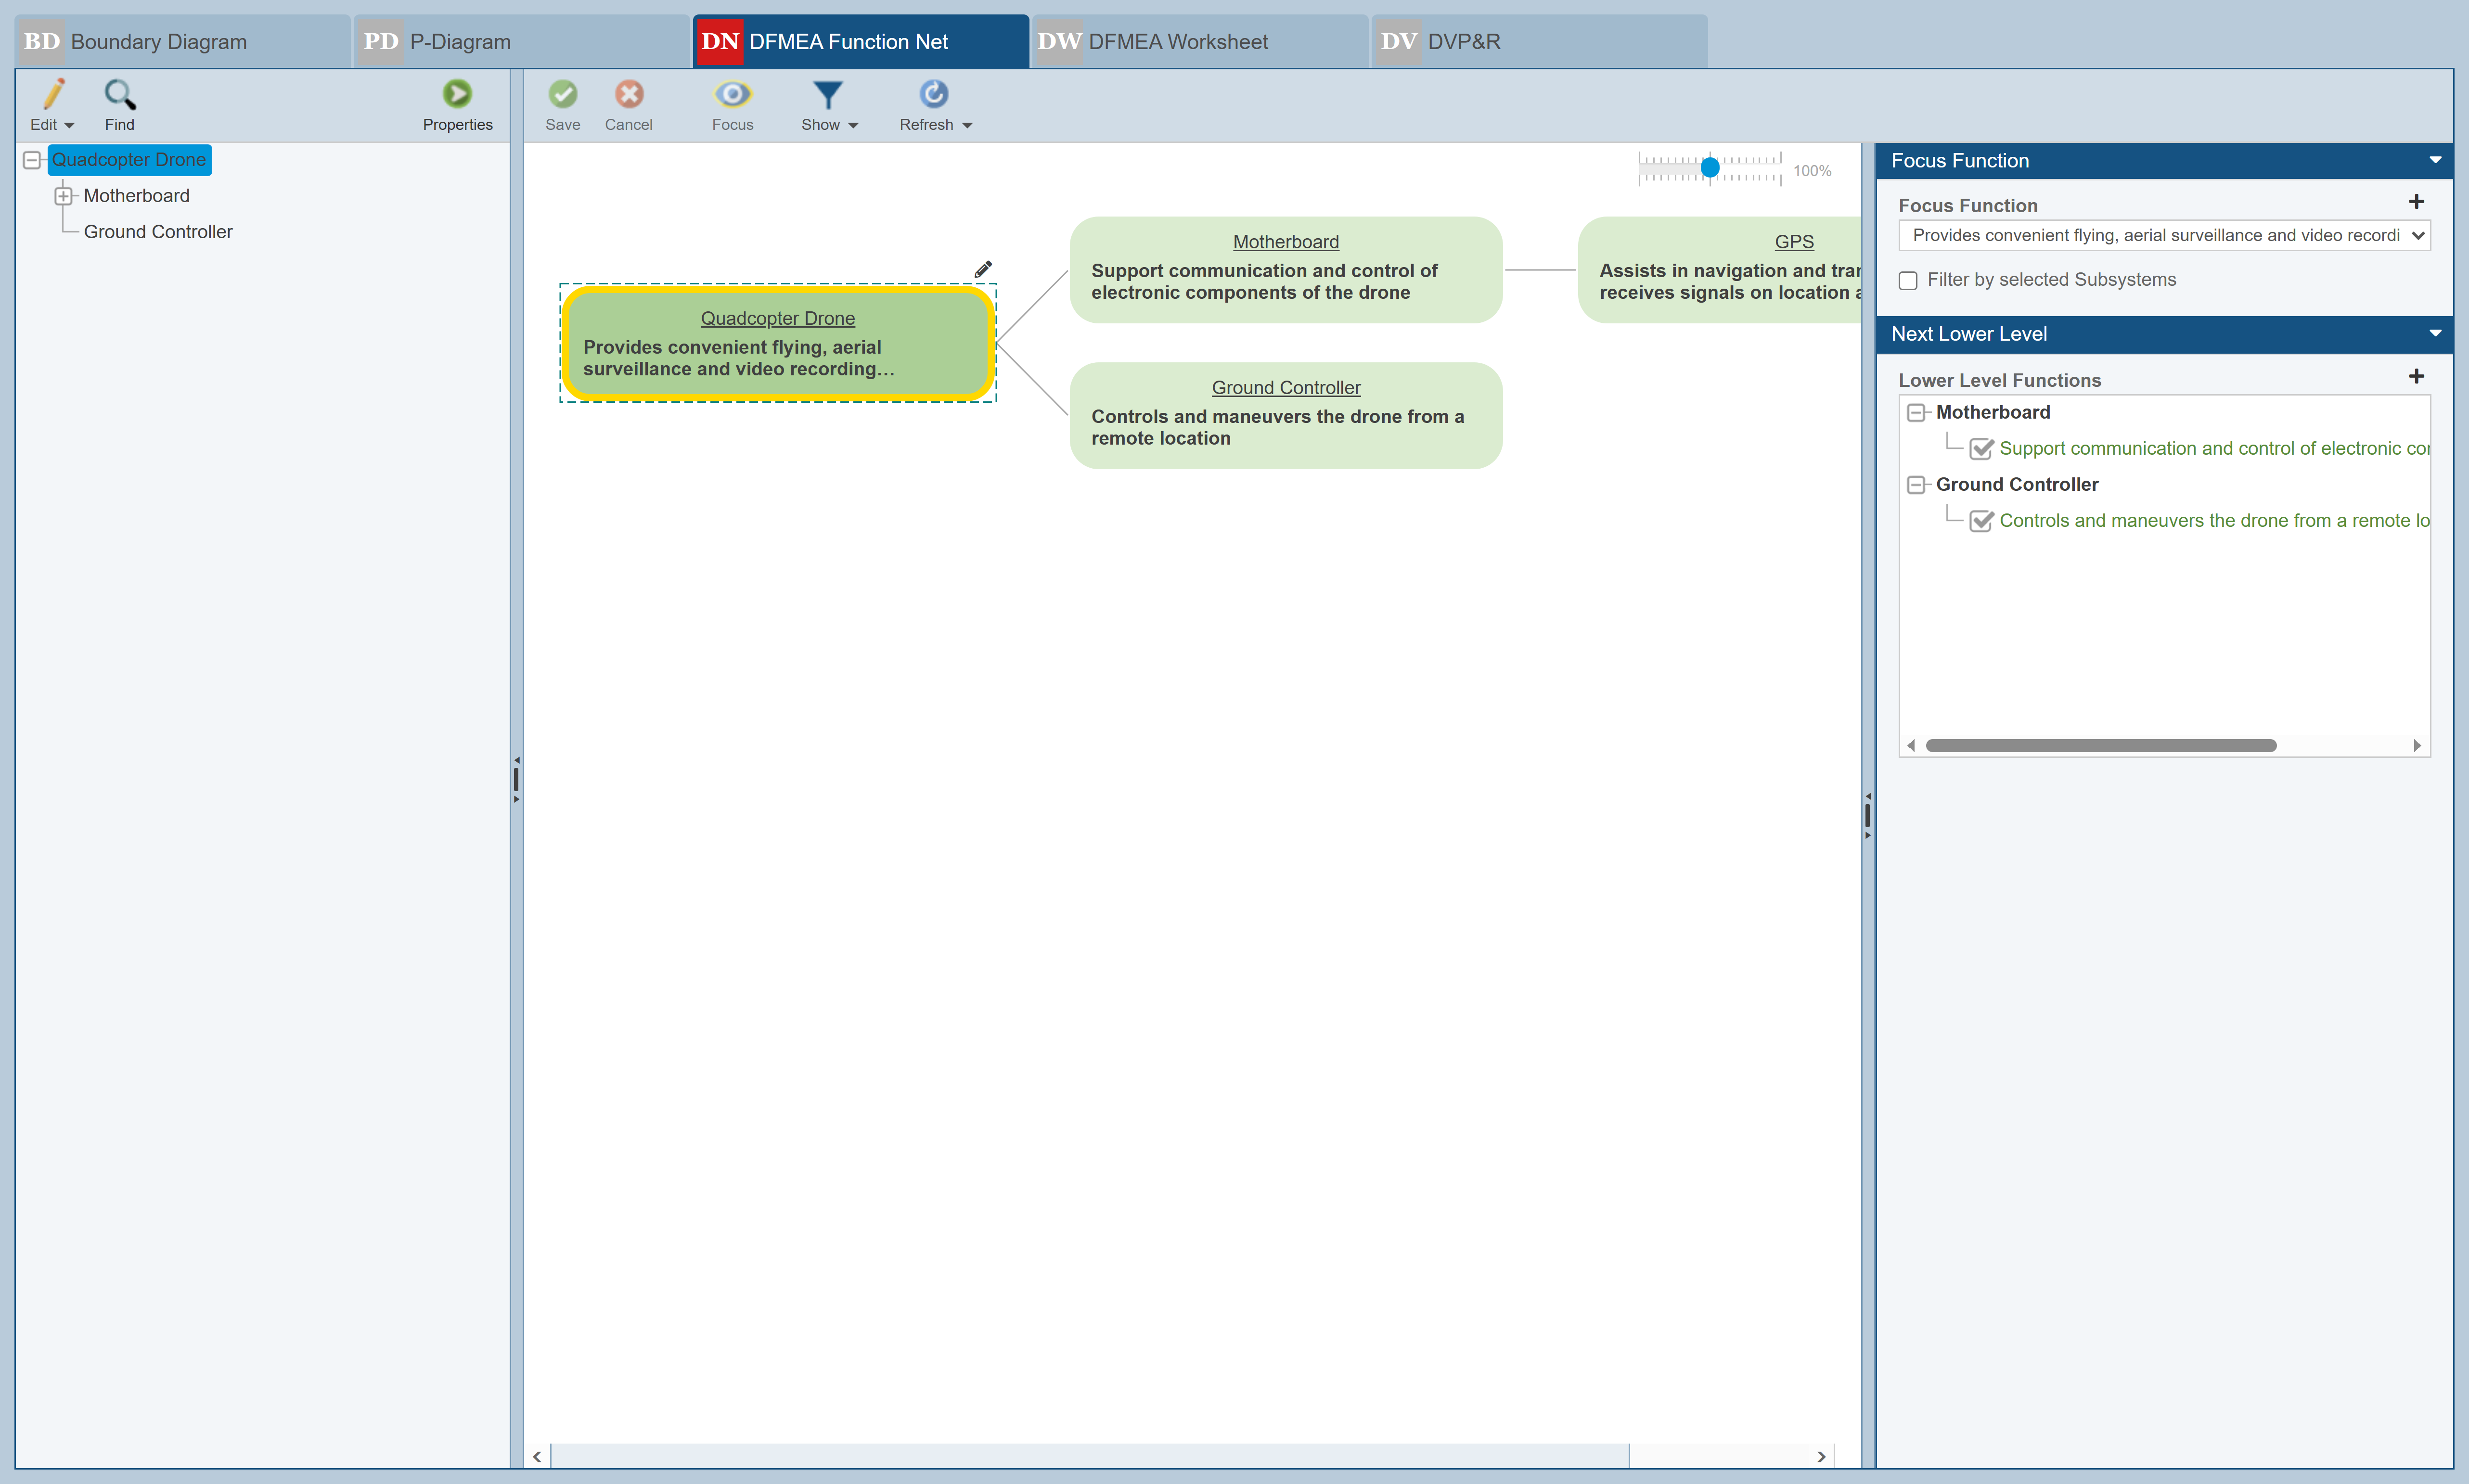
Review the information detailed on the DFMEA Function Net tab for the Quadcopter Drone, including the Focus Function and Next Lower Level details.
See the DFMEA Nets topic for more information on using and customizing DFMEA Function Nets and Failure Nets.
To review sample Failure Net details, from the toolbar, click Show>Failure Net. In the right-most pane, for Focus Failure, click No communication between controller and drone.
DFMEA Worksheet
Click the DFMEA Worksheet tab to move to fourth tab of the FMEA pane: the DFMEA Worksheet.

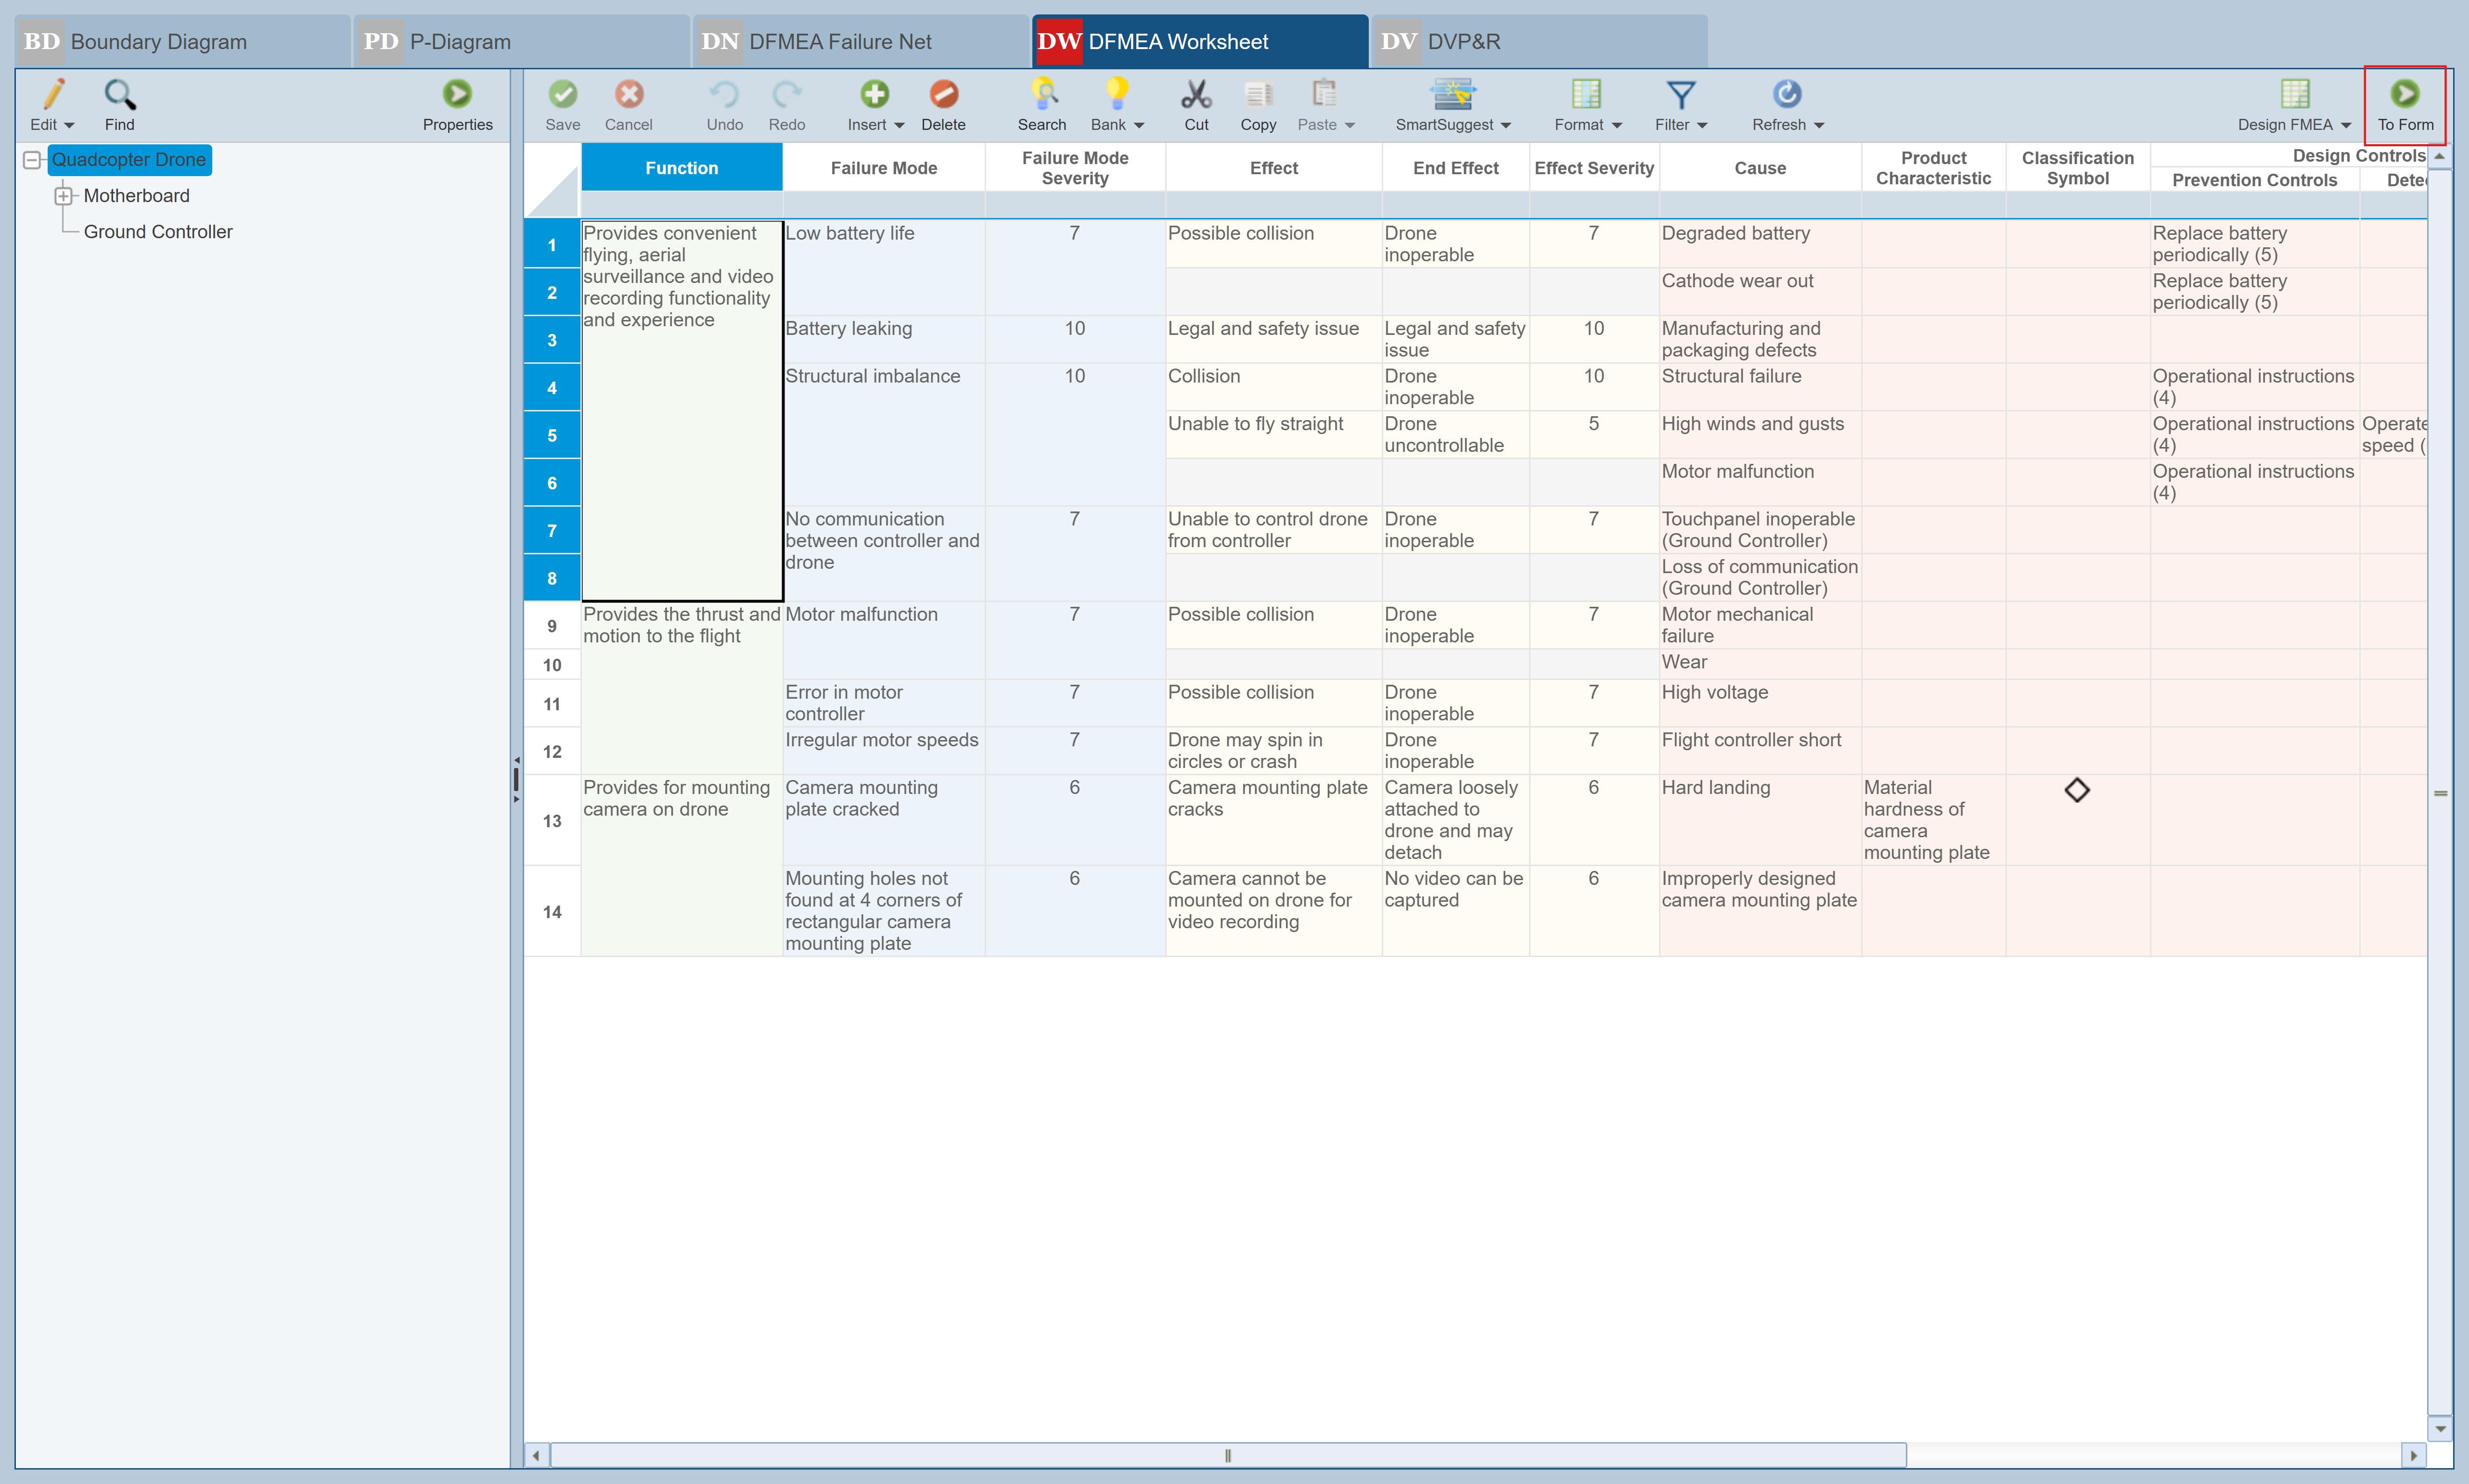
The DFMEA Worksheet is your main working area for performing your failure mode and effects analyses.
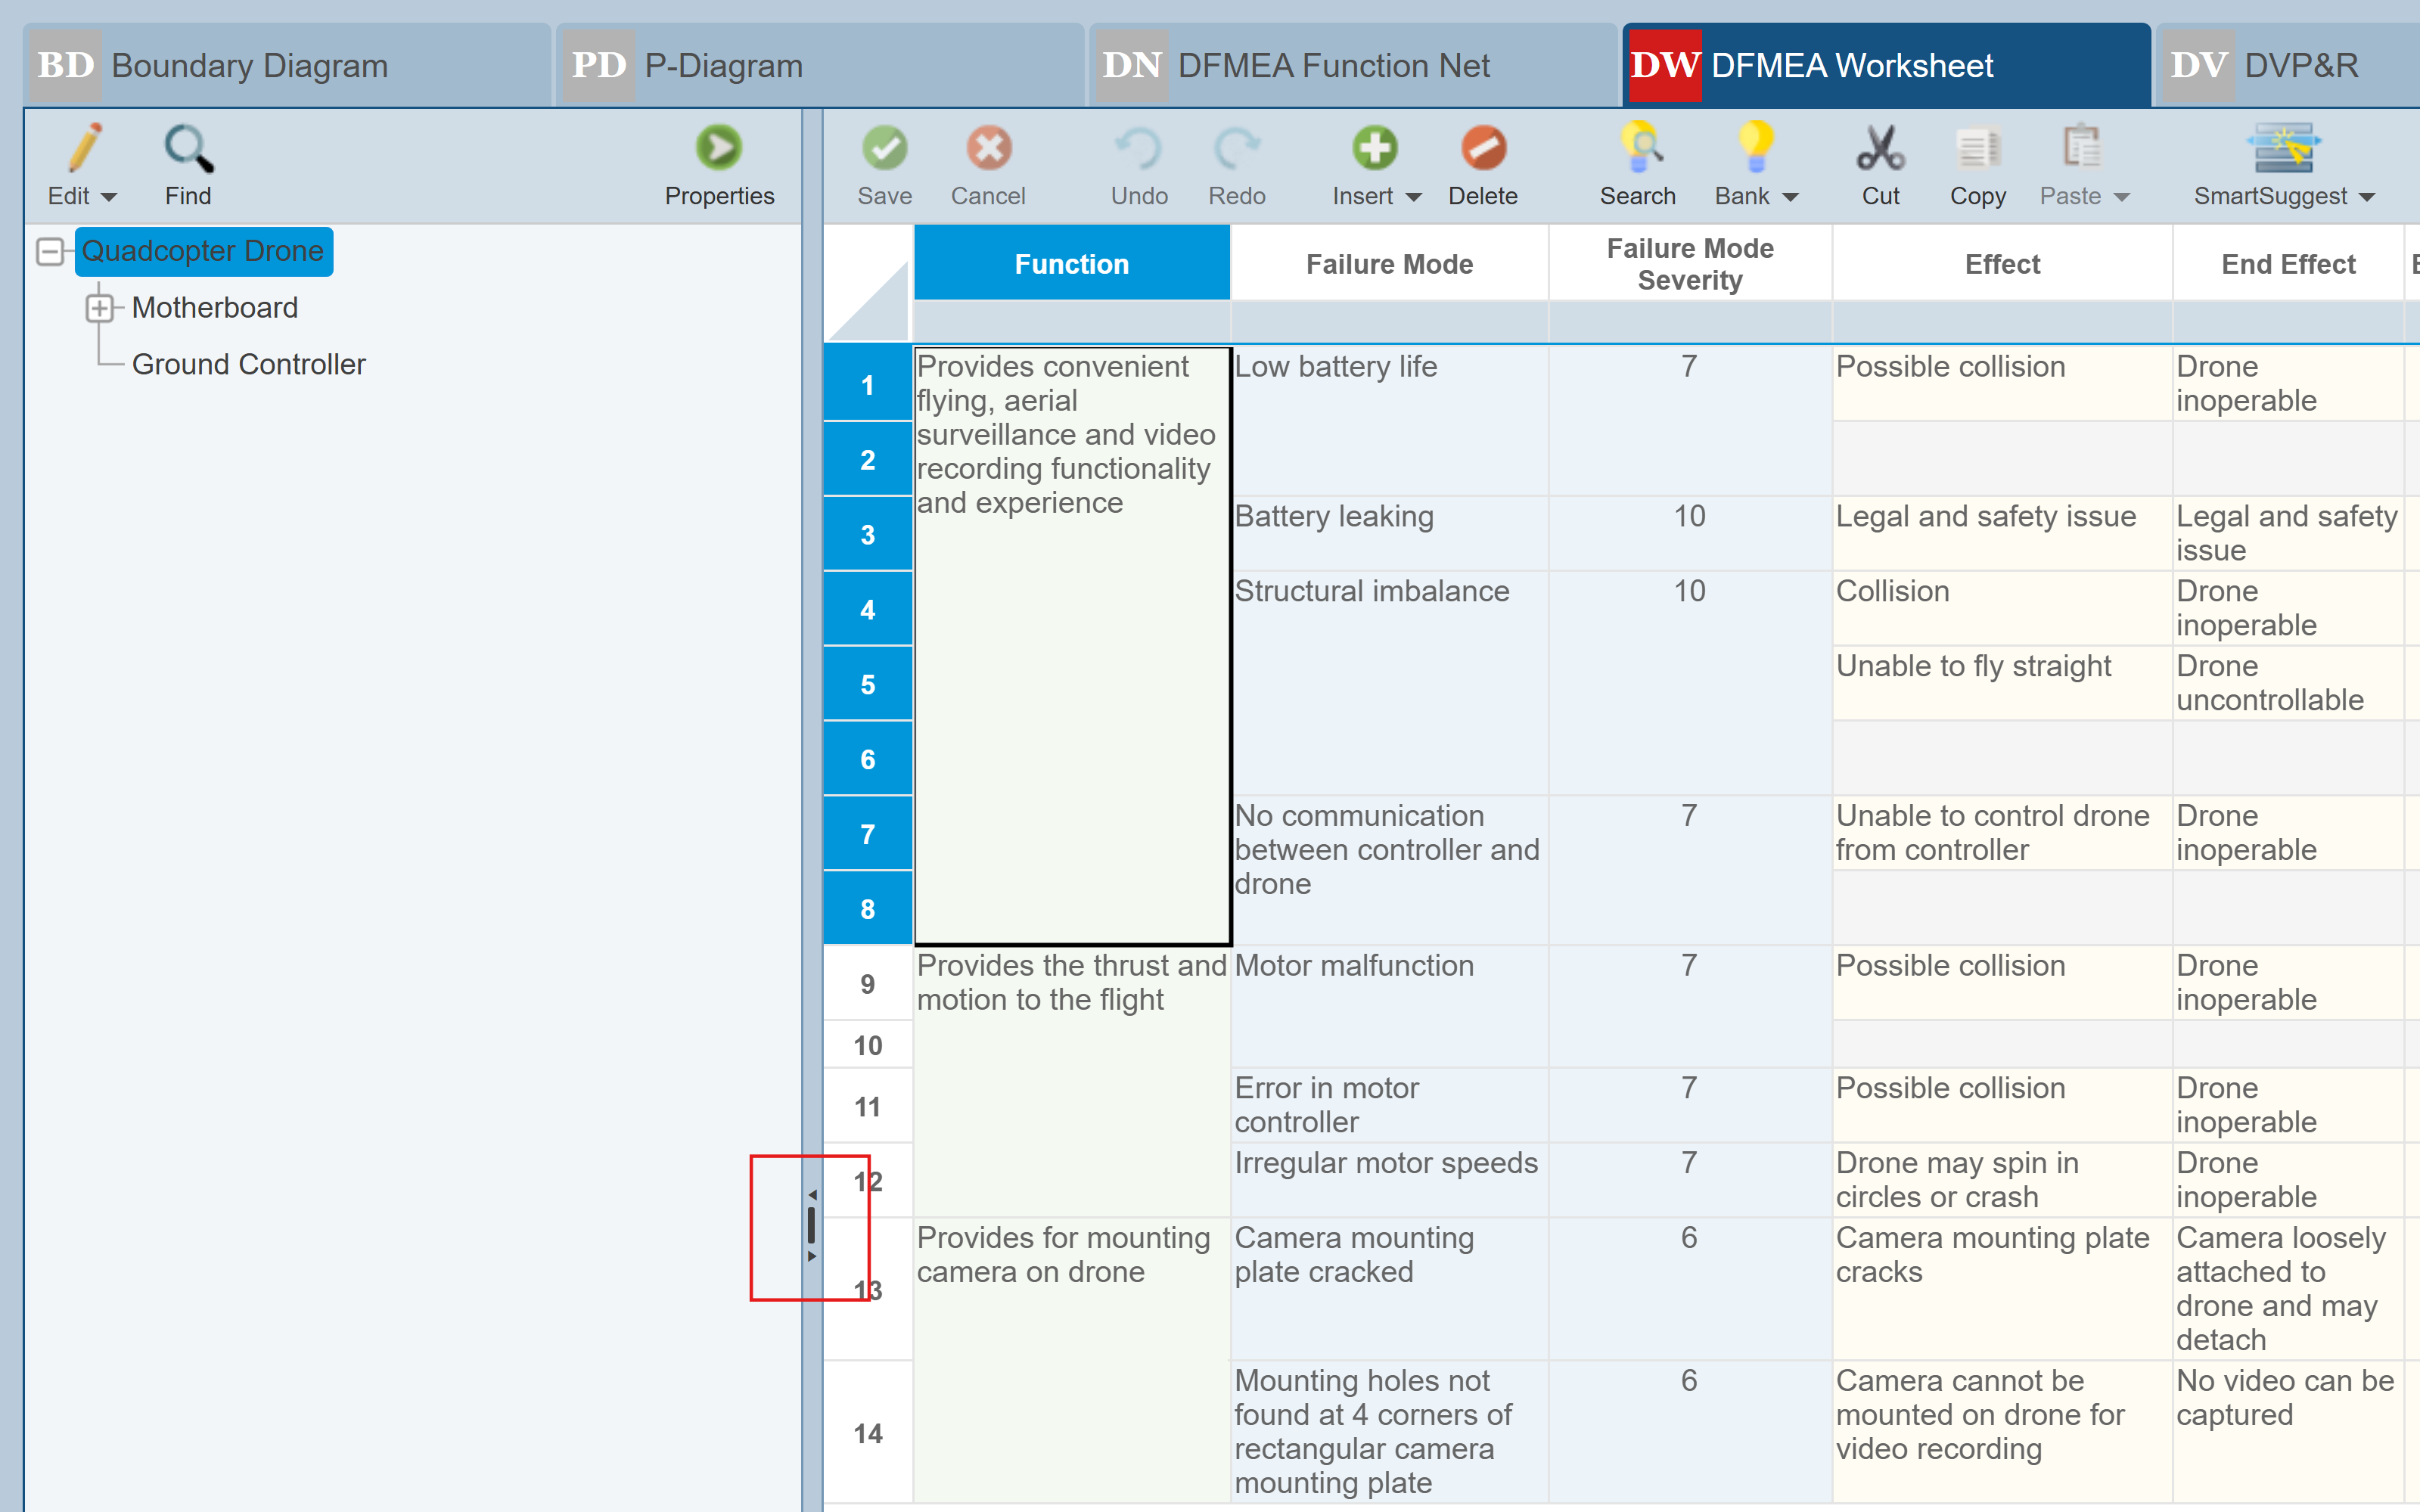
The FMEA Worksheet is color-coded to help when completing your analyses. The various data "groups" are color-coded to help visualize their relationships. To begin your DFMEA, you define the Functions you are analyzing - designated in green. A Function may have one or more Failure Modes - designated in blue. In a similar fashion, there may be multiple Effects (yellow) per Failure Mode, as well as multiple Causes (red) per Failure Mode. The color-coding enables you to easily see which columns are associated with each FMEA data grouping. Note that the Recommended Actions and related fields are not shown in this View. There may be multiple Recommended Actions per Cause, and if shown on the FMEA Worksheet, these fields appear in purple. Click in the green shaded cell for the first Function that begins with "Provides convenient..."
Notice that in our FMEA Worksheet for this Example the End Effect column is included. The optional End Effect field is typically used to denote the end effect of the failure mode at the system level. Utilizing the End Effect field enables you to take advantage of the FMEA-Fault Tree link feature available with Relyence. The FMEA-Fault Tree link allows you to automatically create a Fault Tree based on your FMEA, and optionally keep the two analyses in sync. For more information on this feature, see the Linking Fault Trees and FMEAs topic. If you prefer not to use the End Effect field, or you wish to modify the FMEA Worksheets in any other way, you can easily customize your FMEA Worksheet to meet your needs. See the Customizing the FMEA Worksheets topic for more information,
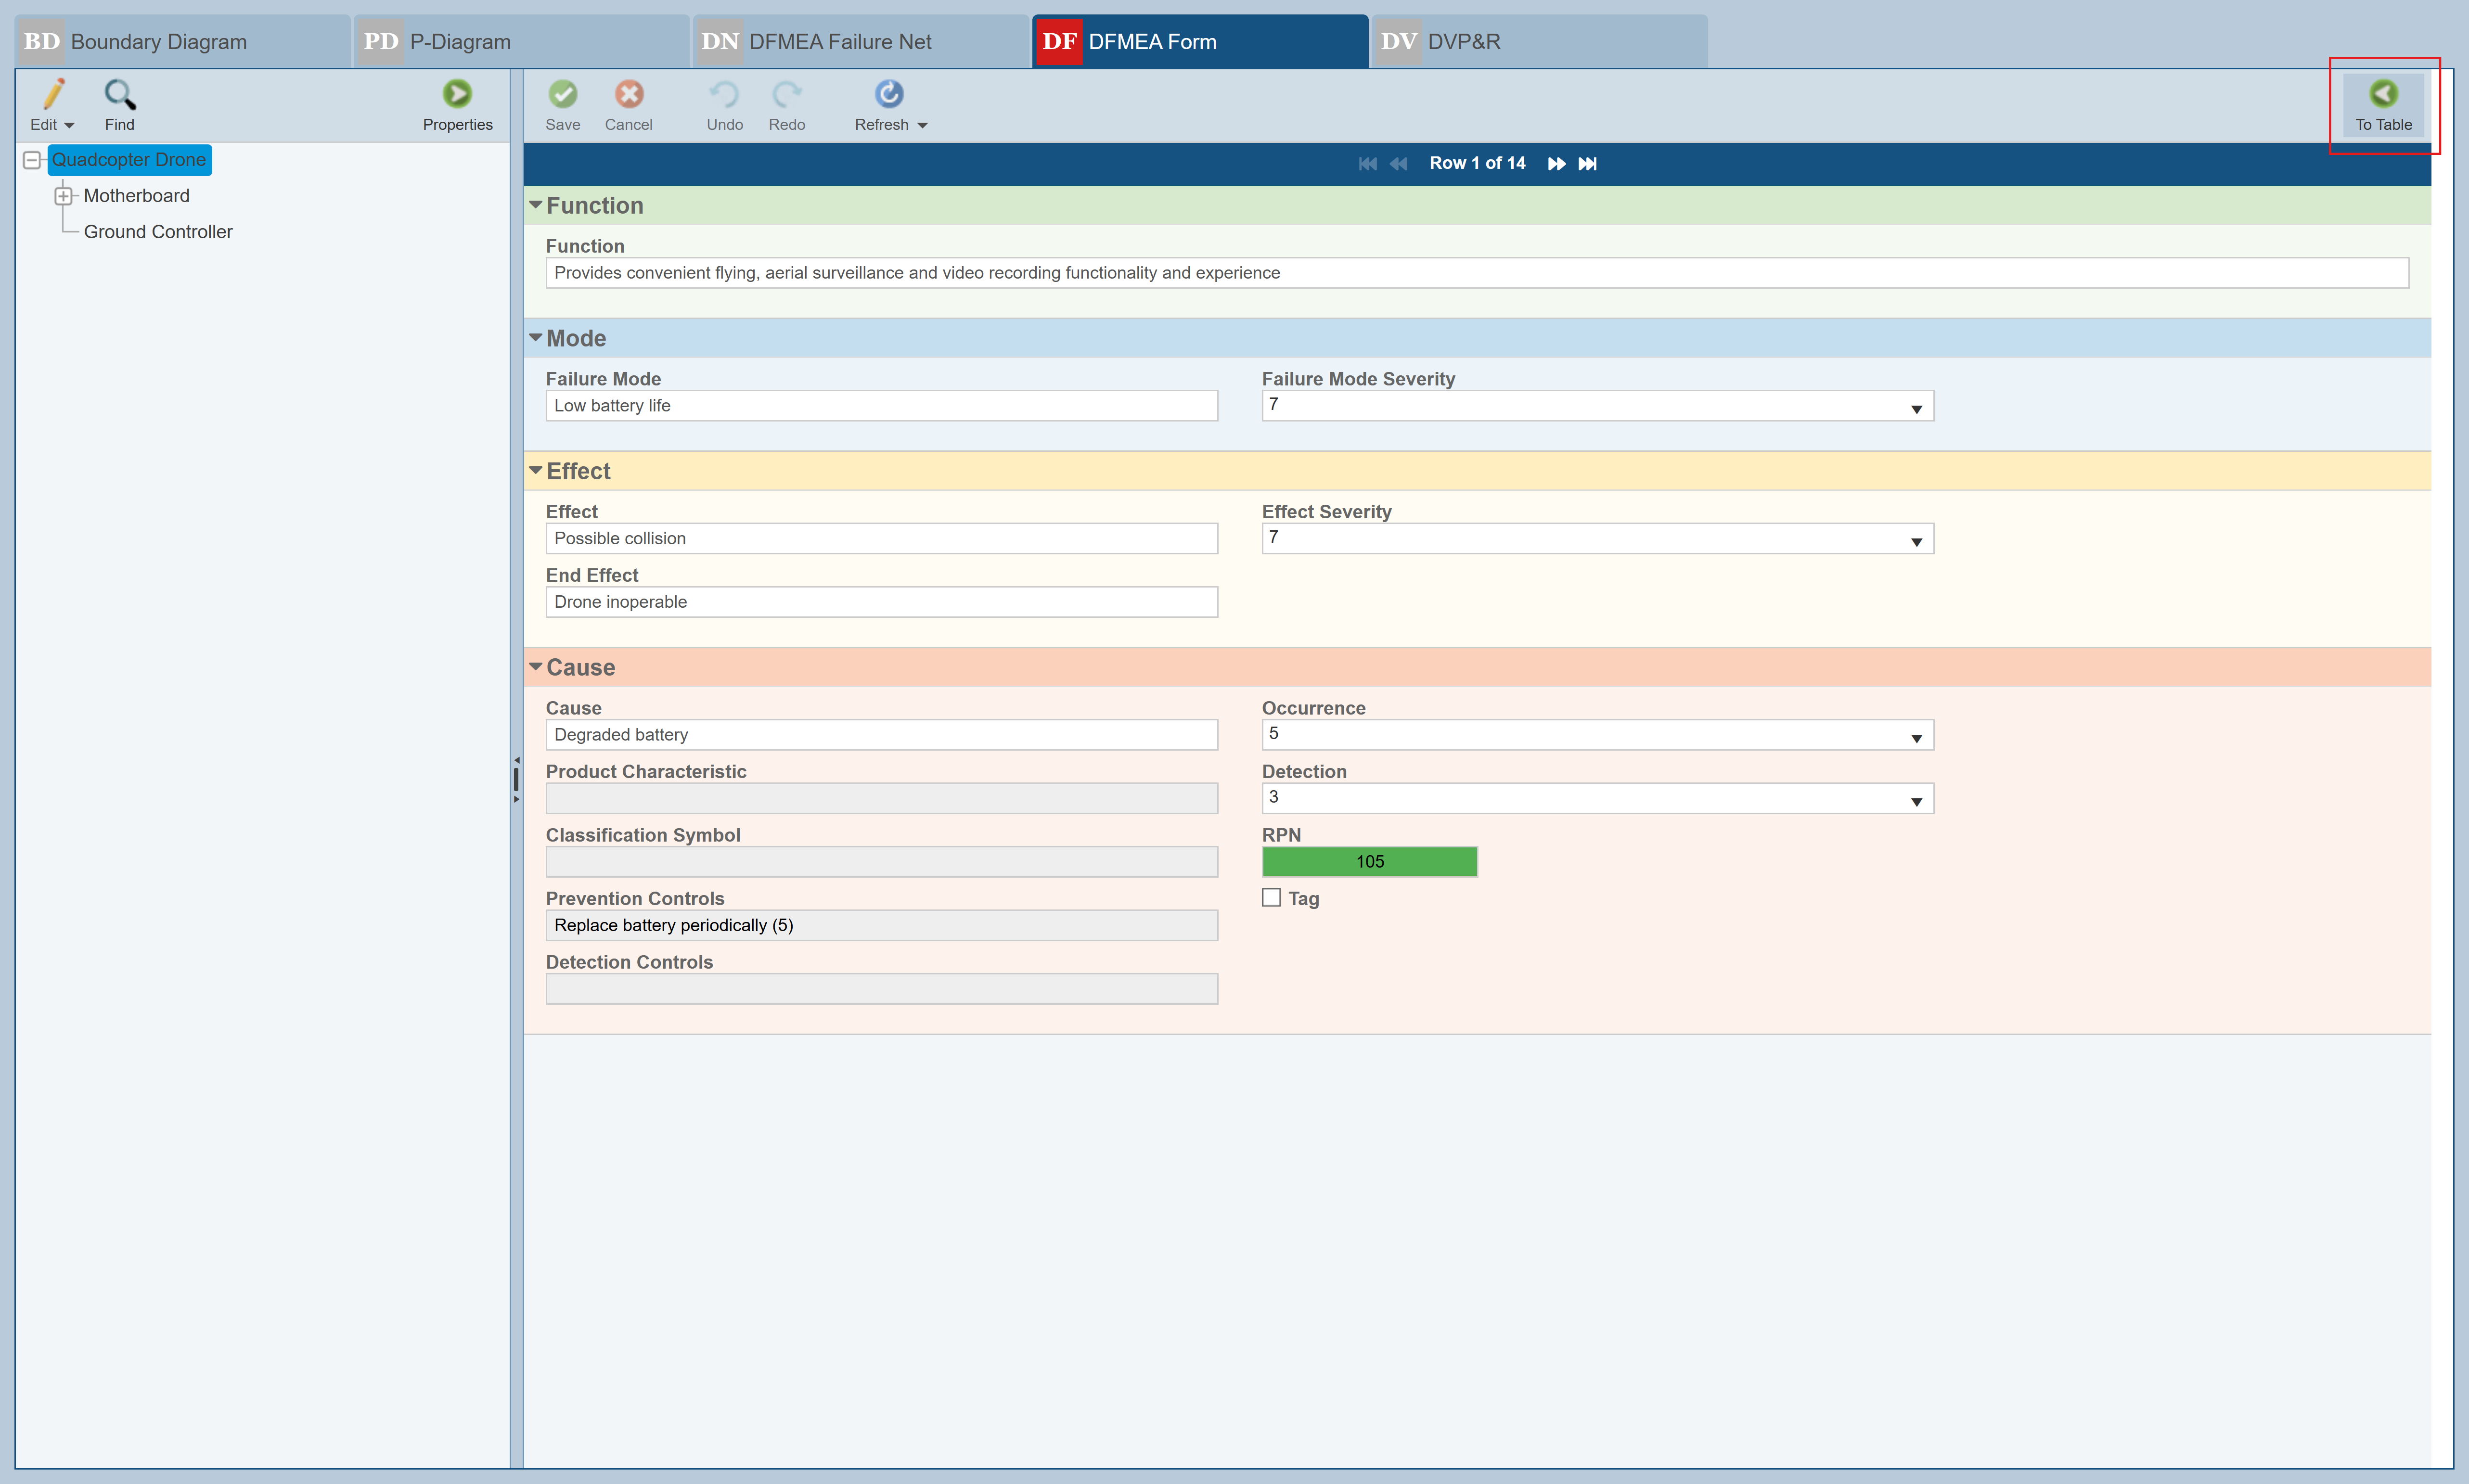
You can also view your FMEA data in a form view. Click the To Form button on the right side of the toolbar to view the FMEA Form tab.
The FMEA Form view enables you to see an expanded view of the same data that is in your FMEA Worksheet.

The Form view has navigation buttons to allow you to move between all the FMEA items on your Worksheet.

To go back to the FMEA Worksheet, click the To Table button in the toolbar.
DVP&R Worksheet
The fifth tab displays the DVP&R worksheet. DVP&R is an acronym for Design Verification Plan and Report. DVP&R allows you to track the plan you will use to ensure that your product or system meets its design requirements. See the DVP&R: Design Verification Plan and Report topic in the Relyence FMEA Advanced Features section for more information on DVP&R. For the purposes of this Getting Started Guide, we will simply review the example DVP&R worksheet.
Click the DVP&R tab to activate the DVP&R worksheet.

The DVP&R worksheet becomes active.
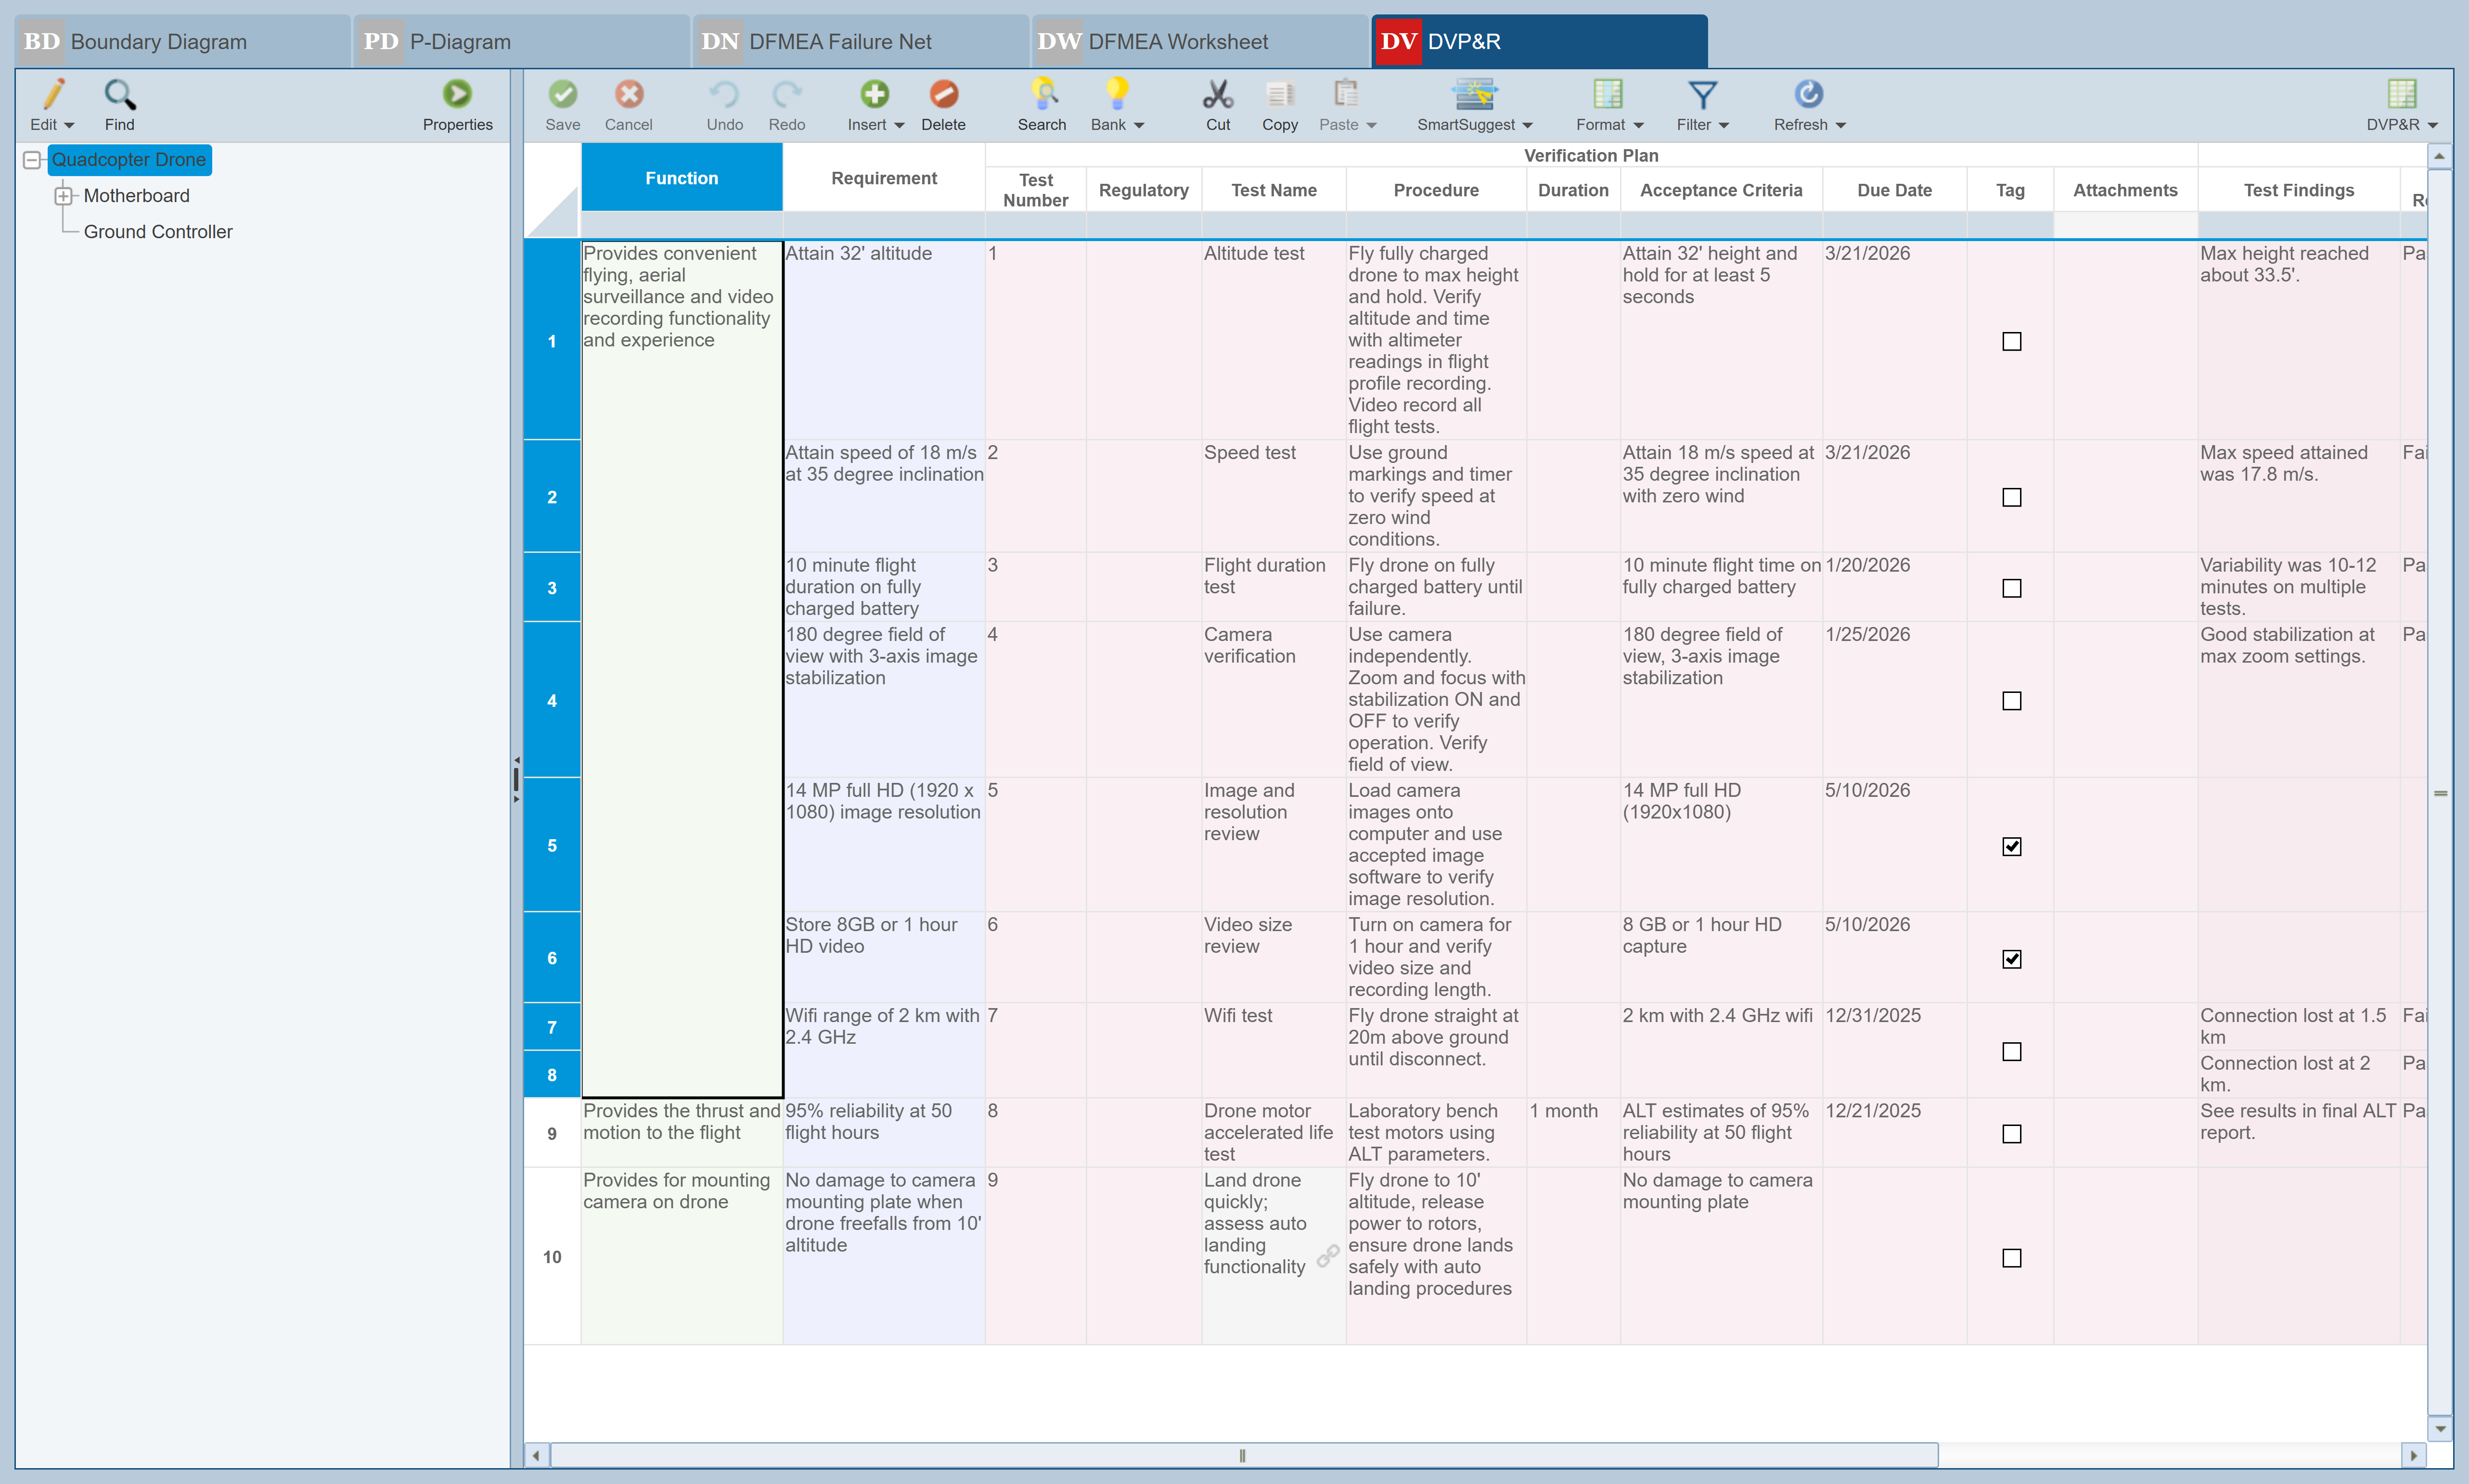
The DVP&R worksheet is color-coded as well. The main elements of the DVP&R worksheet include the Functions, the Requirements, the Verification Plans details, and the resulting Verification Reports details. Relyence FMEA automatically keeps the Functions in your DFMEA Worksheet and DVP&R worksheet in sync. Therefore, if you add or delete a Function in one worksheet, it is automatically added or deleted in the other.
In the Example Drone Analysis DVP&R, you can see that several Requirements are associated with the "Provides convenient flying, aerial surveillance and video recording functionality and experience" Function. Each Requirement has associated Verification Plan information. The Plan information specifies the test plan you intend to use to validate that the associated requirement is met. Once the Verification Plan has been completed, the Verification Report section is completed with the results of the test. You indicate if the test passed or failed and include any other details you would like.
Review the DVP&R data for our Example Drone Analysis. Just as the FMEA Worksheet can be customized, the DVP&R worksheet can be customized as you prefer. See the Customizing the FMEA Worksheets topic for more information.
Click the DFMEA Worksheet tab to return to the DFMEA Worksheet.
4. Report
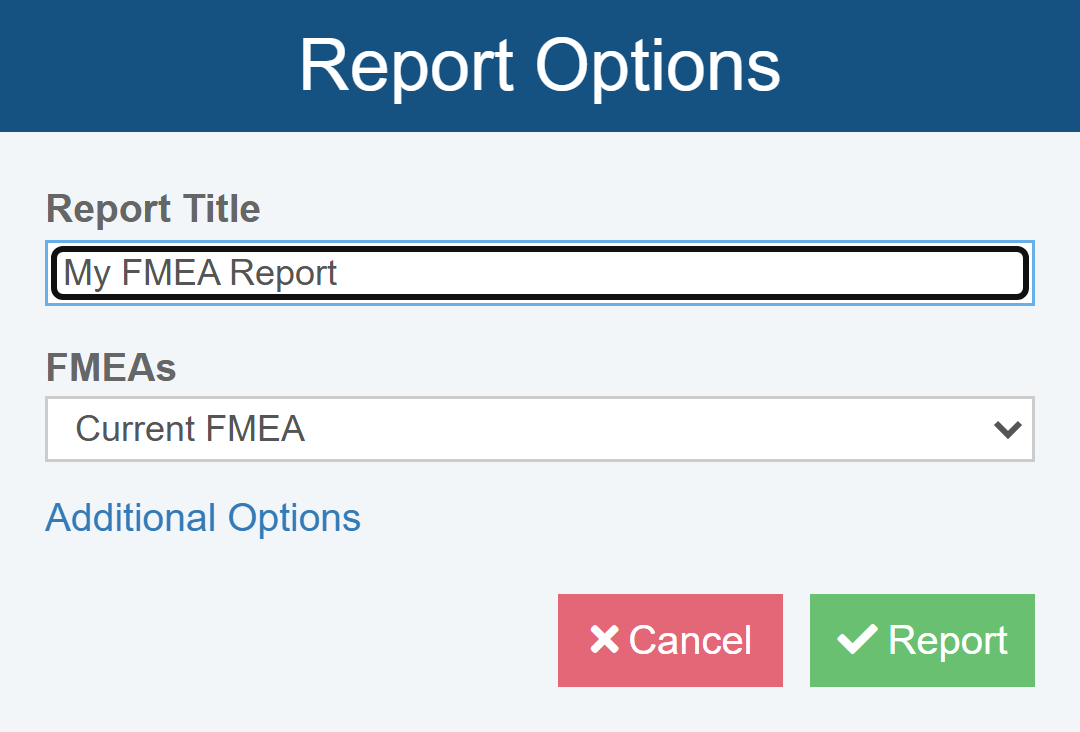
To generate a report of your DFMEA Worksheet, click Report from the Sidebar.
The Report Options dialog appears.
For this example, enter "My FMEA Report" as the Report Title, and for FMEAs, select Current FMEA.
Click Additional Options for more reporting customization features. The Additional Options dialog appears.
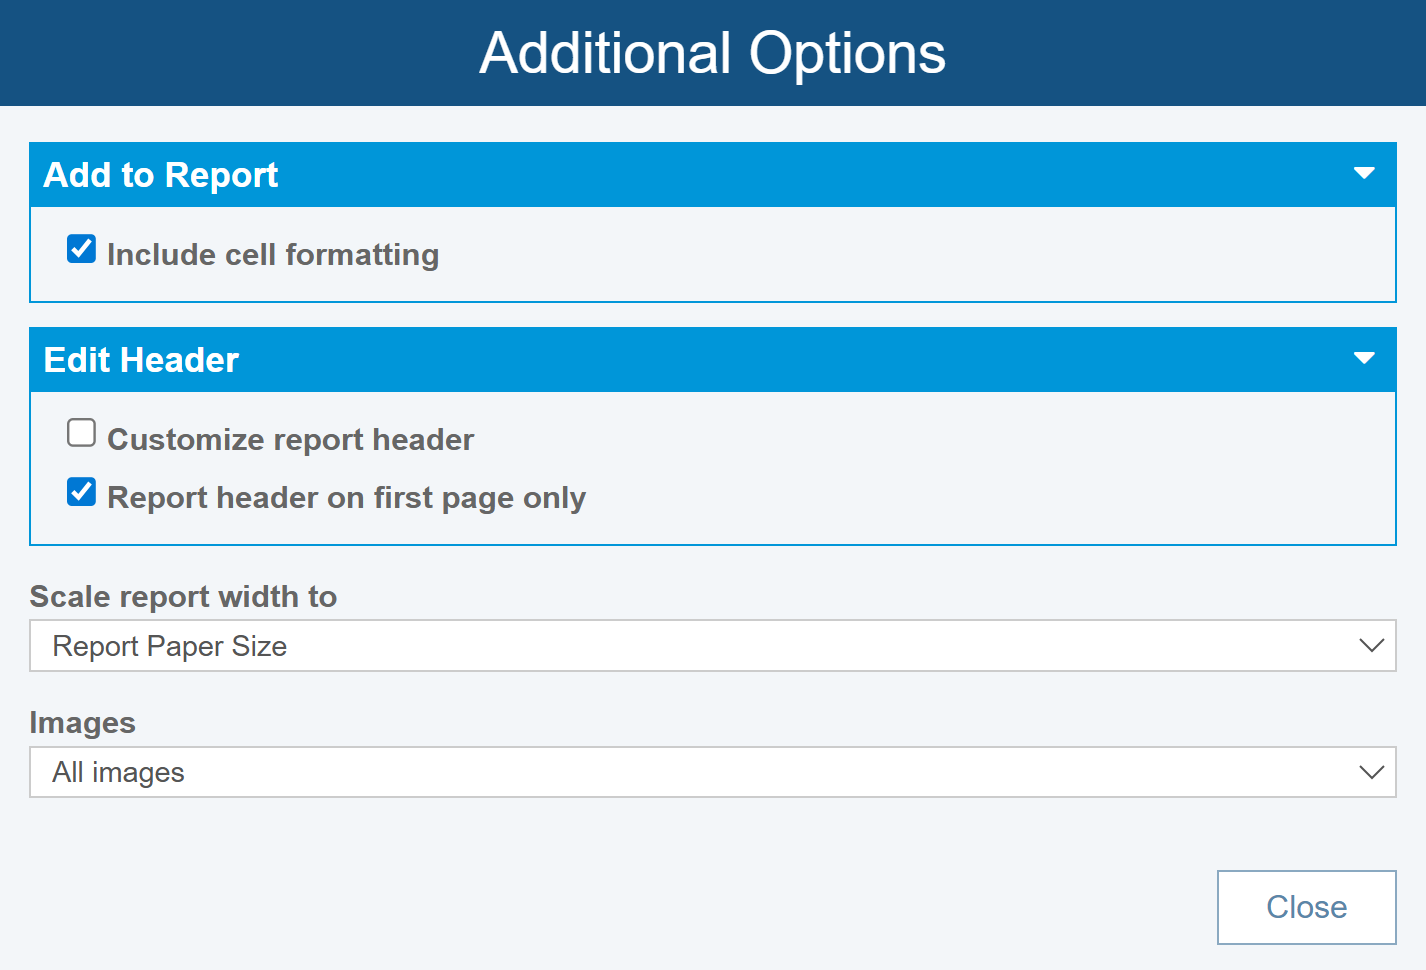
Change the Scale report width to selection to Table Size.
For more details about other features on the Additional Options dialog, see Generating FMEA Reports.
Click Close to save the Additional Options settings.
Click Report to generate the report.
The report appears in a new browser tab. If needed, click the Toggle FullPage/PageWidth button  to see the full report.
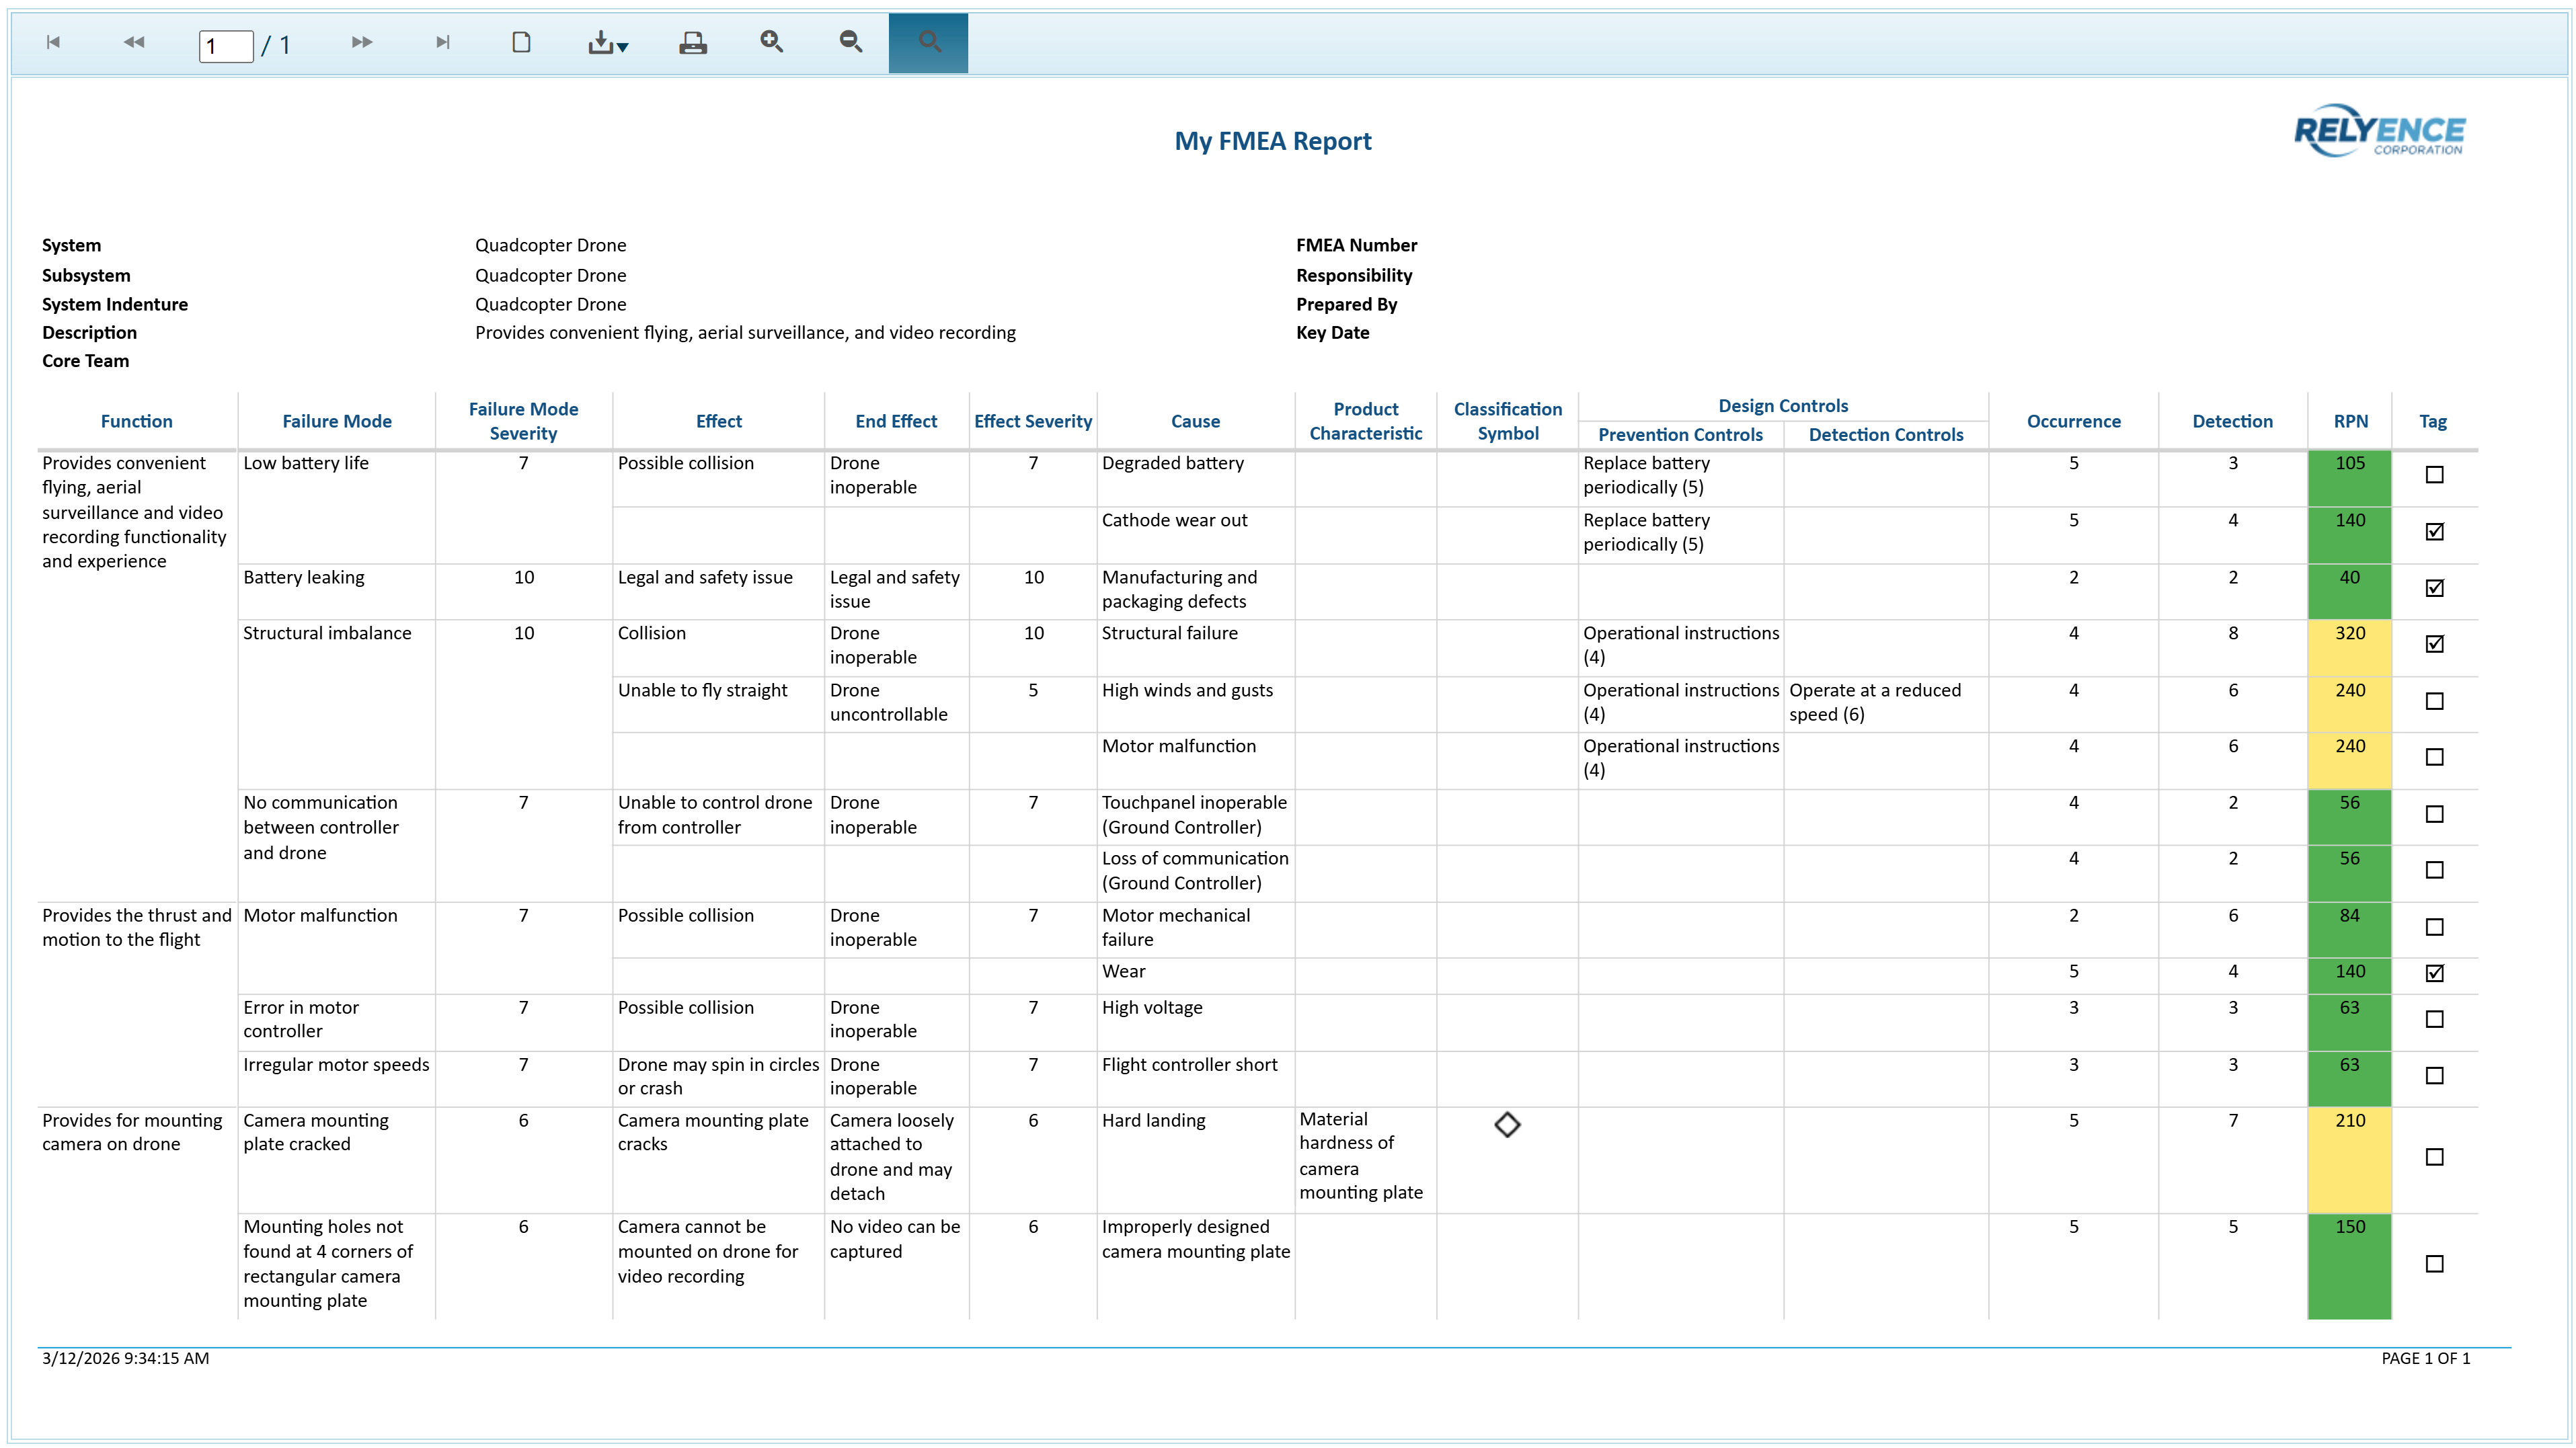
You can print the report, or save it in a PDF, Excel, PowerPoint, TIFF, or Word format.
Close the Report browser tab when you are done viewing the report.
5. Adding FMEA data
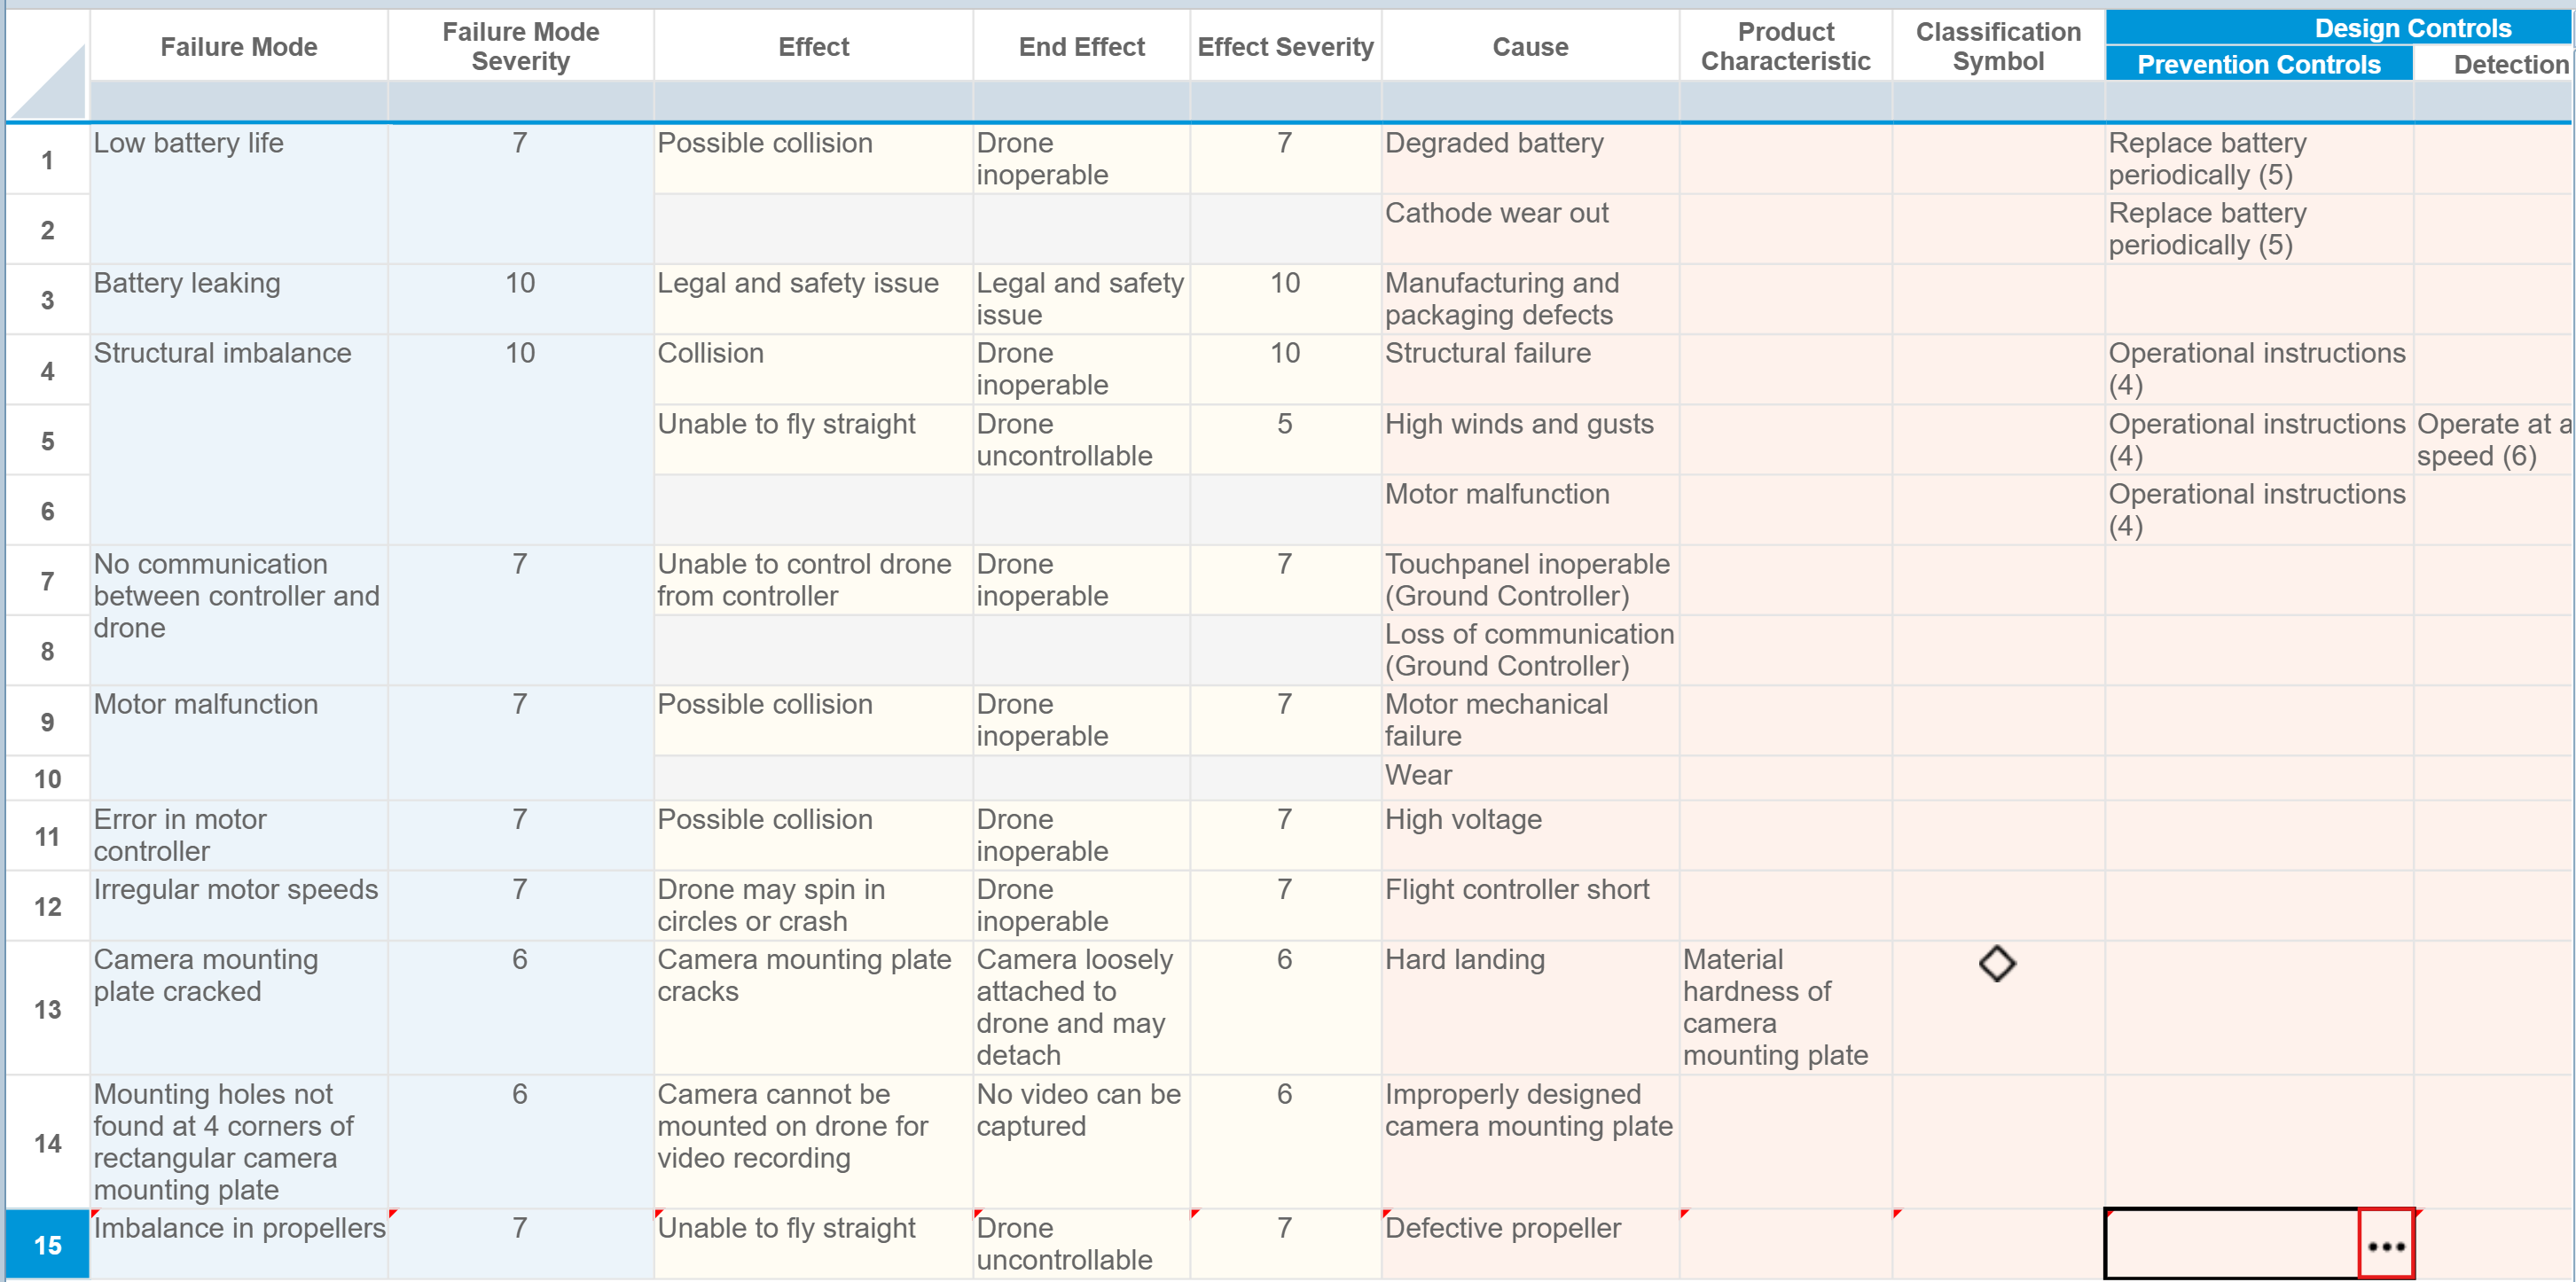
We are now going to add more analysis data into our DFMEA. We want to add information about the failures that could be caused by the drone propellers.
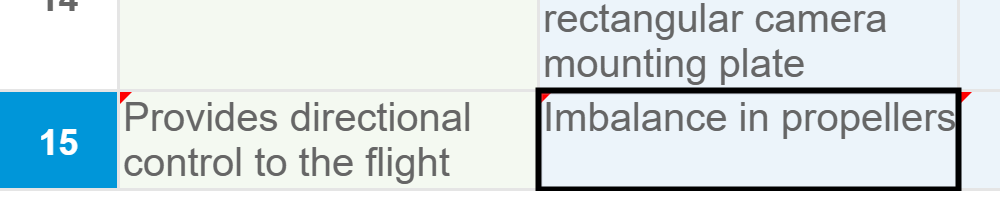
Make sure the Quadcopter Drone is selected in the Analysis Tree. Click on the third function in the DFMEA Worksheet "Provides for mounting camera on drone".
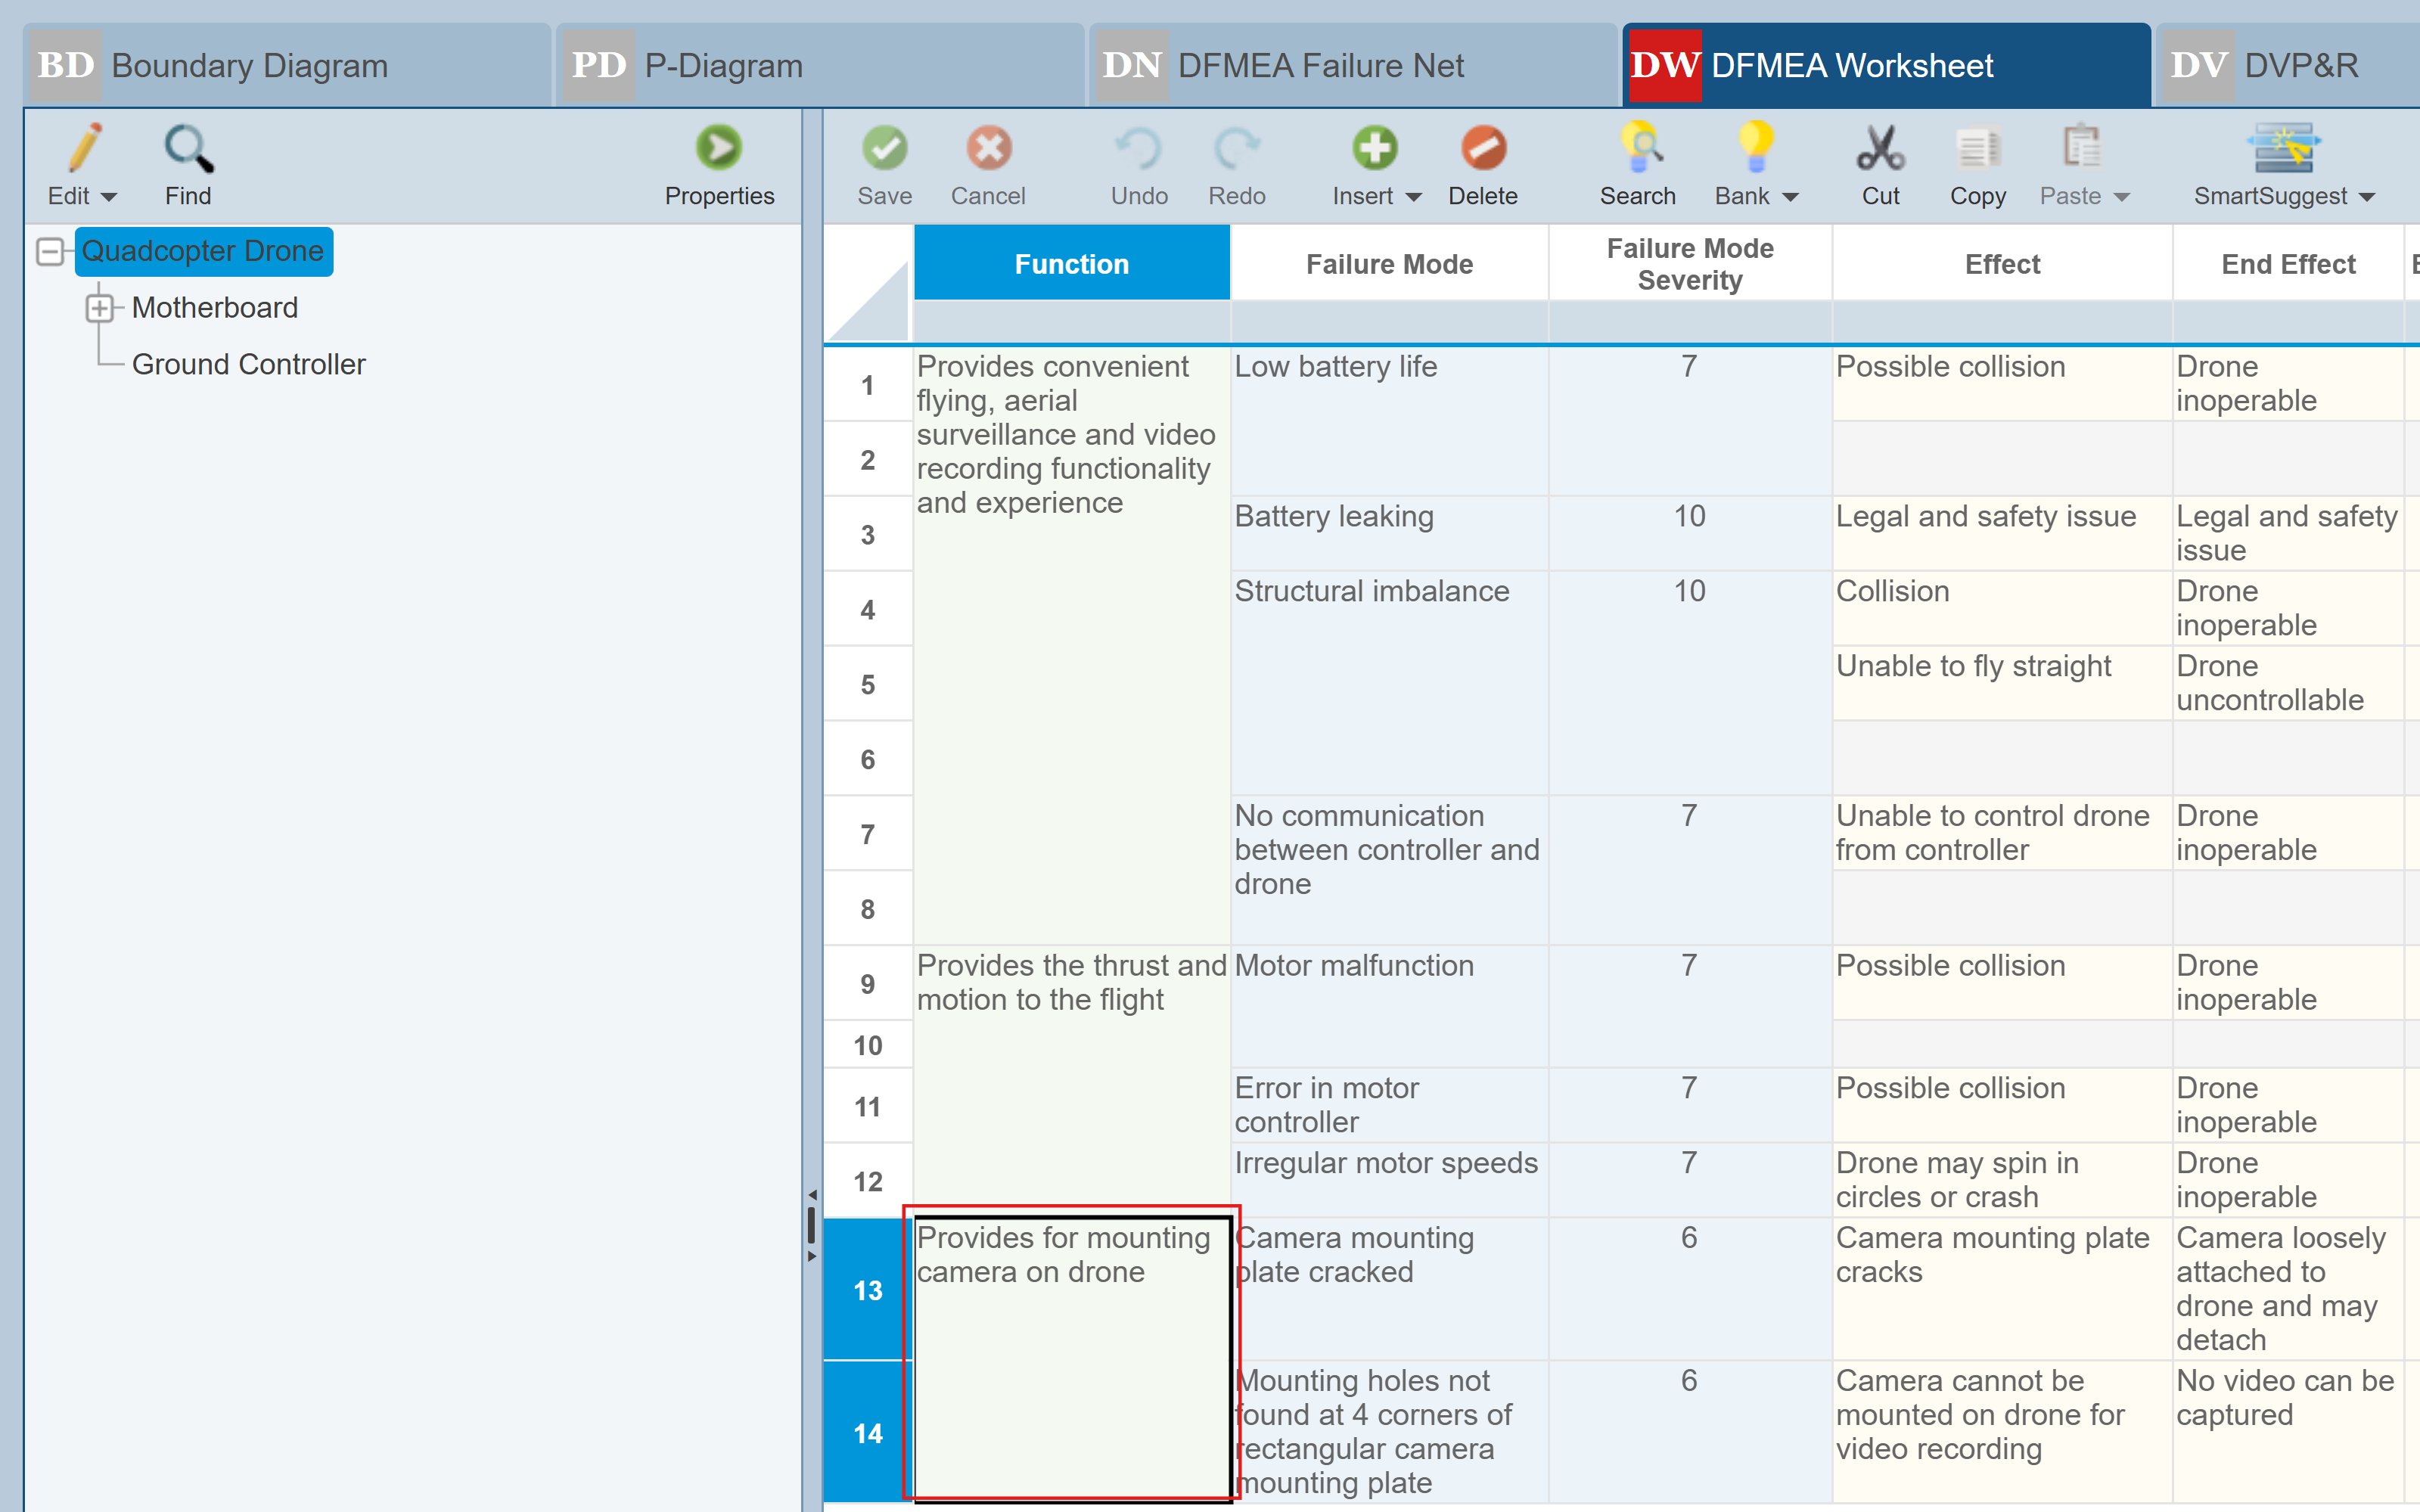
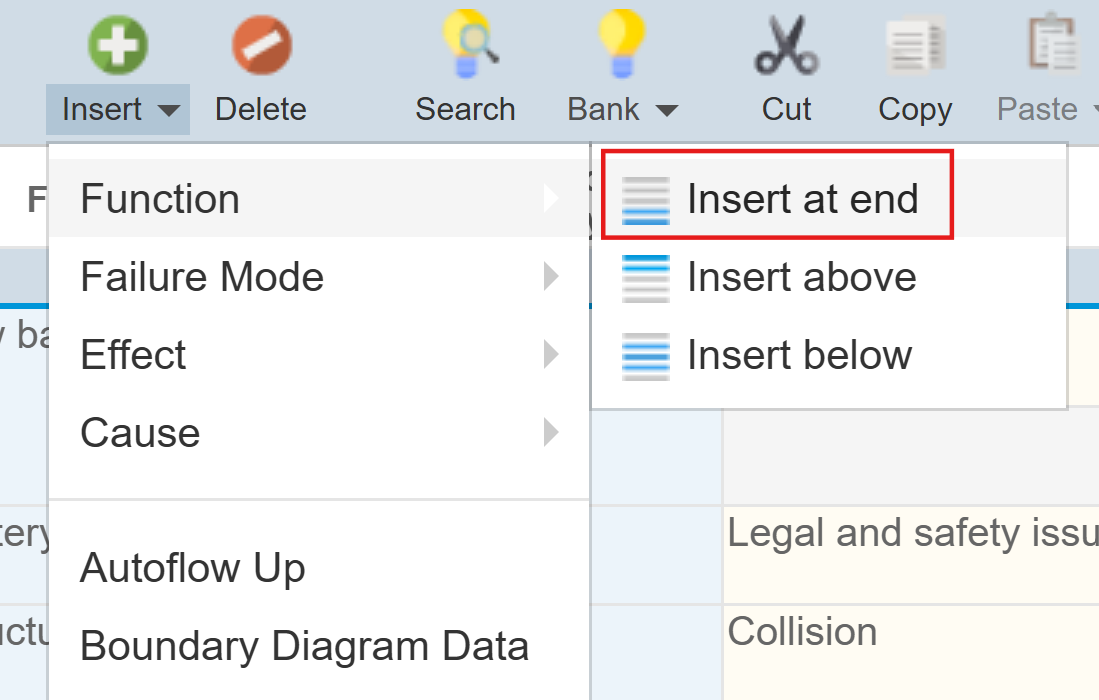
In the toolbar, click on the dropdown arrow next to Insert and select Function and Insert at end to add a fourth Function to the Worksheet.
Enter "Provides directional control to the flight". Once you have entered at least, you will see that Relyence FMEA displays a list of choices that match according to what you are typing. The autosuggest feature allows you to reuse data as much as possible when performing your FMEAs; it will provide suggestions based on previously used phrases. Reusing phrases helps with maintaining consistency throughout your FMEAs. In this case, we do not want to reuse any of the autosuggest options shown, so complete typing the phase to enter our new Function and press the Tab key. (Note: The autosuggest feature can be disabled if you prefer. Click Properties from the Sidebar to bring up the FMEA Properties dialog and on the General tab clear the Autosuggest checkbox.)
Now enter the following data in the DFMEA Worksheet fields. Click the Tab key after you have completed typing in each cell to move to the next column.
Failure Mode: Imbalance in propellers
Failure Mode Severity: Leave blank. You can assign a severity for this failure mode, or you can assign a severity for each failure effect of this failure mode and Relyence will automatically set it equal to the severity of the failure effect with the highest severity. The choice is yours depending on how you conduct your FMEA. You may choose to evaluate each failure effect for each failure mode individually, or you may decide to assign a severity to the failure mode directly. If you assign severities to the failure effects, Relyence will always determine the failure mode severity.
Effect: Unable to fly straight. Use the autosuggest to select this from the list.
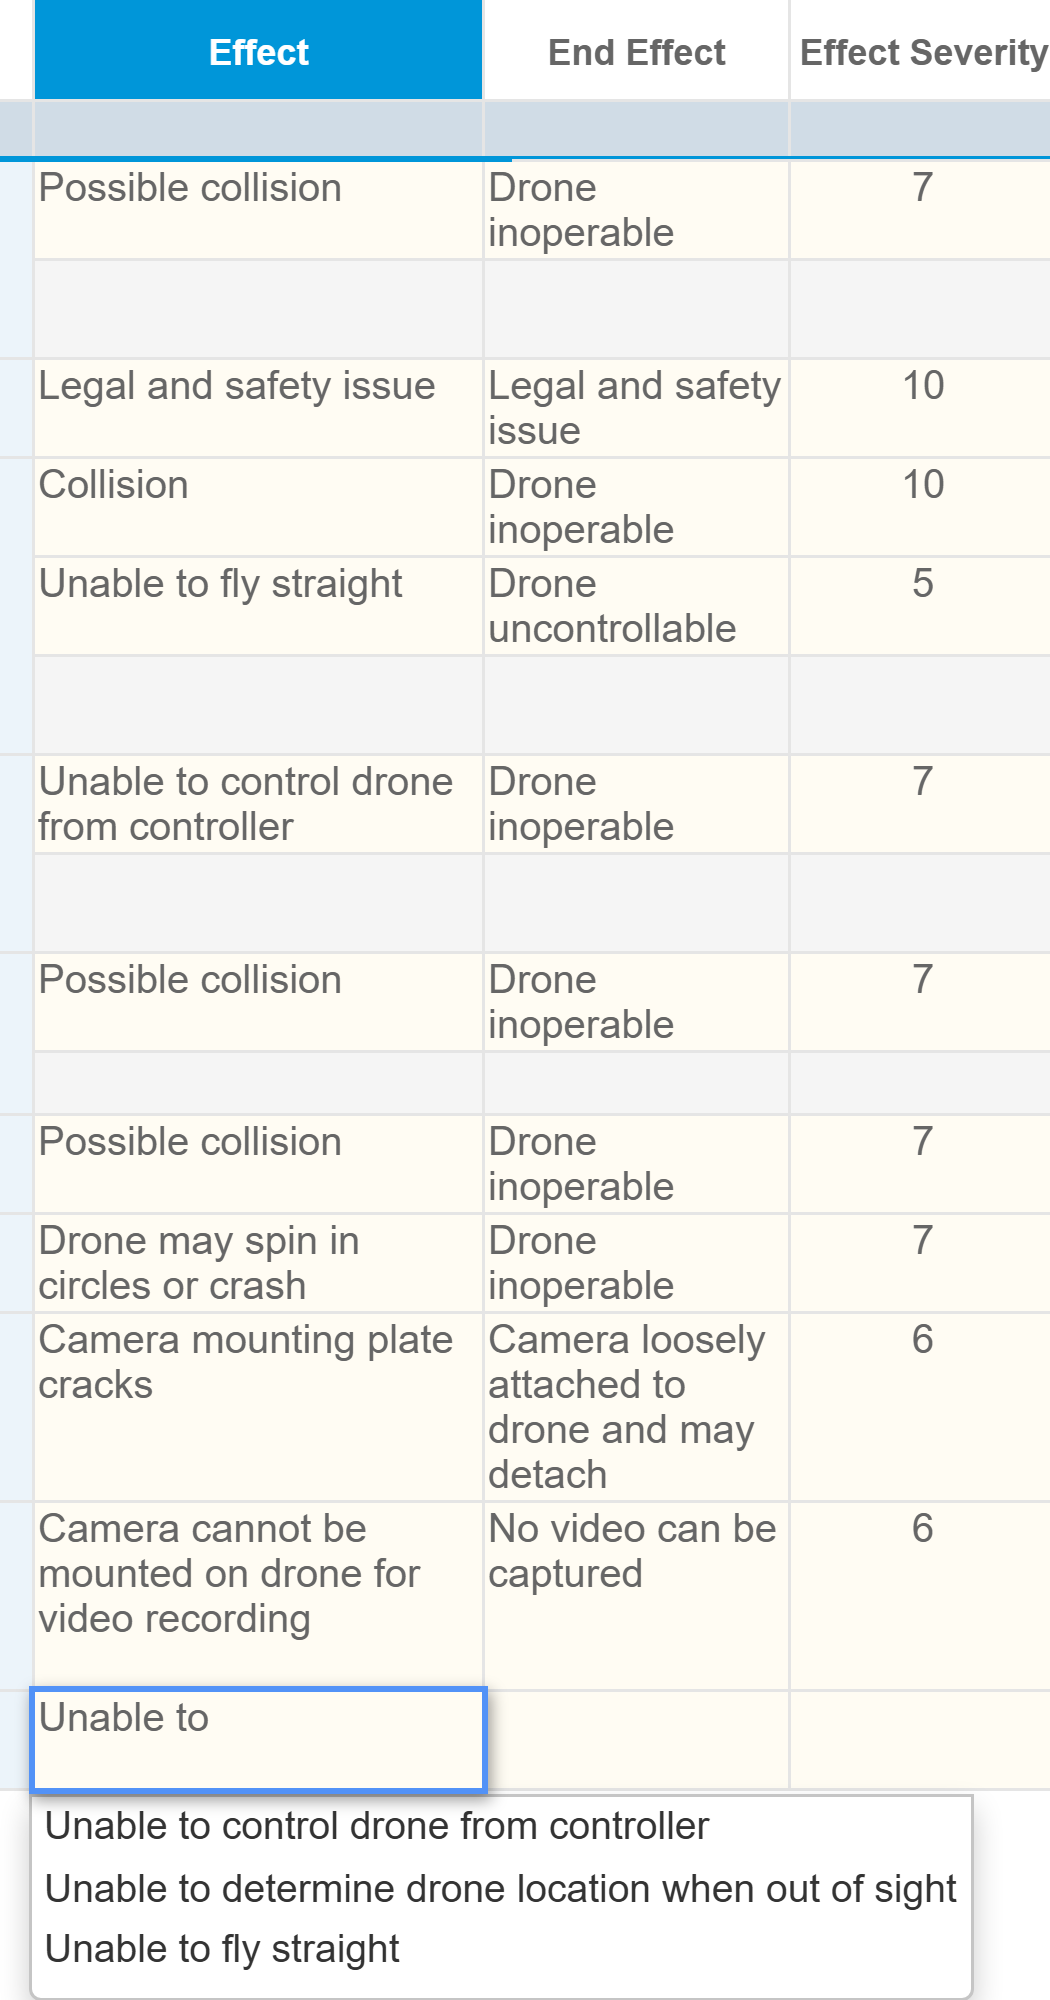
End Effect: Drone uncontrollable. Use the autosuggest to select this from the list.
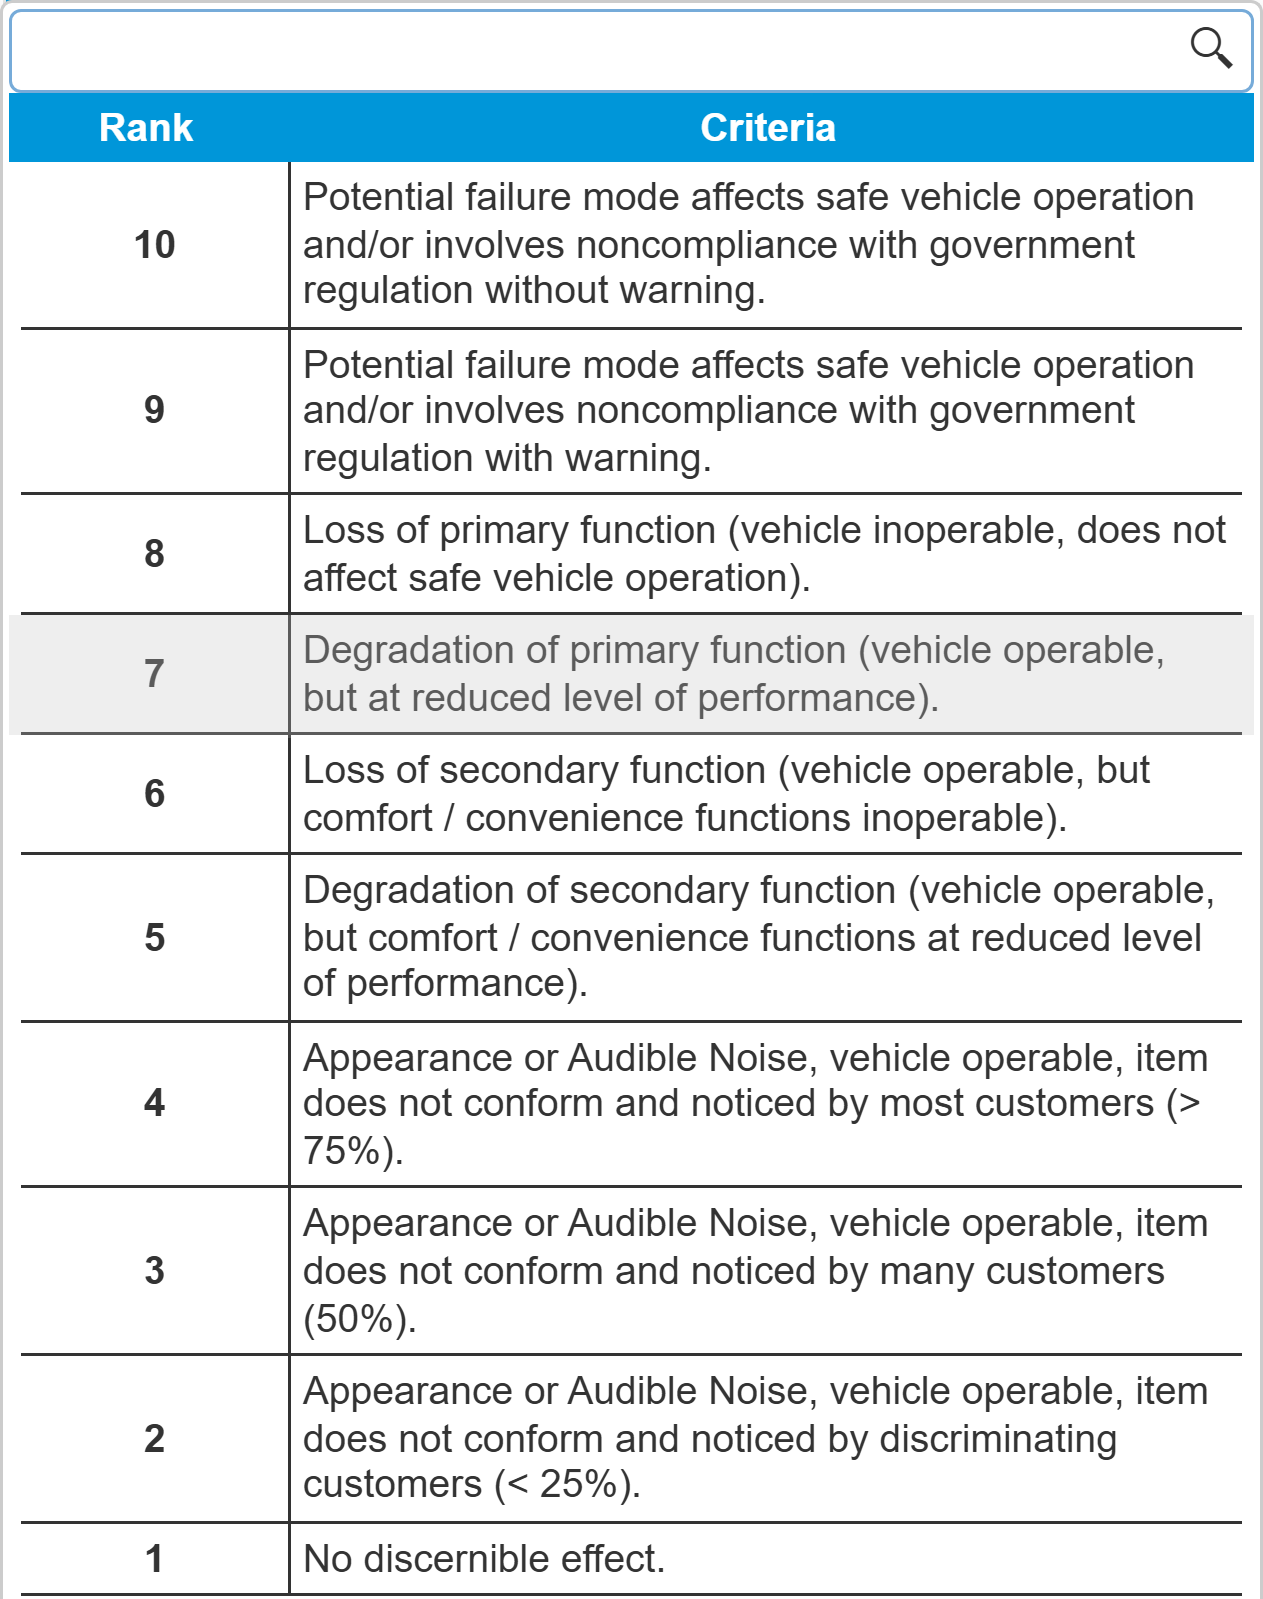
Effect Severity: 7. You can use the dropdown list or enter the value directly. Use the dropdown list to see the commonly used descriptions of Severity levels. Please note that these are the default Rank and Criteria used in the Relyence Example; these can be customized to your needs. If your list looks different than those shown below, your Risk Criteria have been customized. Notice that when you select the failure Effect Severity, the Failure Mode Severity is automatically filled in once you press the Tab key.
Cause: Defective propeller
Product Characteristic: Leave blank. You can assign Product Characteristic for this cause. Product Characteristics can be assigned on the DFMEA Worksheet, PFMEA Worksheet and/or FMEA-MSR Worksheet as needed. For more information, see the Using Product Characteristics topic.
Classification Symbol: Leave blank.
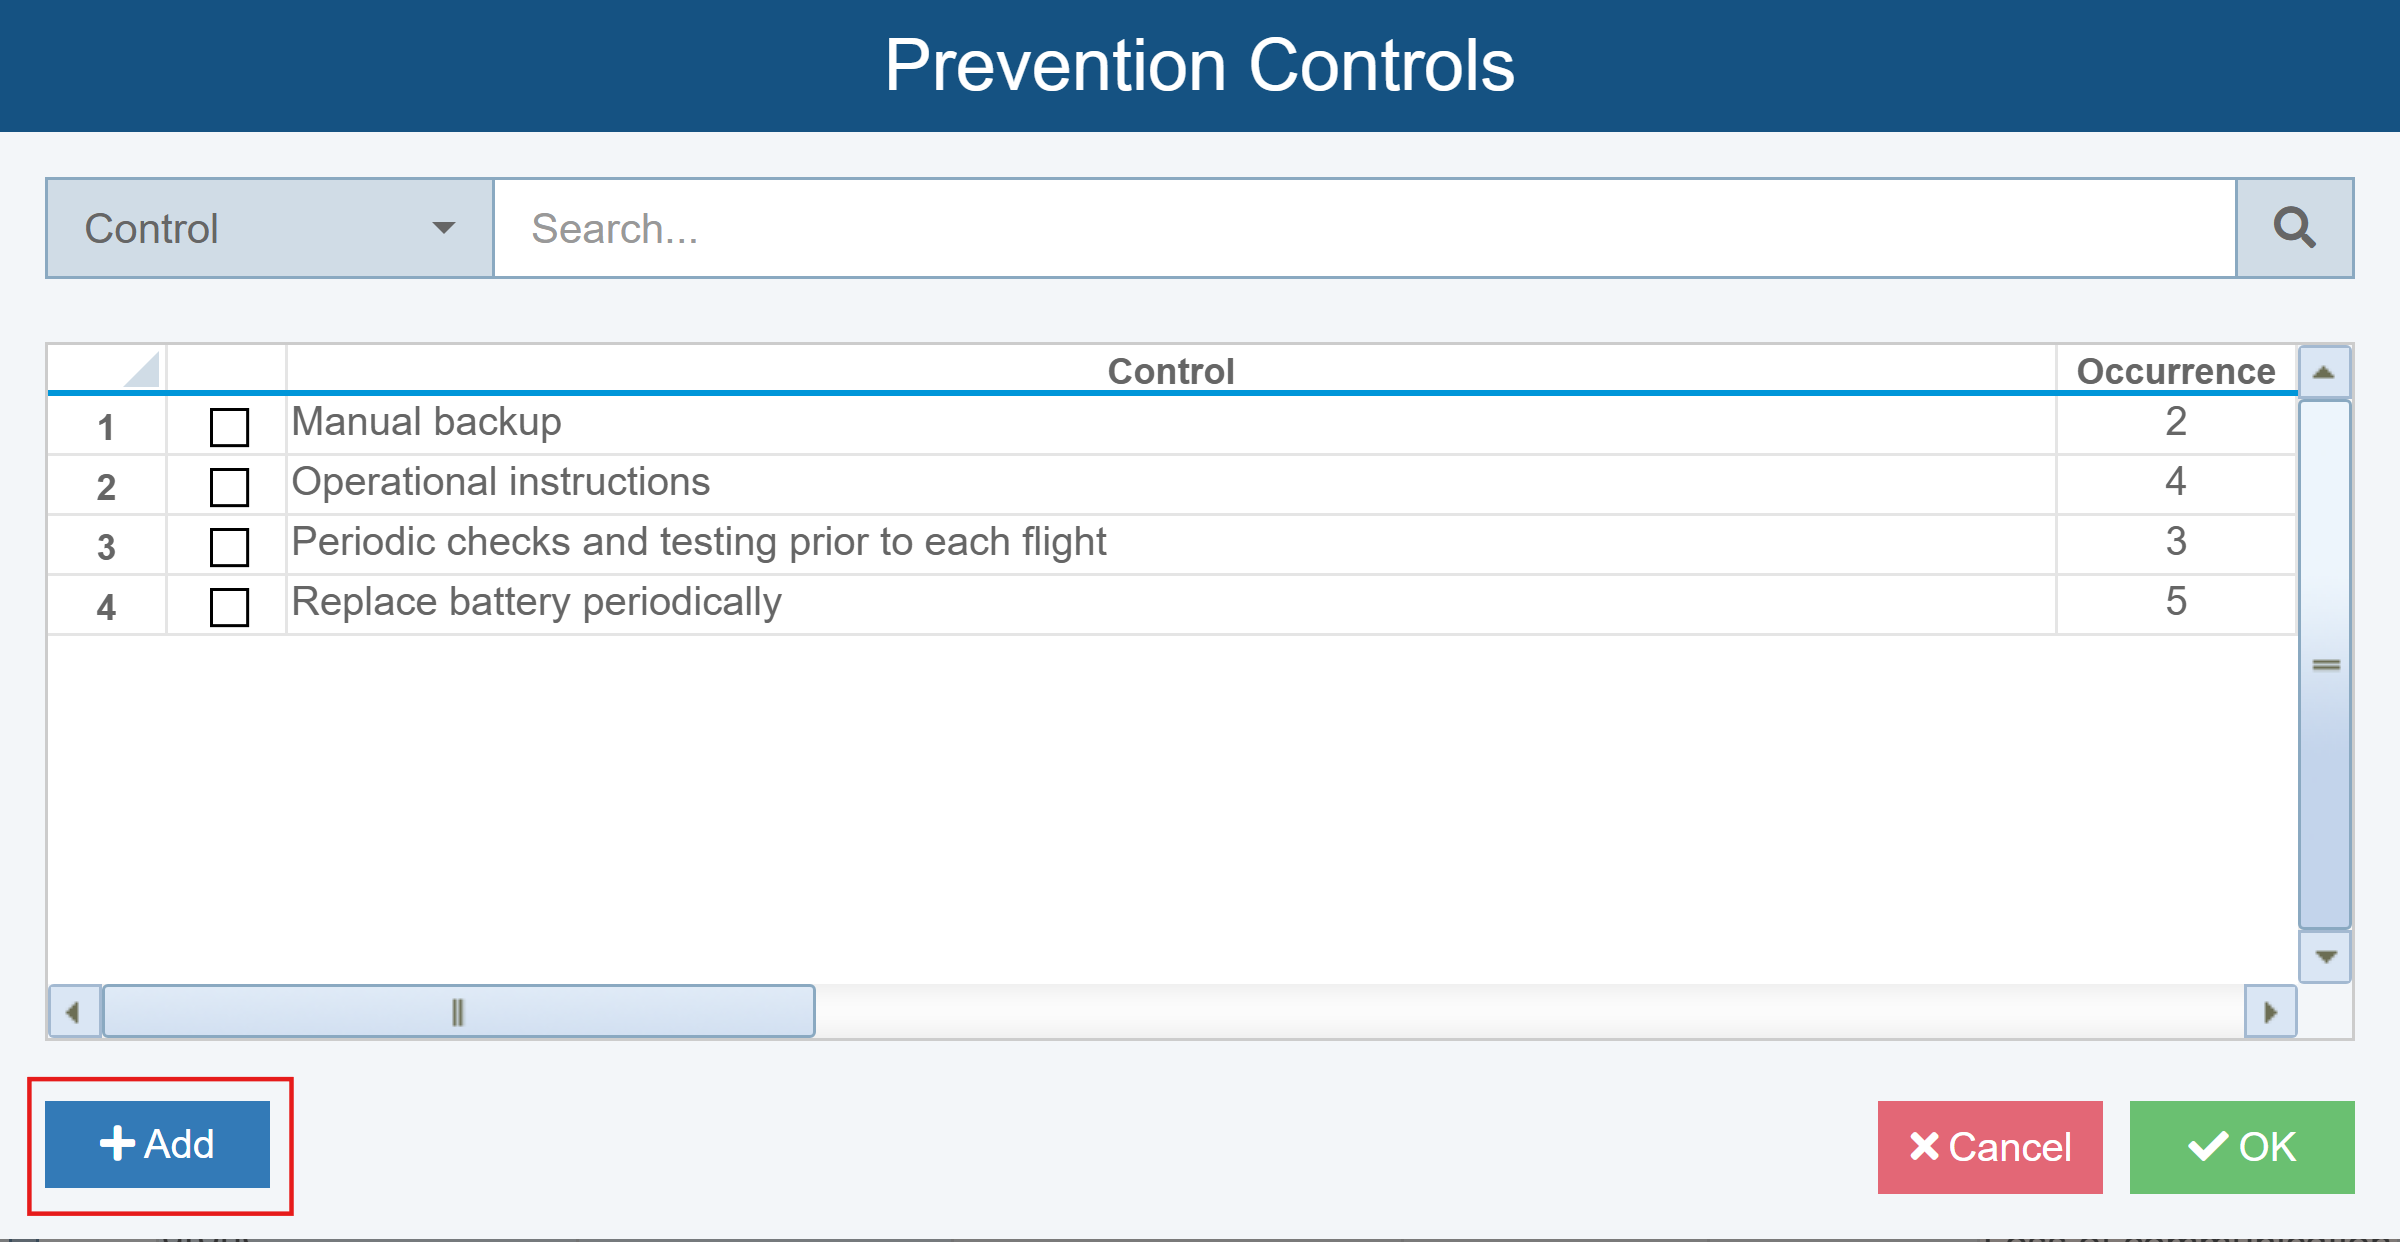
Prevention Controls: Prevention and Detection Controls are special fields in FMEAs because keeping this information consistent across all your FMEA elements is critical to effectively managing and controlling your analysis data. Controls apply to your Design FMEA, Process FMEA, and Control Plans. To enter the prevention control for this failure mode, click on the Control Selector button to the right of the field.
The Prevention Controls dialog appears.
If the appropriate controls are in the list, you can select the checkboxes to add them. You can also use the Find function to filter the list to a set of matching items if the list is long. You can also remove controls by clearing the checkboxes.
In this case, we want to add a new control. Click the Add button.
The New Control dialog appears.
For Control, enter Visual inspection of propellers.
For Occurrence, select 3.
Click OK.
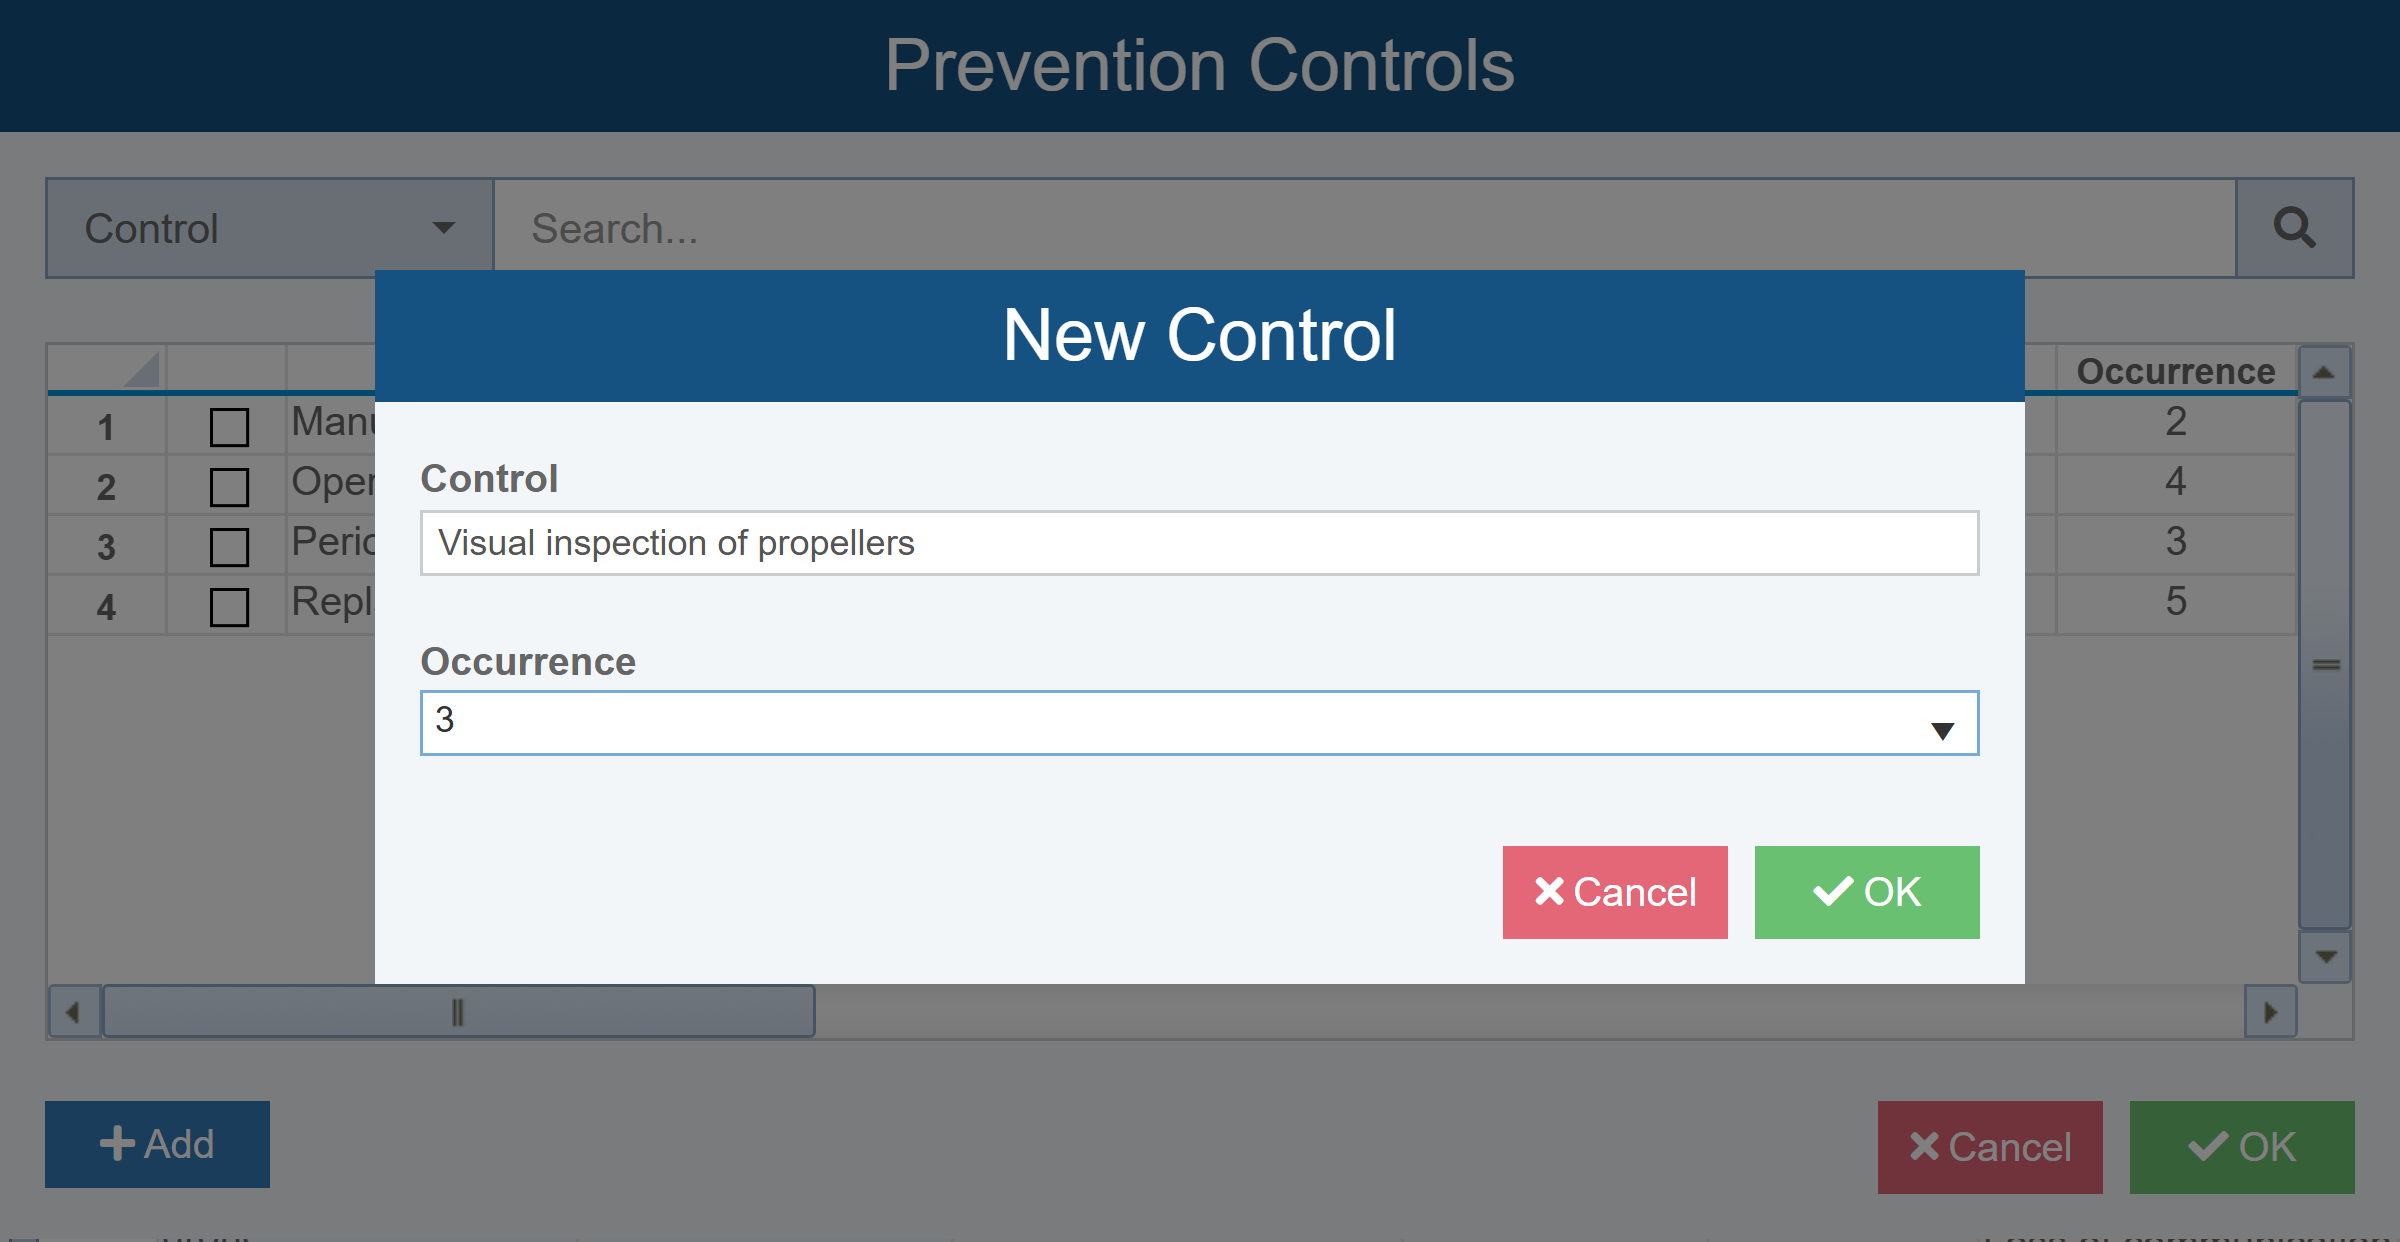
The new Control is added to the list and automatically selected; its corresponding Occurrence value is also entered in the Occurrence field and shown in parentheses within the Prevention Control field.
Click OK to close the Prevention Controls dialog. The new prevention control appears in your Worksheet. If you want to go back and edit the Controls list at any time, select Configure>FMEA>Controls from the Sidebar menu. For more information about Controls, see the Managing FMEA Prevention and Detection Controls topic. In some cases, it may be preferable to enter your Prevention and Detection Controls before completing your FMEA Worksheet so the available options are automatically shown.
Detection Controls: Leave blank.
Occurrence: Note the value entered, as applicable for the selected Prevention Control.
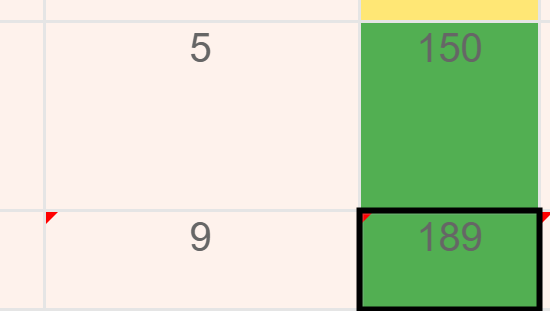
Detection: 9. Once you tab off the Detection column, you will see the RPN value is automatically calculated and color-coded.
Tag: Leave clear.
When completed, you will have a new line item in your Worksheet.

Now, let's go back and enter an additional Failure Mode. Go back to the Failure Mode column and select your newly entered "Imbalance in propellers" failure mode by clicking to select the cell.
From the toolbar, click Insert button. A new blank failure mode is automatically entered.
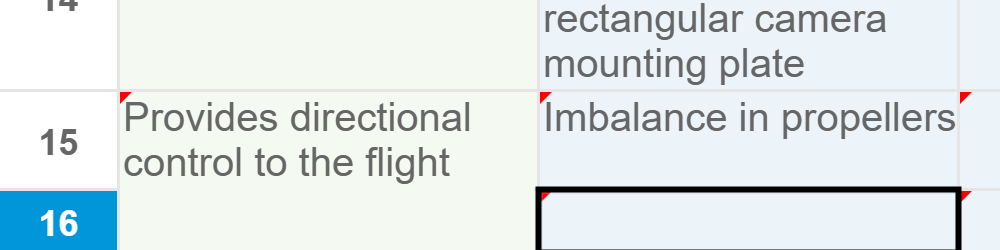
Relyence FMEA detects where you are in the DFMEA Worksheet and intelligently determines what to insert for you. You can always use the dropdown Insert functions from the toolbar to insert the appropriate FMEA item. However, you can click the Insert button at any point to insert items at the level you are on. Also note that on the DFMEA Worksheet, DVP&R Worksheet and other tables in Relyence FMEA, keyboard support for Insert is supported using the <Insert> key and <Ctrl>+<Shift>+<NumPad +>.
For the newly added Failure Mode, enter the following data:
Failure Mode: Bent propeller
Failure Mode Severity: Leave blank.
Effect: Unable to fly straight. Use the autosuggest to select this from the list.
End Effect: Drone uncontrollable. Use the autosuggest to select this from the list.
Effect Severity: 7. You can use the dropdown list or enter the value directly. Use the dropdown list to see the commonly used descriptions of Severity levels.
Cause: Previous crash
Product Characteristic: Leave blank.
Classification Symbol: Leave blank.
Prevention Controls: Select Visual inspection of propellers. (Click the Control Selection button to bring up the Prevention Controls dialog and select the checkbox next to Visual inspection of propellers, then click OK.)
Detection Controls: Leave blank.
Occurrence: Note the value entered, as applicable for the selected Prevention Control.
Detection: 4. You may need to scroll down the dropdown list to see "4". Again, the RPN value is automatically calculated and color-coded once you tab off the Detection column.
Tag: Leave clear.
Notice that all the cells in your DFMEA Worksheet with newly entered data appear with a small red tag in the upper left corner. This indicates that the data is not yet saved. When you have completed all your data entry, click Save from the toolbar. All your changes are saved and the red tag marks no longer appear. You can save as frequently as you would like while performing your FMEA.

In the worksheet toolbar, click Save to save the newly added data.
6. FMEA Actions Library and Workflow, Approvals & Notifications
Relyence FMEA supports an Action Library, which provides an organized approach for managing your Recommended Actions. You can also configure a complete Workflow and Approval process that includes email Notifications for your Recommended Actions tasks.
If the Quadcopter Drone is not active, click on it in the Analysis Tree pane, and then click on the first Function Provides convenient flying, aerial surveillance and video recording functionality and experience to select it.
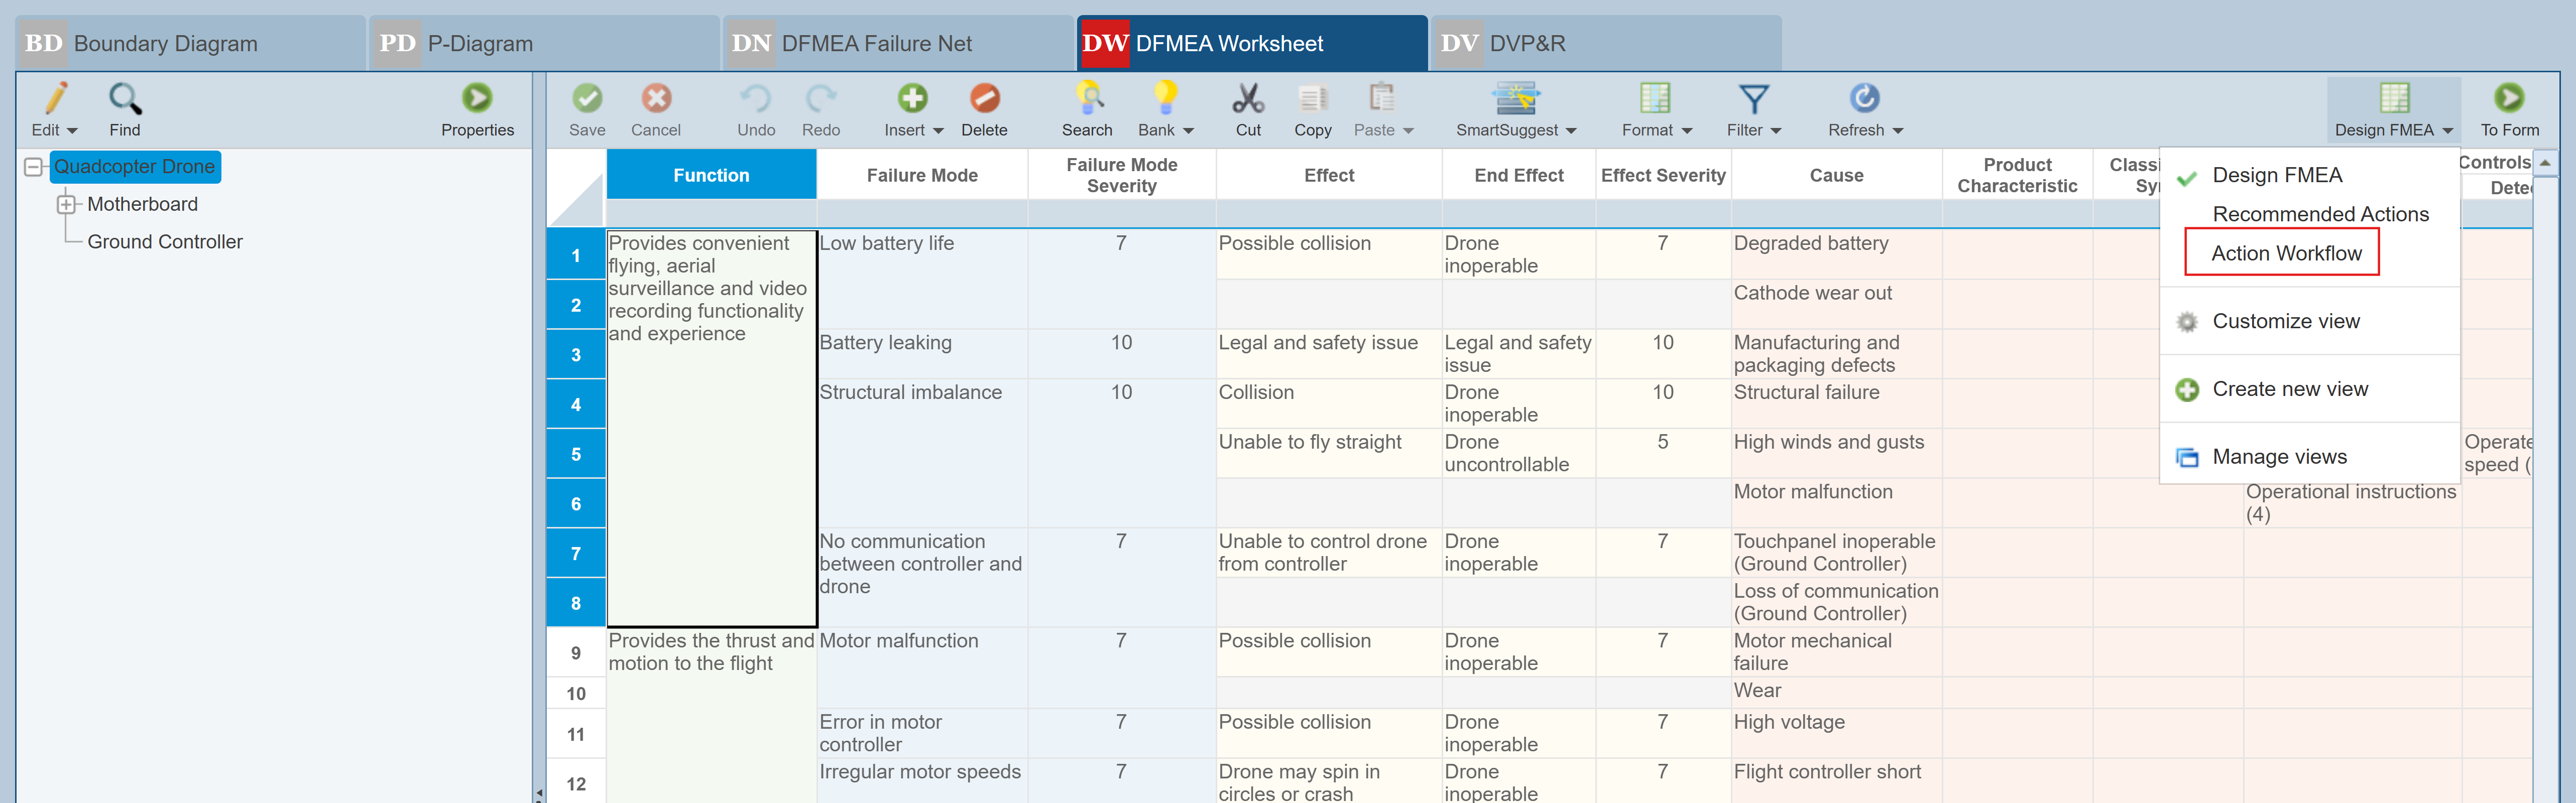
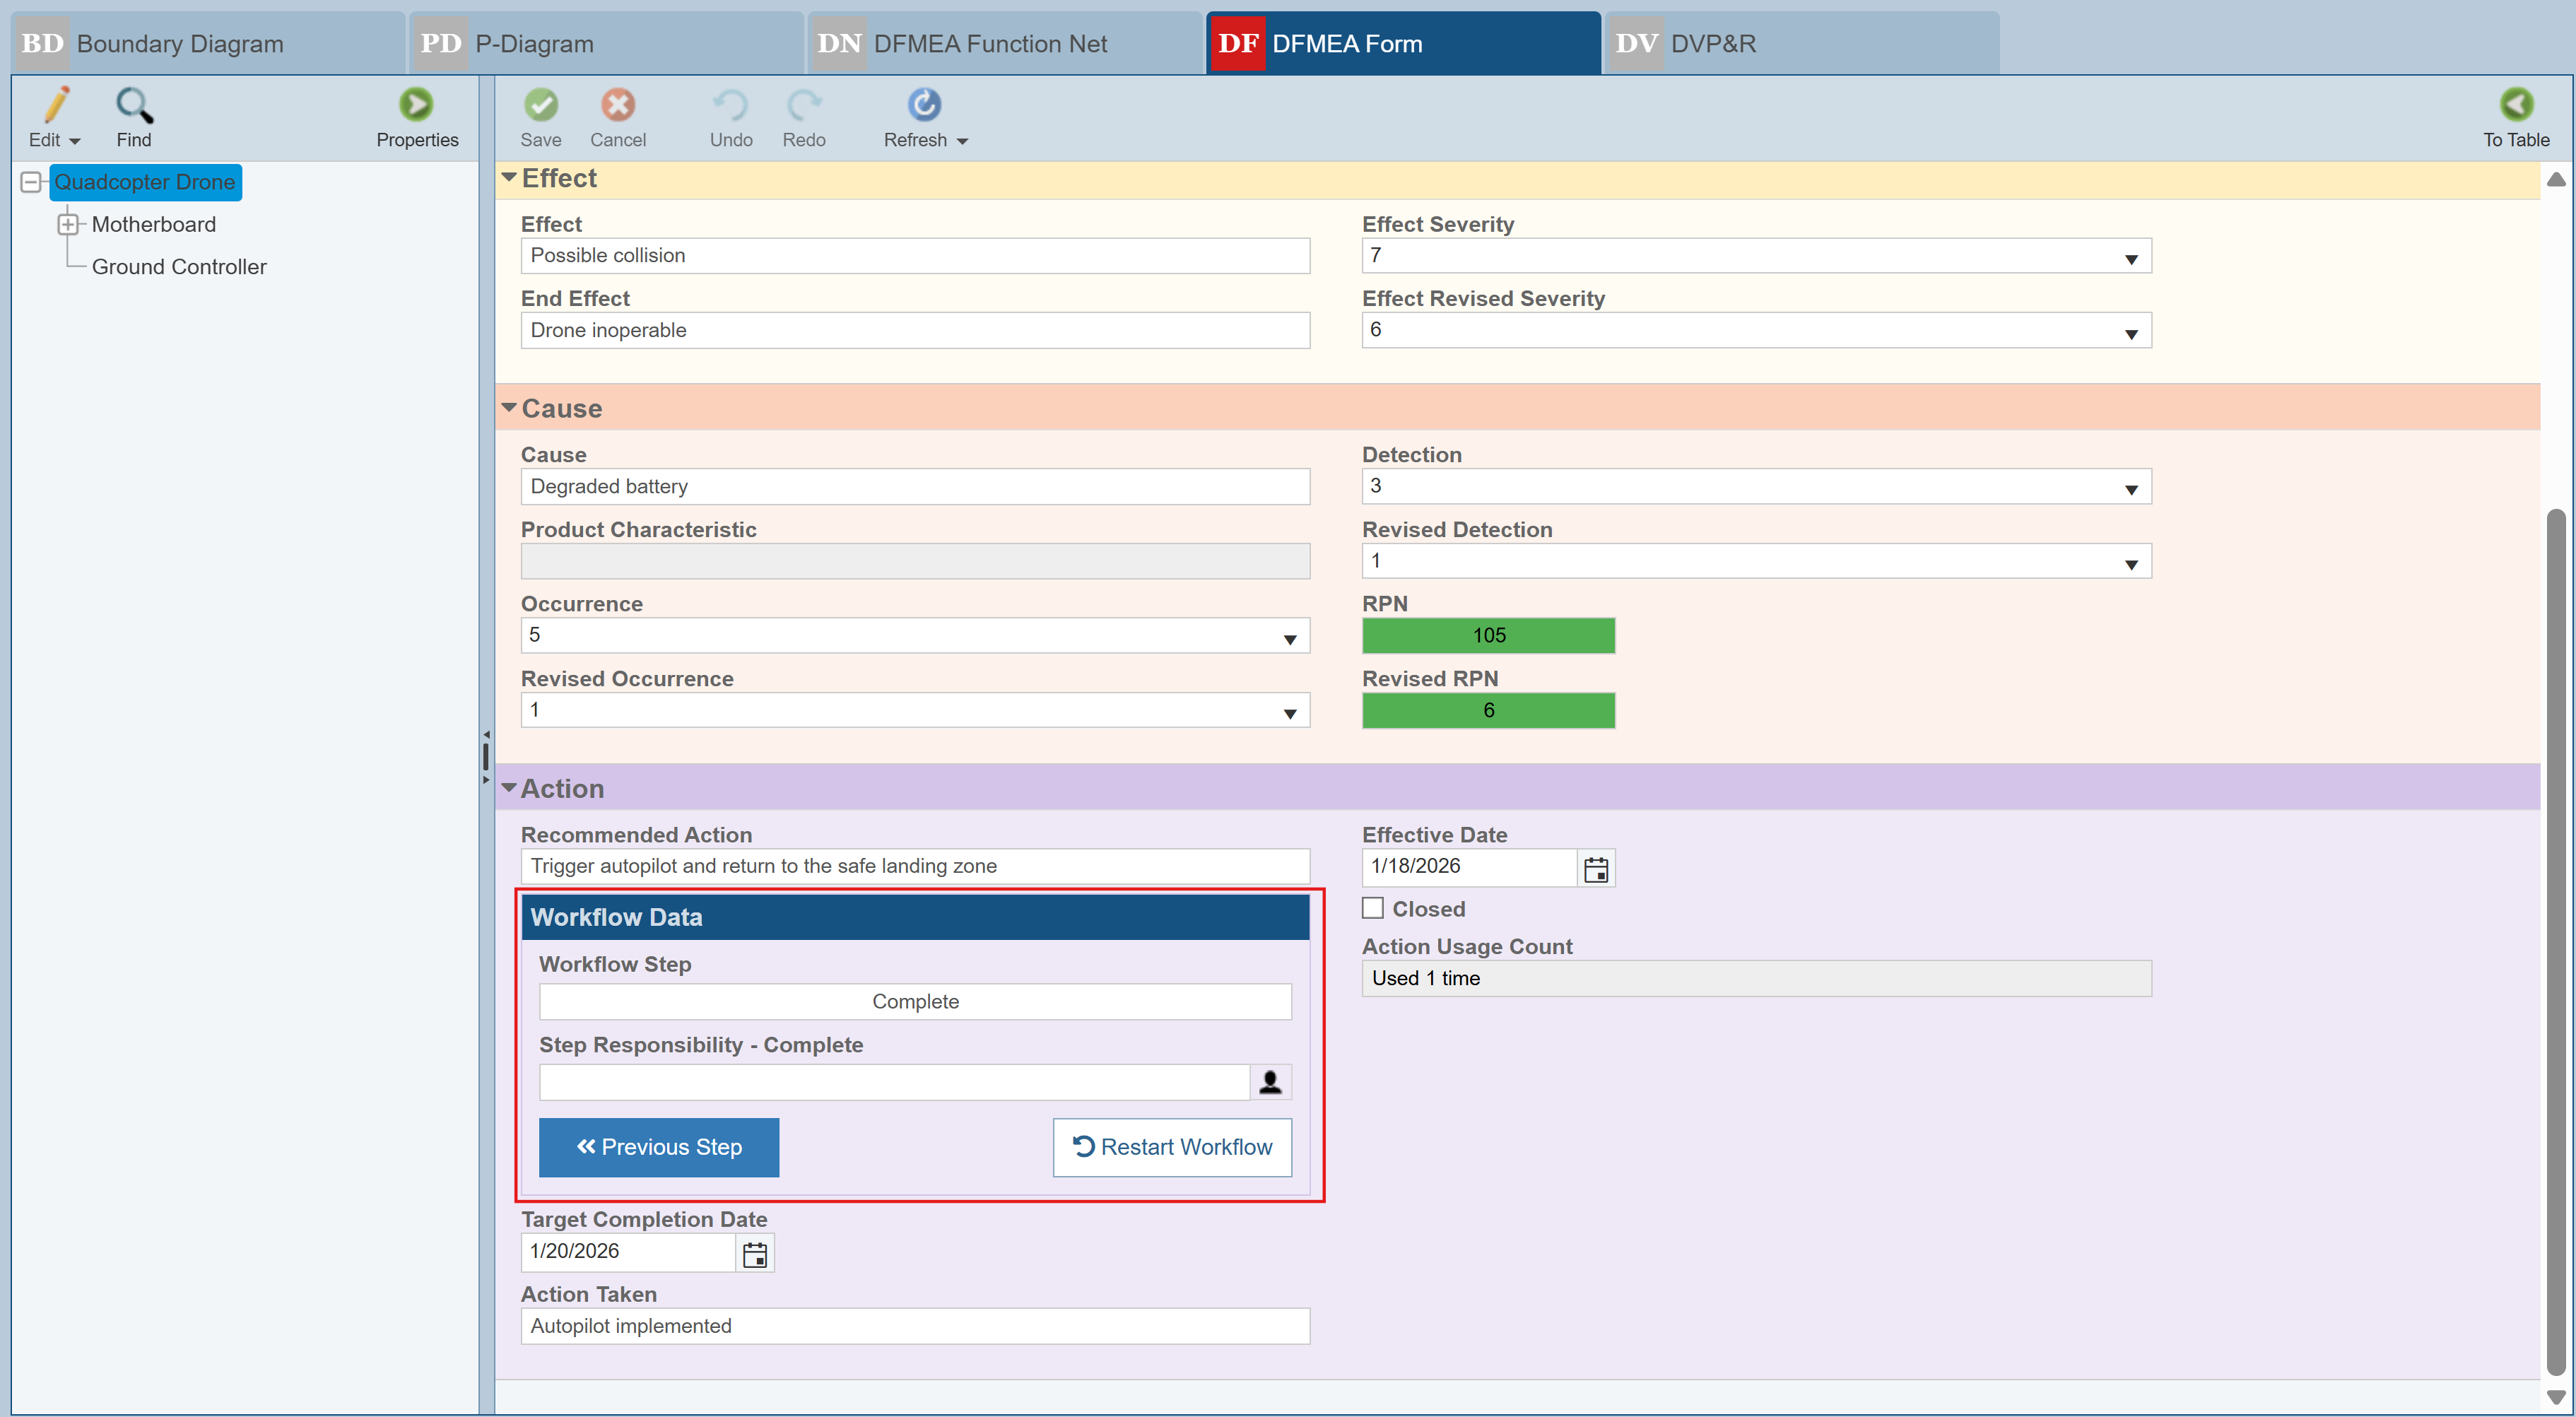
In the FMEA toolbar, the Design FMEA button indicates the current FMEA View that is active. You can have any number of Worksheet Views, and they can be customized to your needs. See the Customizing the FMEA Worksheets topic for more information. Click Design FMEA to bring up the list of choices and select Action Workflow.
The FMEA Worksheet will update to display more columns of data. Scroll horizontally across the FMEA Worksheet to view the additional data in the Worksheet. There are several notable data fields included in this more detailed FMEA Worksheet.
Change the Analysis Tree selection from Quadcopter Drone to Ground Controller.
Notice the Recommended Action and the Action Usage Count columns.
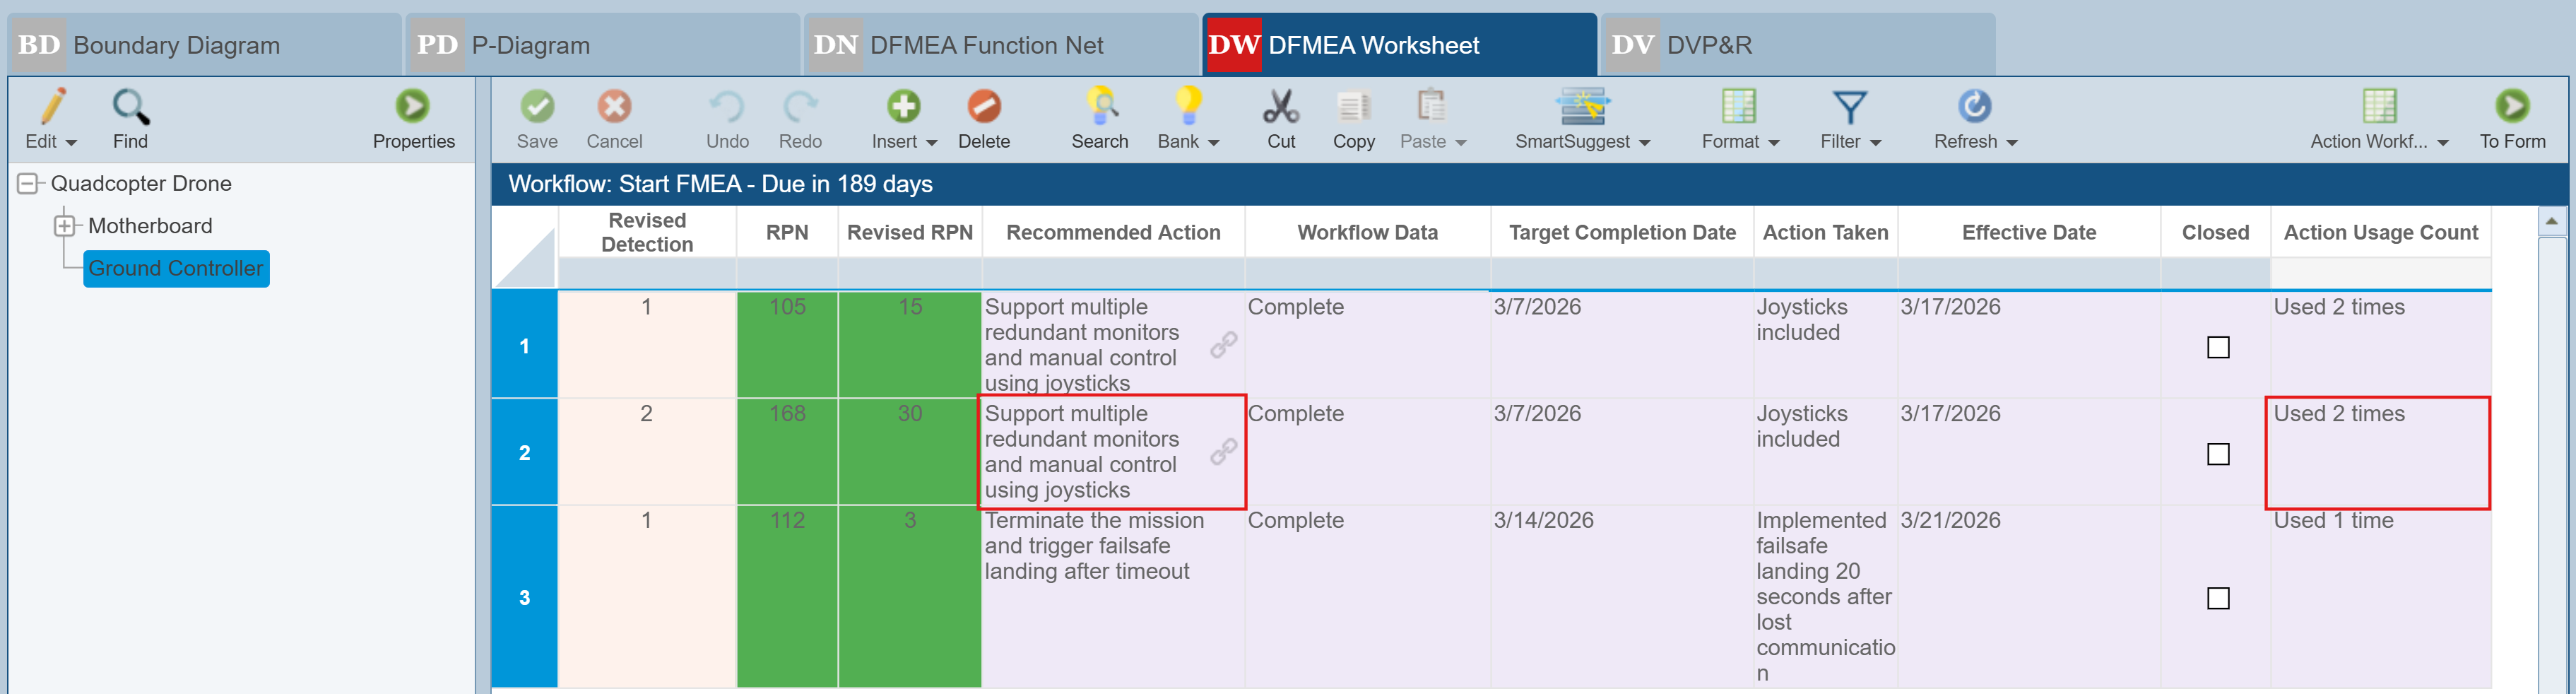
The Relyence Action Library stores all your Recommended Actions in a central location for reuse and updating efficiency. The link symbol in the Recommended Action field indicates that an Action is used in multiple places, and the Action Usage Count indicates how often it appears. For Actions which are shared, an update to one automatically updates all. For more details, see the Using the FMEA Action Library topic.
Change the Analysis Tree selection from Ground Controller back to Quadcopter Drone.
Notice the Workflow Data column.
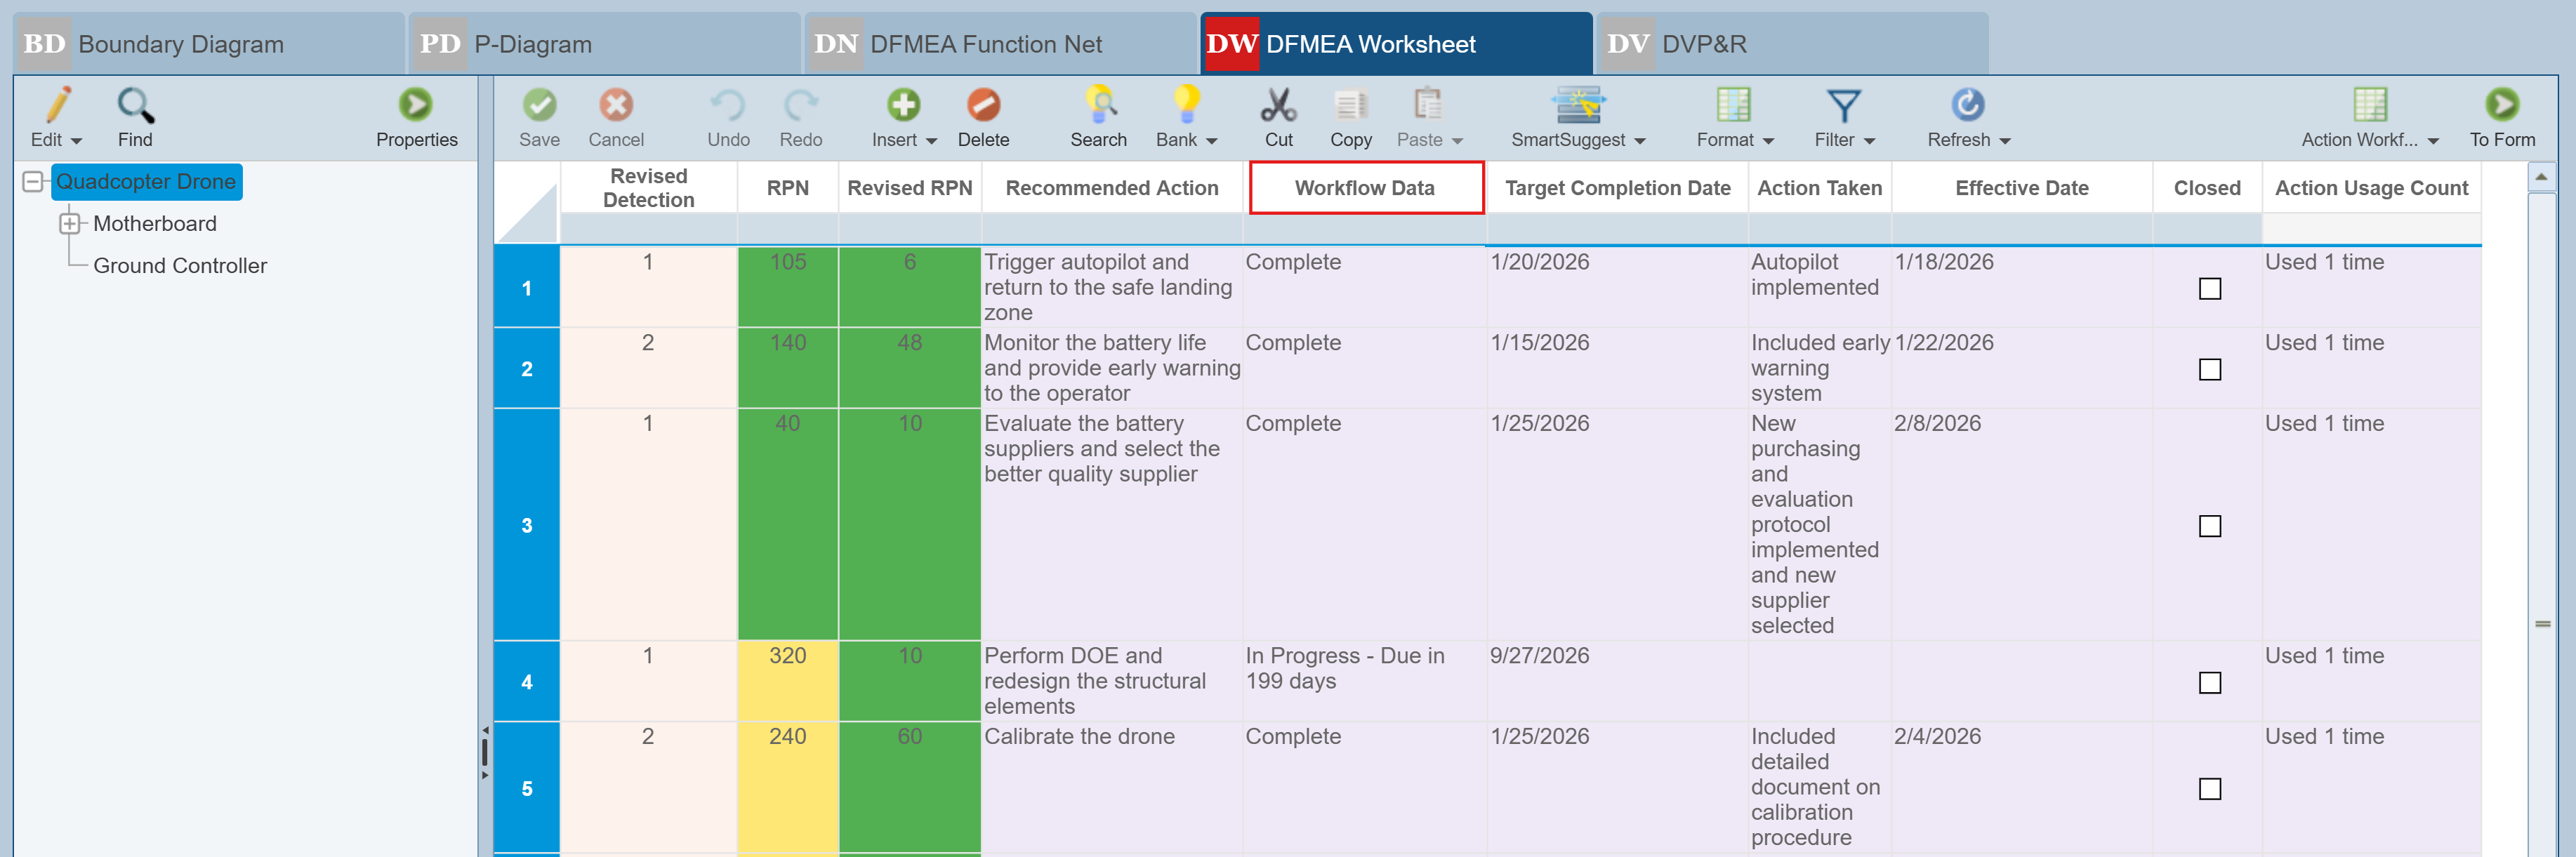
Relyence FMEA optionally can incorporate a FMEA Workflow process, including Approvals and Notifications. This enables you to control your FMEA process, keep your team informed of assignments, and track progress. The FMEA Workflow, Approvals, and Notifications are all completely customizable. The Example Drone Analysis contains a simple Workflow sample. To view the details about the Workflow, click on the Workflow Data control.
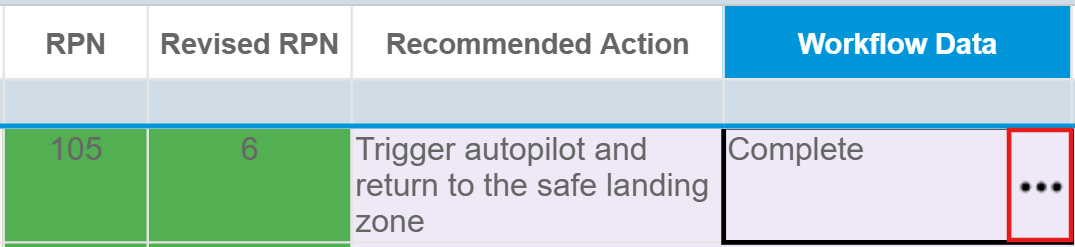
The Workflow dialog appears.
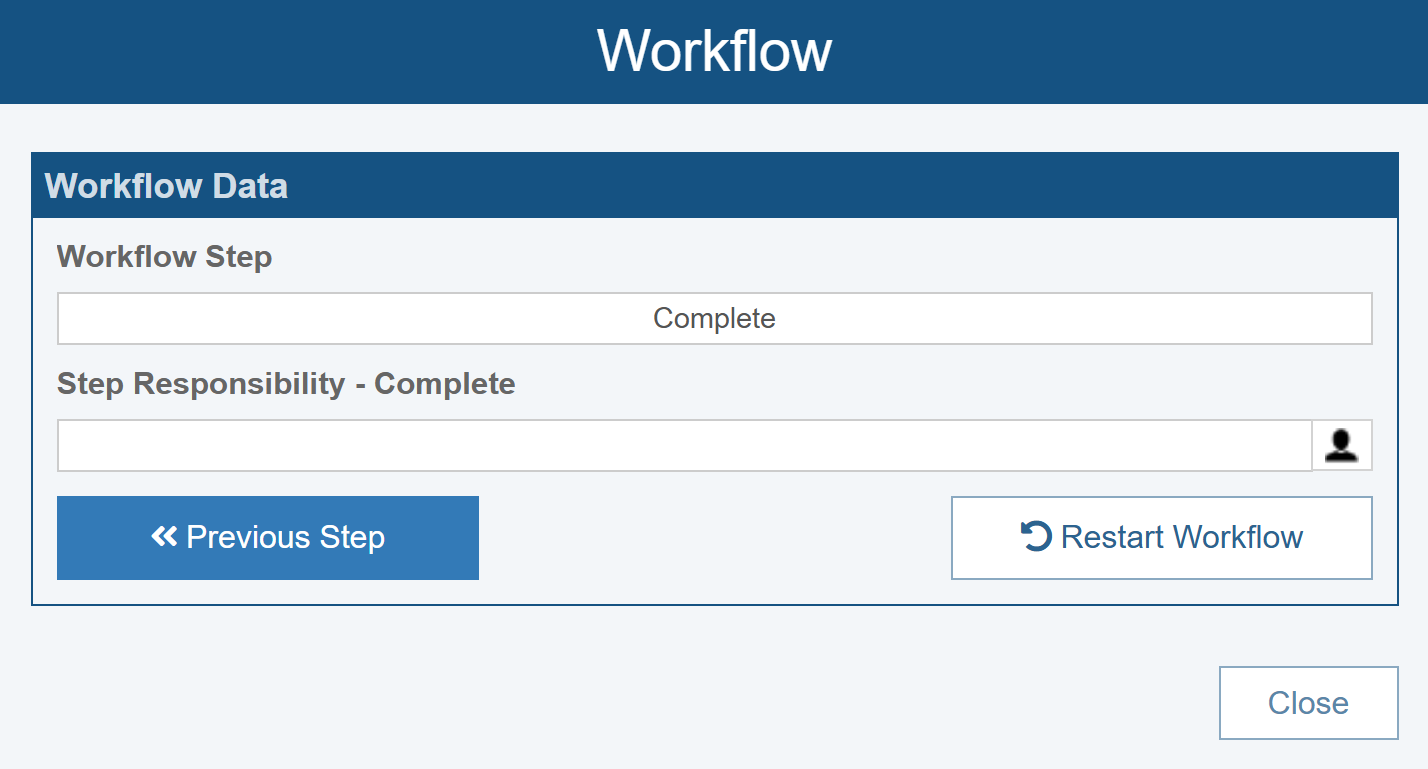
If Approvals are in use, the Approve and Reject buttons will also appear on the Workflow dialog. Any changes made in this dialog will be reflected in the FMEA Worksheet. Click Close to close the Workflow dialog.
The Workflow data is also shown in expanded view on the FMEA forms accessed by clicking the To Form button in the top right corner of the DFMEA Worksheet.
For more details on customizing the FMEA Action Workflow, and using this set of features, see the FMEA Action Workflow and Approvals and FMEA Action Notifications topics.
7. Moving On
Congratulations! You have successfully completed the Relyence FMEA Getting Started tutorial! You are ready to move on!
You are welcome to continue using the Drone Example to try out some other features and functions or start with a new Analysis. To create a new Analysis, click on Drone Example on the Sidebar menu, and then click Create New... on the submenu, or select Welcome to Relyence from the Help dropdown menu and click Create New Analysis. Remember that you can also click Revert Example to start over with an original Example.
You can use the Analysis Diagram feature of Relyence FMEA to visually depict your product or system. The Analysis Tree pane toggles between the Analysis Tree view and the Analysis Diagram view using the Edit>Show Diagram and Edit>Show Tree commands on the Analysis Tree pane toolbar. For an overview of using the Analysis Diagram, go to Getting Started with Relyence Analysis Diagram.
You can also explore the Process FMEA included in the Drone Example. For more information on using the Process FMEA features of Relyence PFMEA, go to Relyence Process FMEA (PFMEA).
Please note that there are limitations in the Trial version in the amount of data that can be entered. You will be notified when you have reached these limits.
There are additional features not covered in the Getting Started tutorial, such as more information on different FMEA types, customizing your Worksheet, using FMEA Knowledge Banks, using Failure Direct Connect, FMEA Data Autoflow, using FMEA SmartSuggest and more. For more information on these features, go to Relyence FMEA Advanced Features.