ALT PLOTS
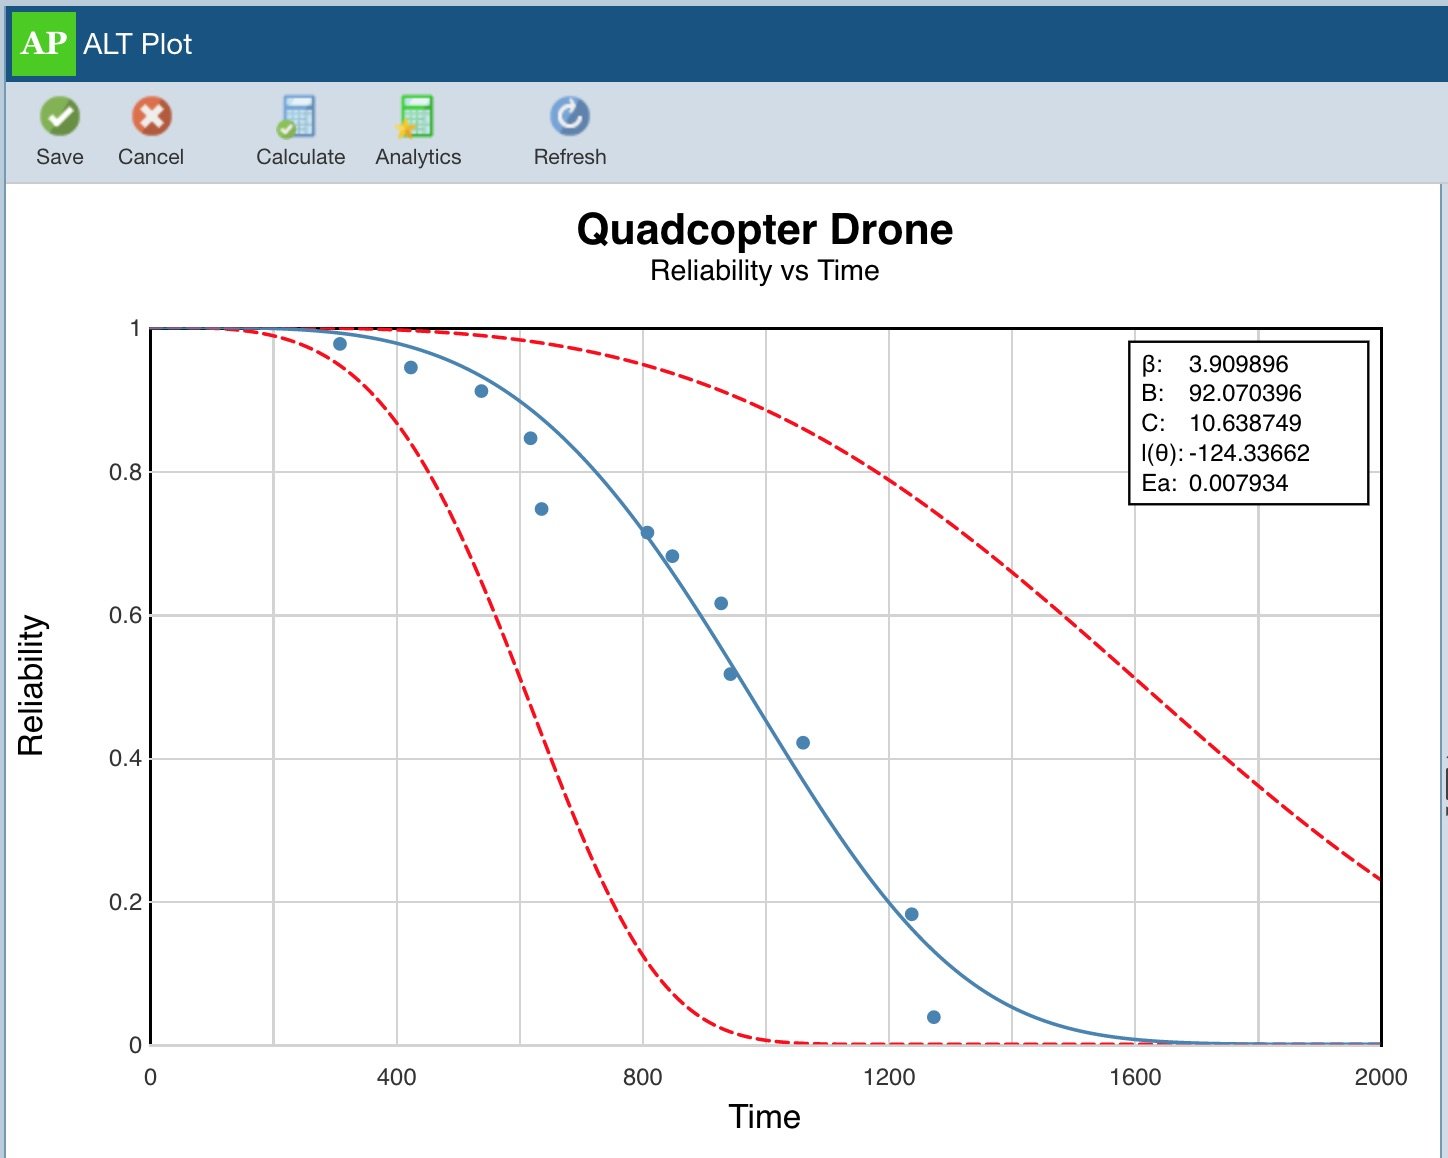
A central component of ALT analysis is the generation of ALT plots. Relyence ALT offers visually impactful plotting capabilities. You can select from a variety of plot types, and include confidence bounds if you prefer. You can customize the plots to suit your needs and generate output reports in a variety of formats.
Plot Types
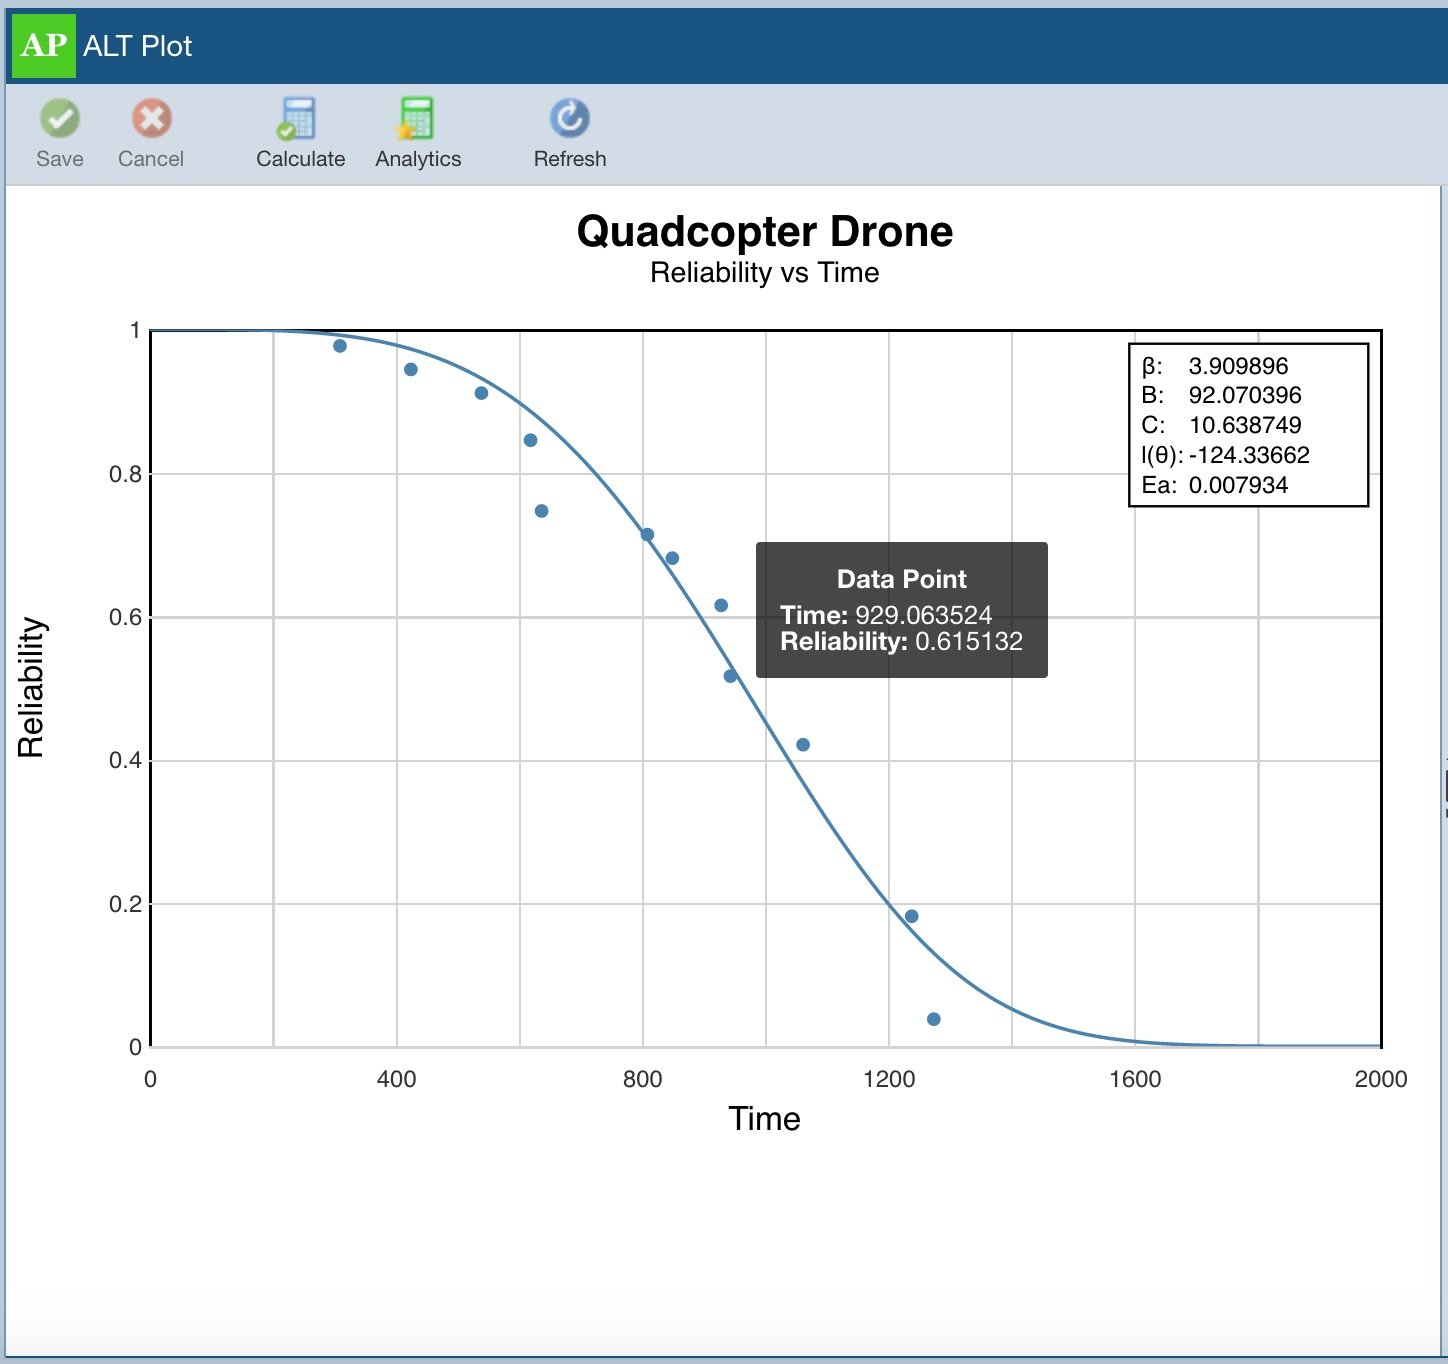
Relyence ALT supports several plot types including: Acceleration Factor vs Stress, Failure Rate vs Time, PDF (Probability Density Function) Plot, Probability, Reliability vs Time, Standard Deviation vs Stress, and Unreliability vs Time. Relyence ALT automatically sizes and scales plots for optimal viewing. However, if you prefer, you can manually scale the plot to your preferences. The ALT plots generated with Relyence ALT are uniquely visually striking and allow you to easily assess trends and capture failure characteristics.
Once generated, your data point and distribution curve will display on your ALT Plot. Use the handy hover feature to highlight any point on your plot and view its information.
Confidence Bounds
As in any statistical analysis, confidence bounds may be useful when evaluating your data analysis. Confidence intervals are an assessment that indicates how certain you can be regarding the results of your analysis. Confidence is based on a particular confidence level, or numerical probability. For example, a 90% confidence level represents a range that you can be 90% certain contains the mean of your data set. Relyence ALT enables you to add Confidence Bounds to your ALT plots. You can select to display Lower, Upper, Double, or Upper and Lower confidence bounds. You can choose the Confidence Level you wish to use for the confidence bounds lines. Lastly, you can select the Confidence Bound Type: Reliability or Time.
Customizing
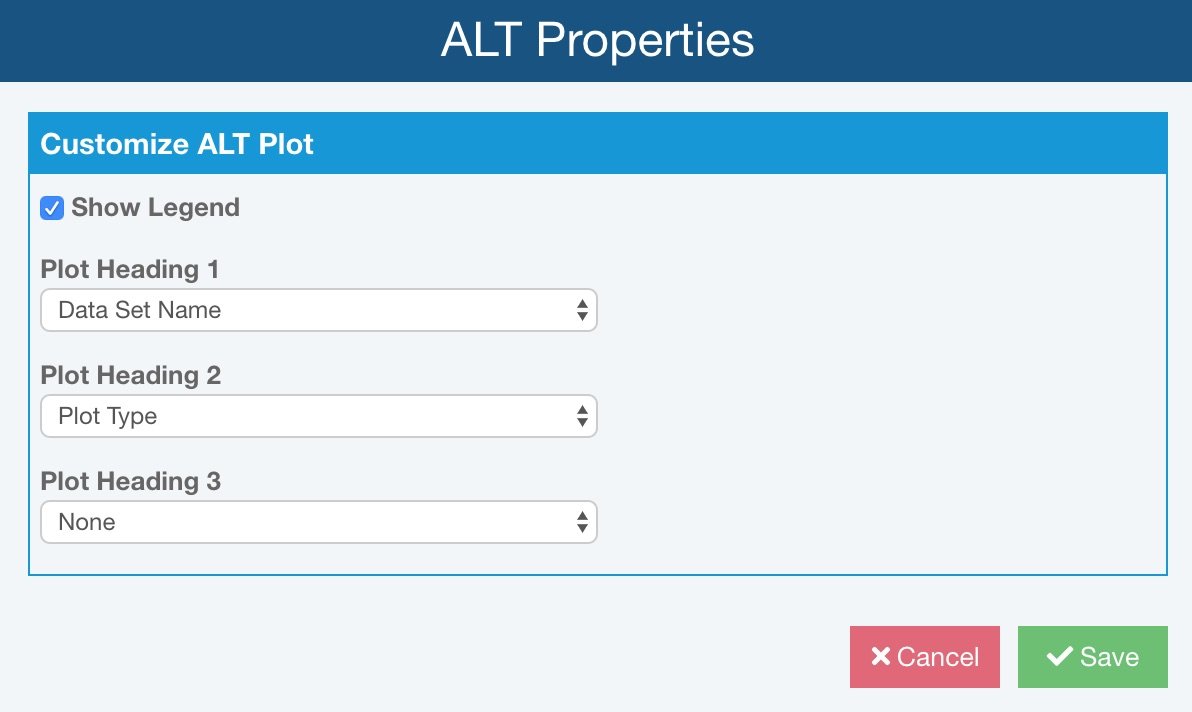
Your Relyence ALT plots can be customized. First, you can choose whether to display a results legend on your plot. The results legend includes the distribution result parameters. You can also include up to 3 headings on your plots – a plot title (Heading 1), a plot subtitle (Heading 2), and a secondary subtitle (Heading 3). You can choose what information appears in each heading: Plot Type, Data Set Name, or Distribution. You can change your selections at any time and regenerate the plot to immediately see your new selections.
Reports
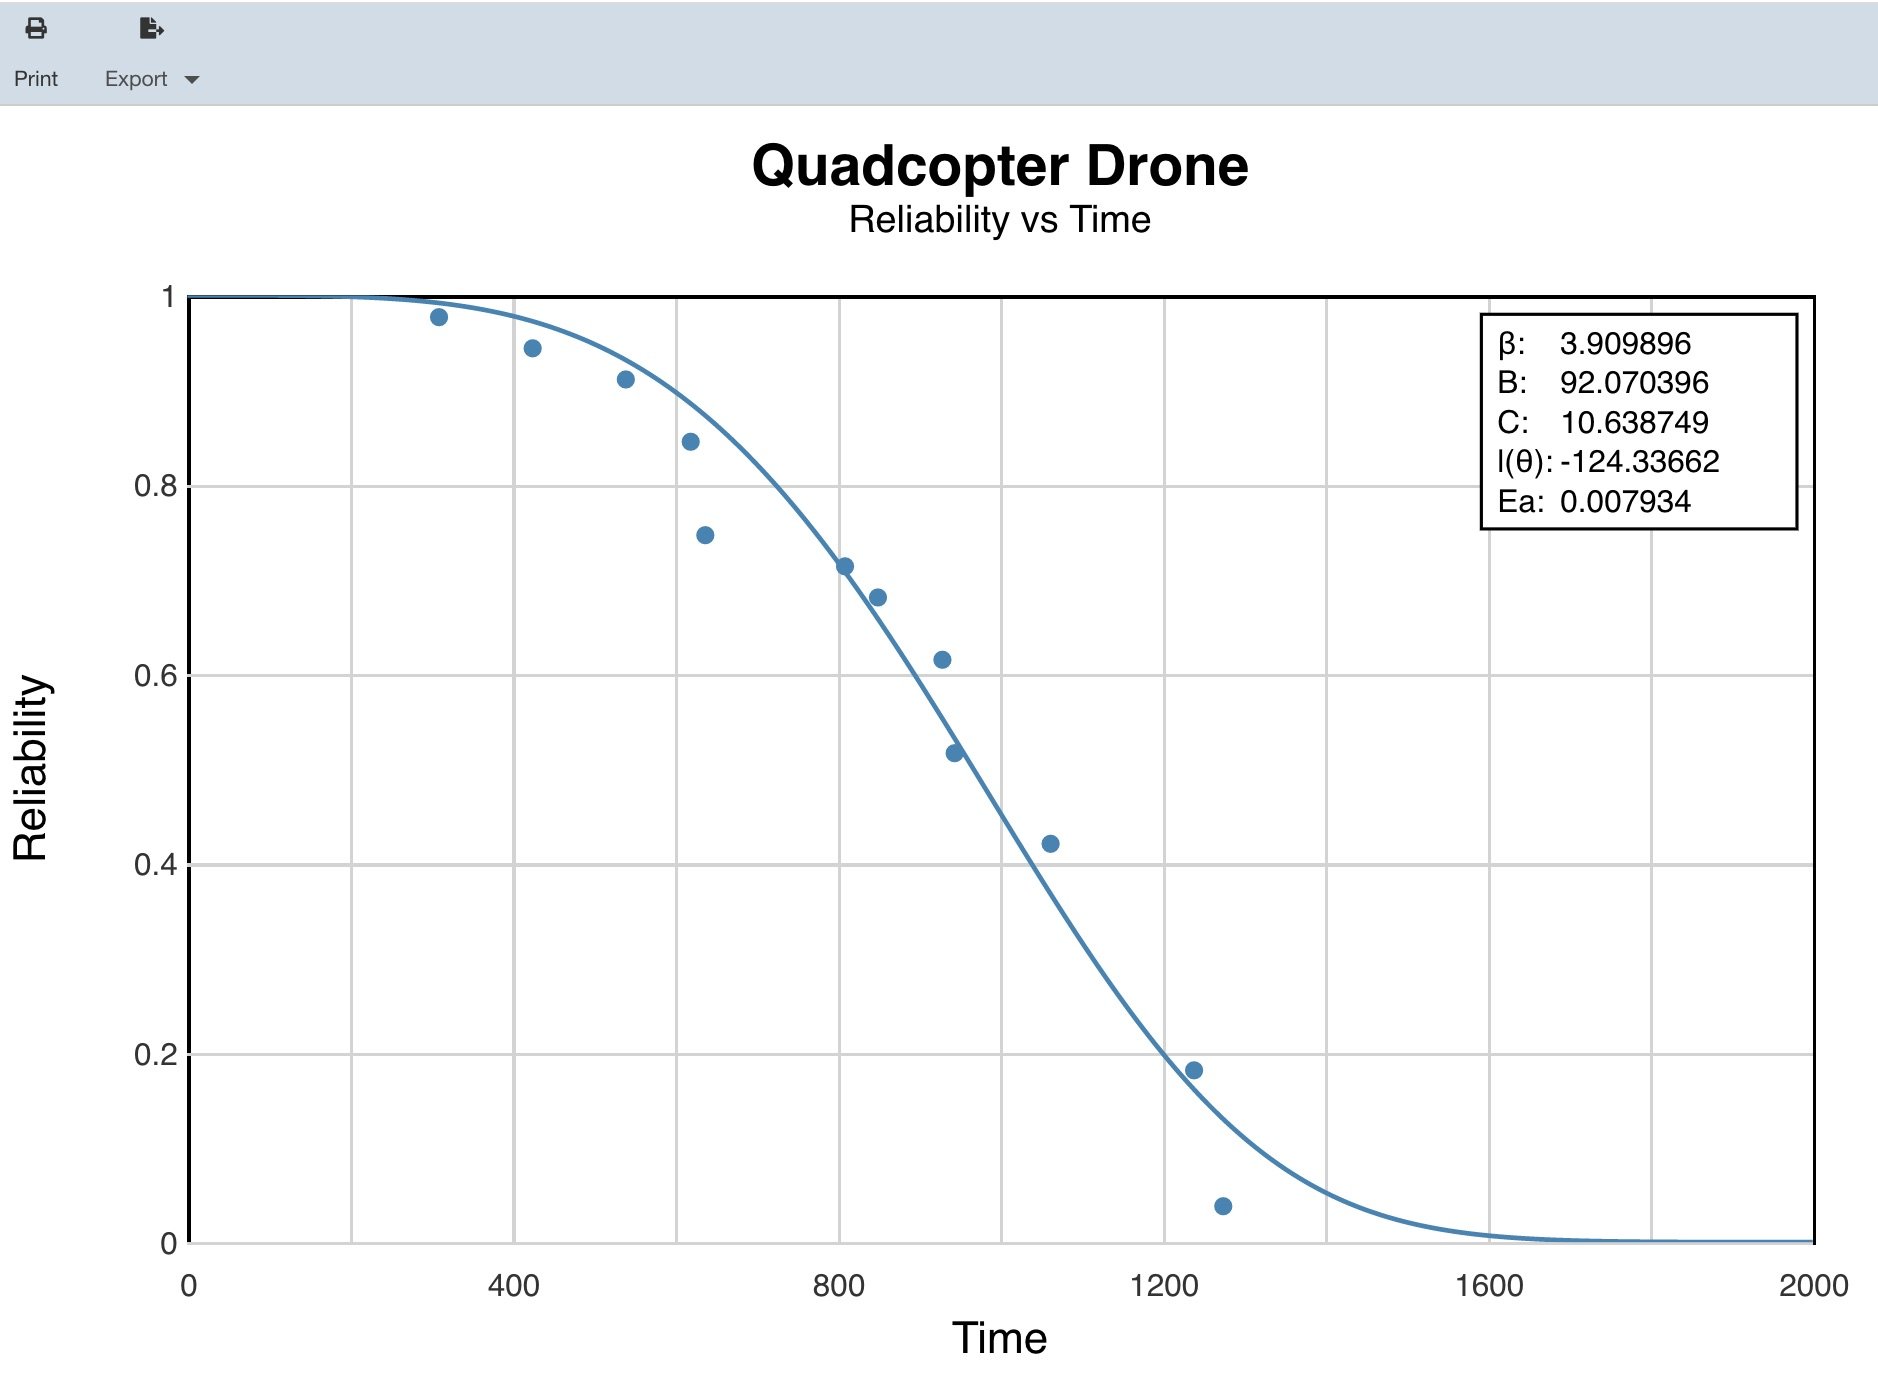
Once your ALT plot has been customized and generated as you prefer, you may want to generate a report to capture your plot for presentations, papers, or for team sharing. Output reports of your Relyence ALT plots are available for printing, inclusion in other reports or PowerPoint presentations, or for any other purpose. You can print, or save the output to various formats including JPG, BMP, PNG, or SVG.


