ENHANCED ANALYSES
Relyence Reliability Prediction builds on the core capabilities that support reliability prediction analysis with a comprehensive feature set that takes your analyses to the next level. With Relyence Reliability Prediction, you can extend your failure rate analyses by utilizing the hierarchical Analysis Tree, employing Knowledge BanksTM for data reuse, performing derating analysis, evaluating allocation computations, calculating mission profile assessments, defining custom Formulas, adjusting failure rates based on known conditions, incorporating dormancy factors, using graphical system diagramming, and also setting the stage for complex modeling using Relyence RBD.
Hierarchical Analysis Trees
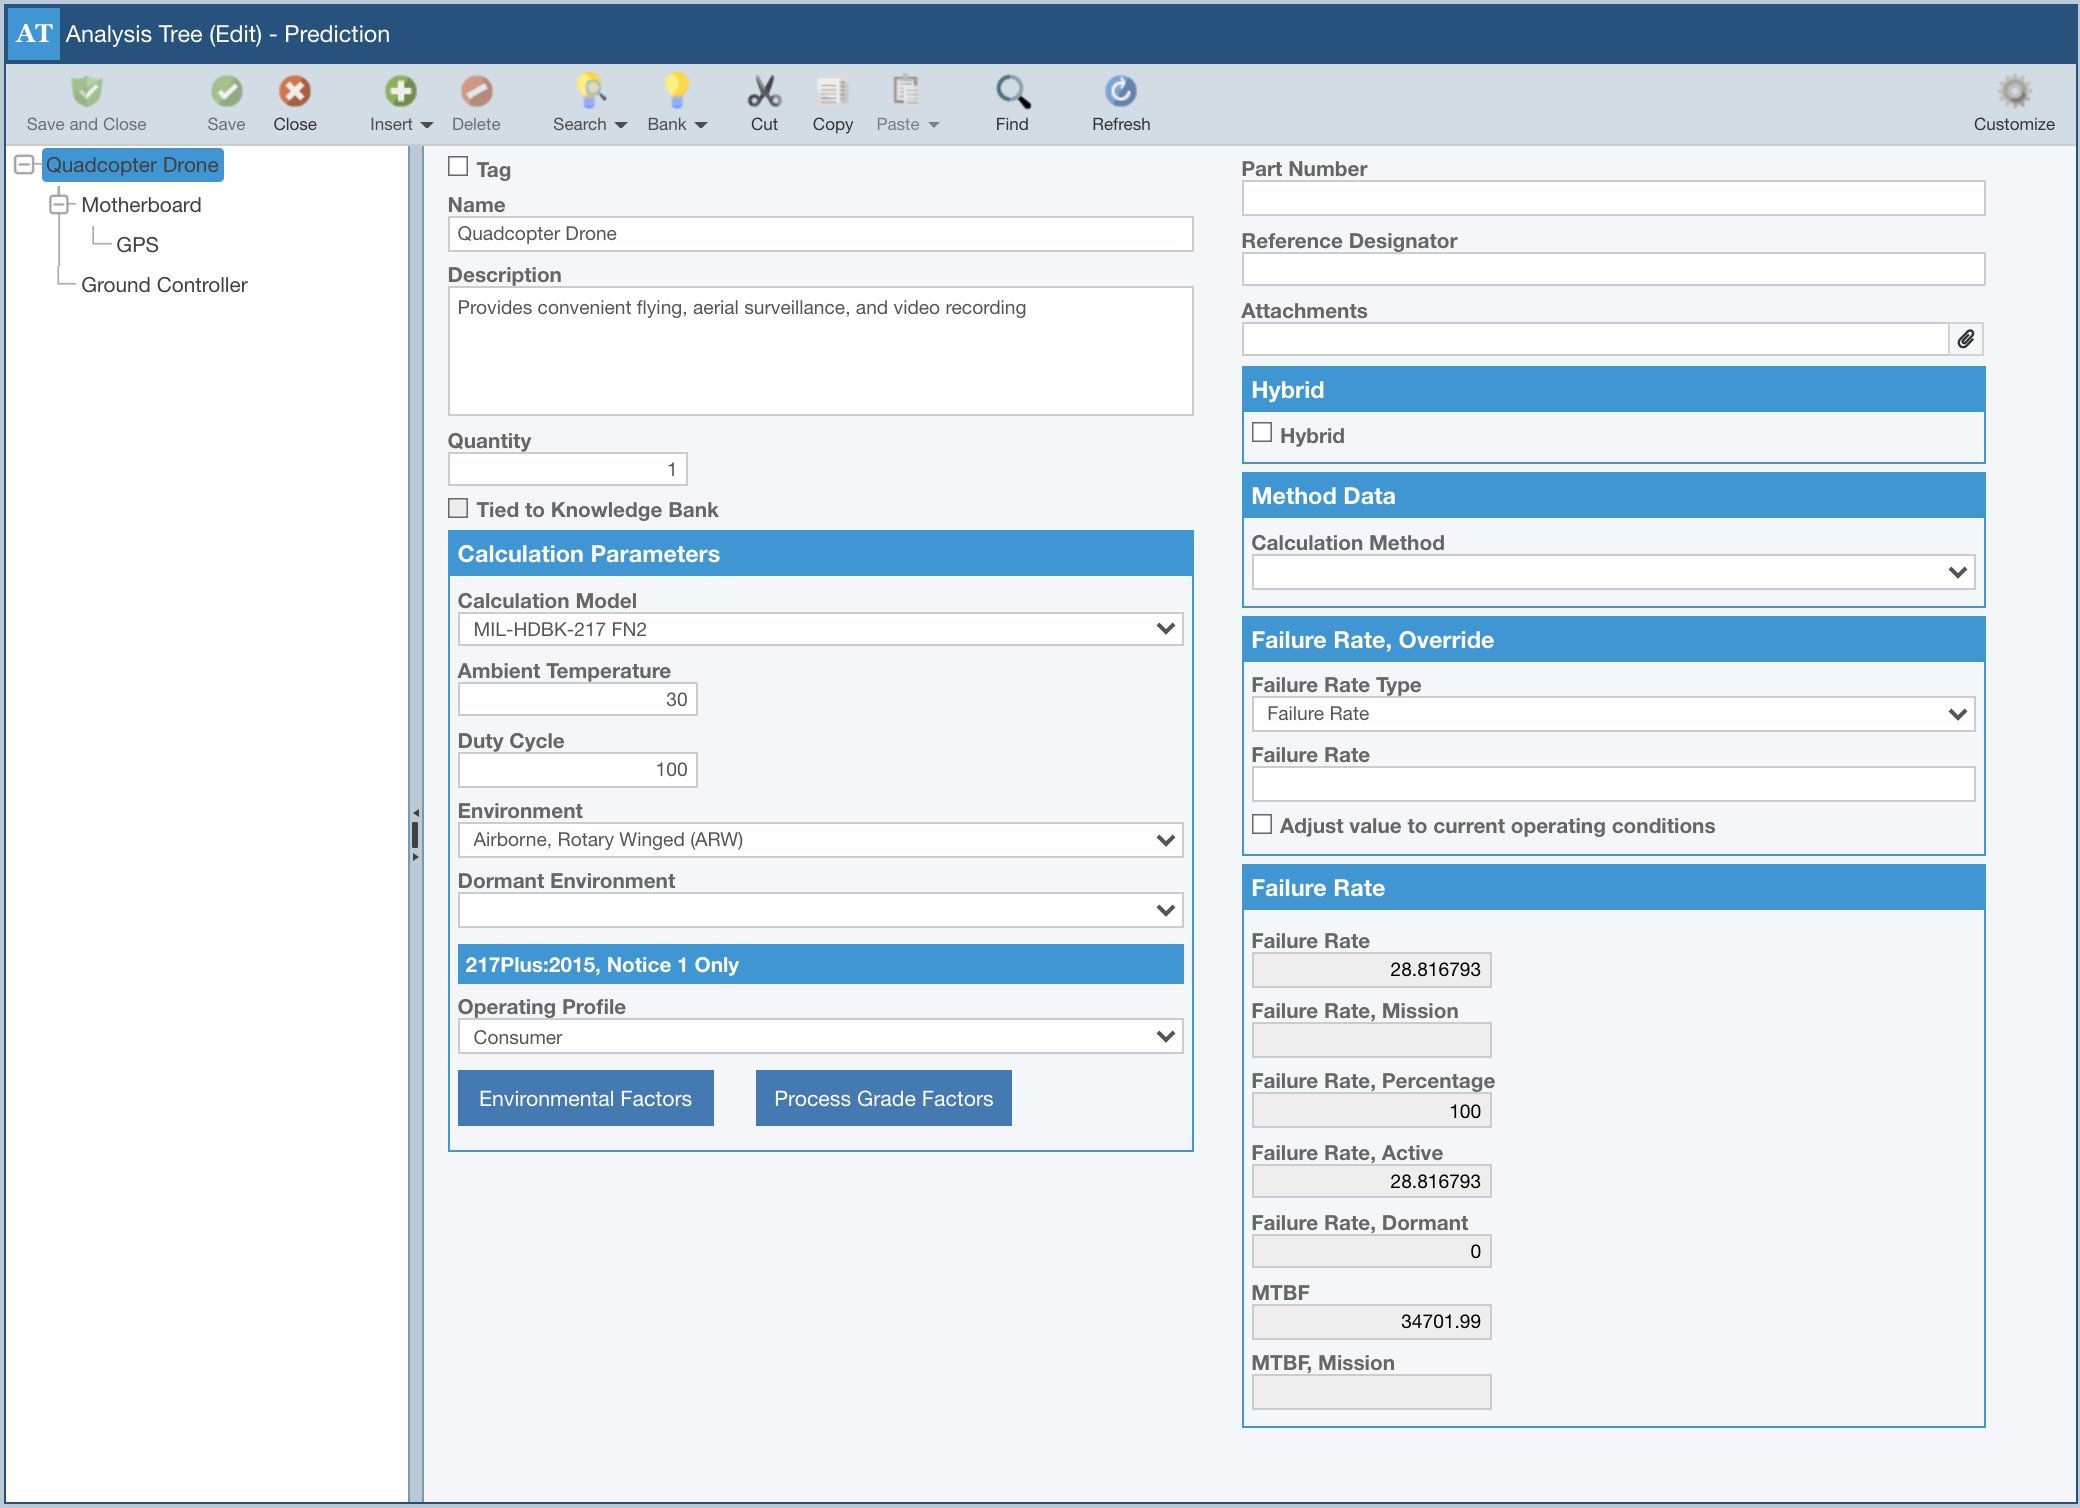
Using Relyence Reliability Prediction’s intuitive interface, you create a hierarchical depiction of your system or product using the Relyence Analysis Tree. This tree can be as high-level or as detailed as you would like. You can begin your MTBF reliability prediction analysis one unit at a time and build up your tree as your design matures. For new or next generation products or systems, you can quickly and easily reconfigure your tree, or construct new trees based on original designs. Additionally, you can view your tree in the commonly used hierarchical manner, or as a visual block diagram.
Data Reusability with Knowledge BanksTM
The unique-to-Relyence Knowledge Bank capability enables you to expertly manage reusable components in your reliability prediction analyses.
For example, you may have a subassembly used across multiple product lines. Or, you may use subassemblies from prior designs in next generation designs. The Relyence Knowledge Bank enables you to efficiently handle these scenarios.
Using the Knowledge Bank in Reliability Prediction for the management and control of reusable components is a simple process:
- Add the subassembly to the Knowledge Bank.
- Reference the stored subassembly in all Analyses where it is used.
- Keep changes made to the subassembly in sync across all Analyses by using the Knowledge Bank Push feature.
Leveraging the powerful Knowledge Bank feature enables you to efficiently manage your analysis data and keep that data synchronized across analyses.
Derating Analysis
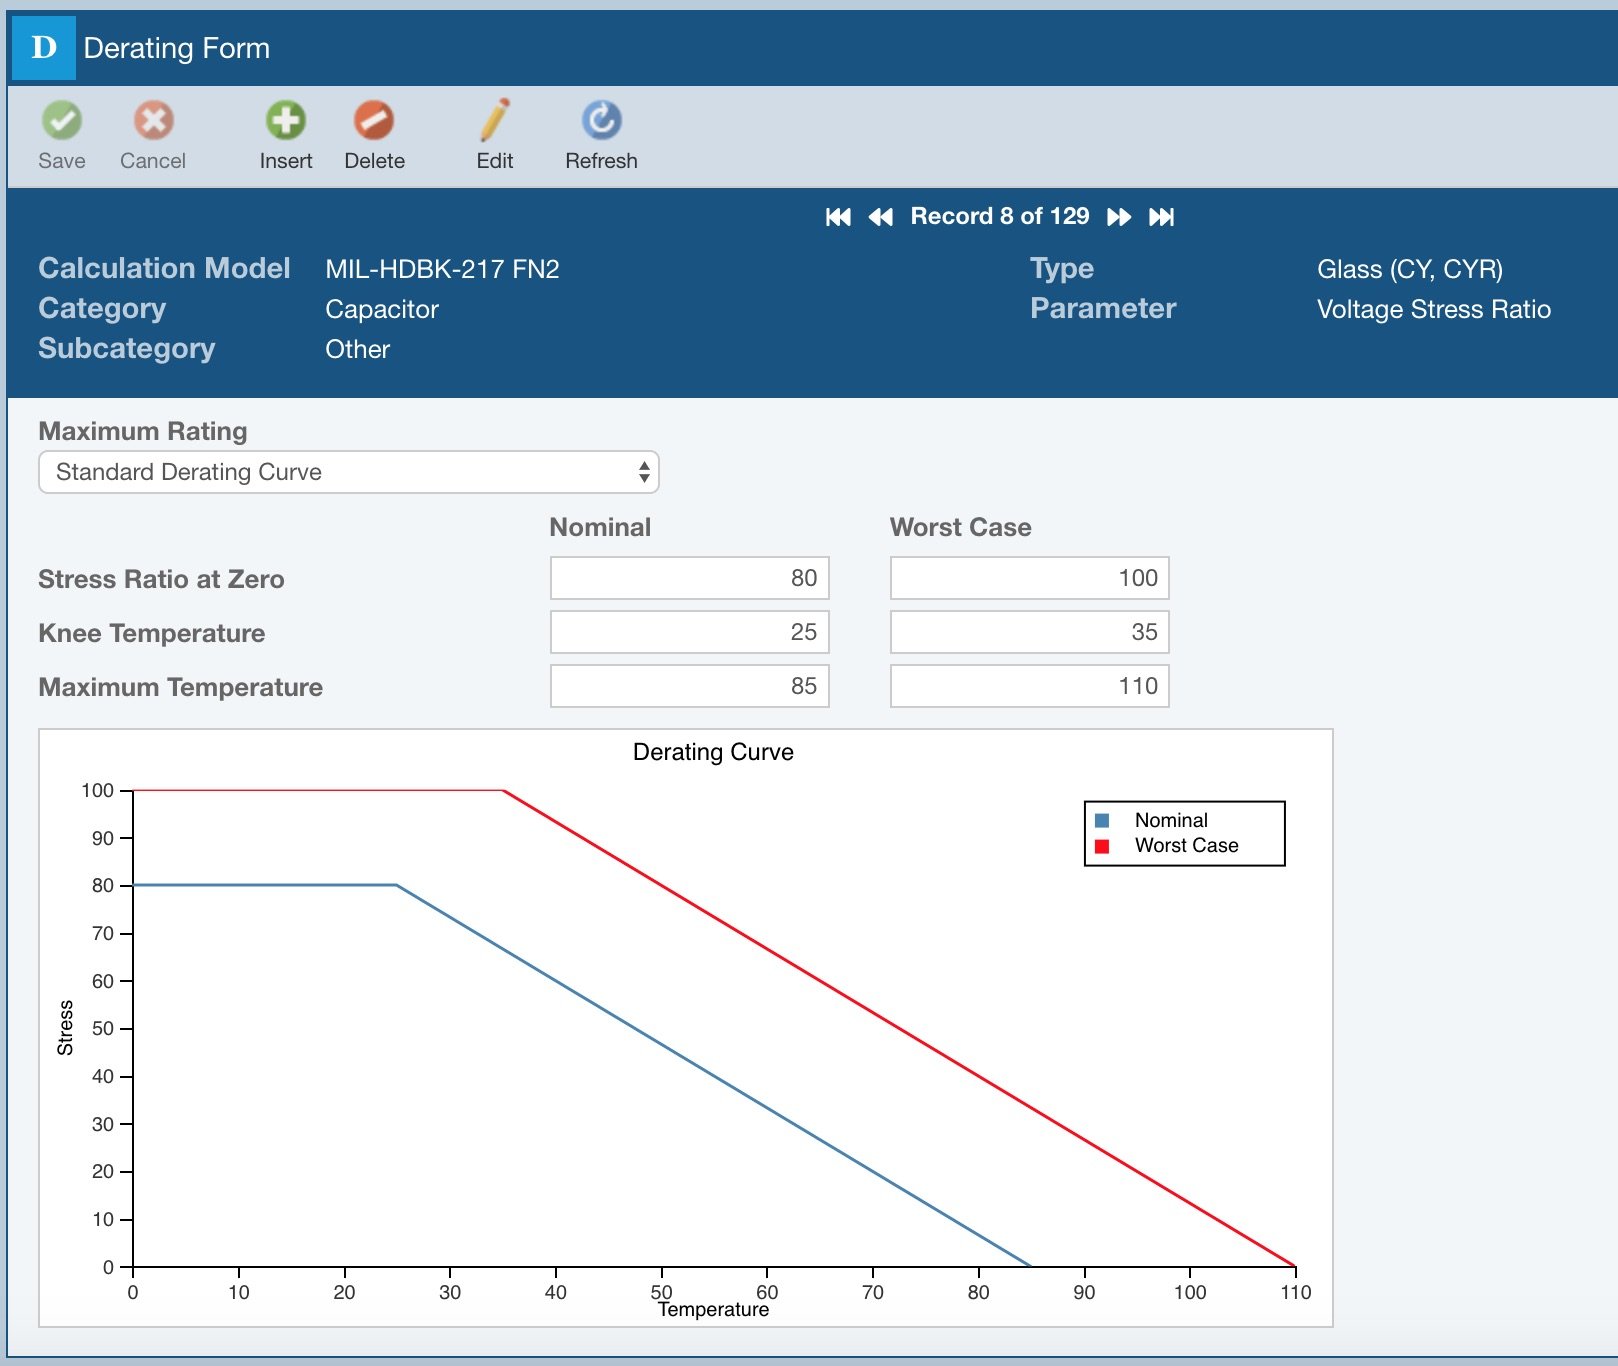
All electronic devices are subjected to various stresses, such as electrical (for example voltage or current), temperature, and environmental (for example vibration or shock). Component data sheets include information on maximum stress levels that a component should be subjected to in a design. Derating, or operating a component at less than its maximum stress, is employed in order to prolong a component’s life and, ultimately, maintain a high level of overall product reliability.
You can choose from one of the built-in derating standards, create a completely custom derating profile, or start with a supplied derating standard and modify it to suit your needs. Relyence Reliability Prediction supports the following commonly employed derating standards:
- MIL-STD-1547
- MIL-STD-975M
- TE000-AB-GTP-010
Allocation Analysis
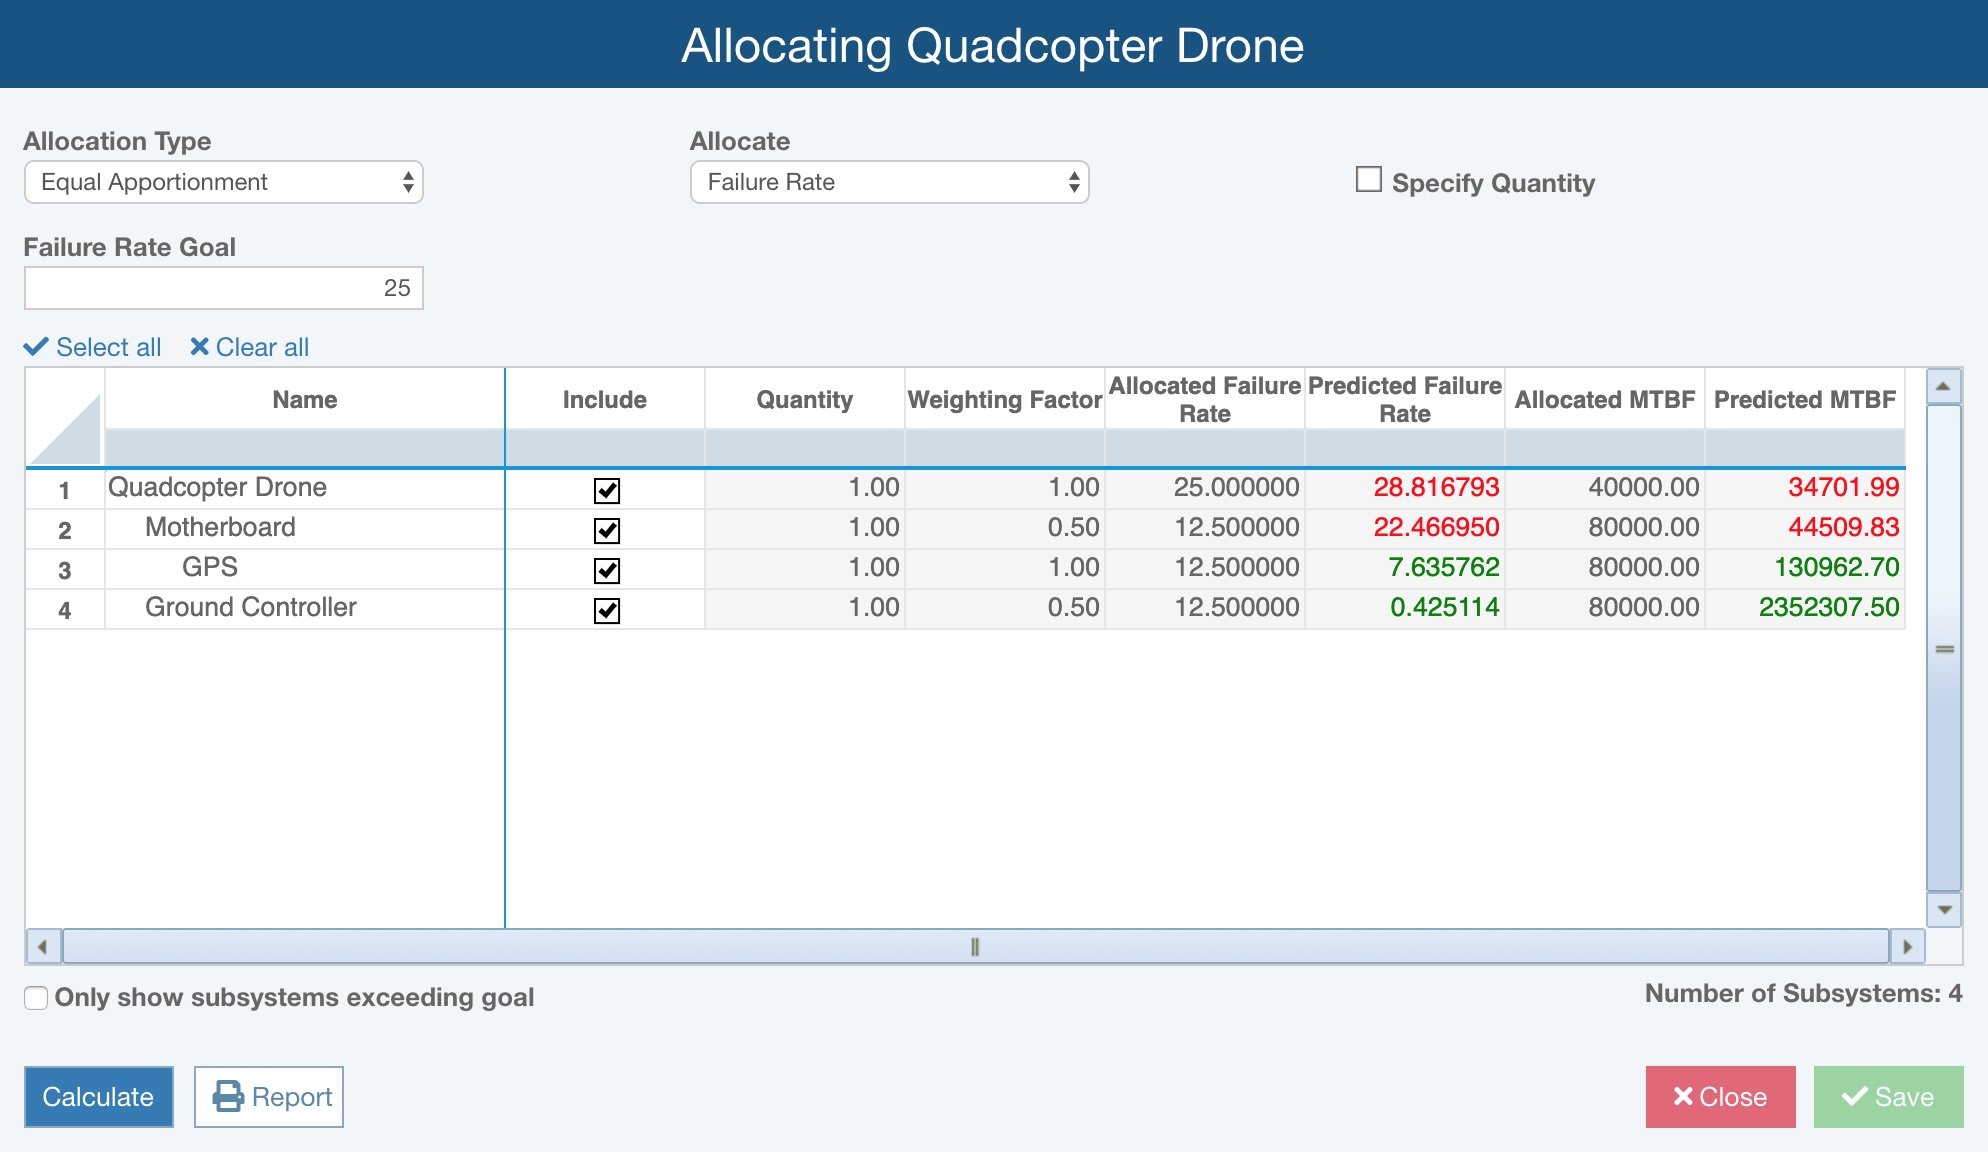
Reliability allocation is a process used to optimally distribute reliability goals across a system in order to meet an overall reliability objective. For example, system integrators may have a specific reliability goal either internally driven or contractually mandated. In this situation, it is important to effectively distribute that goal down to subcontractors and suppliers in a reasonable fashion. By establishing reliability goals for each subcontractor, or each subsystem, a system integrator can be assured that the overall objective will be achieved.
Relyence Reliability Prediction supports the following methods for allocation analysis:
- AGREE (Advisory Group on Reliability of Electronic Equipment)
- ARINC
- Equal Apportionment
- Feasibility of Objectives
- Repairable Systems
- Weighted
Mission Profiles
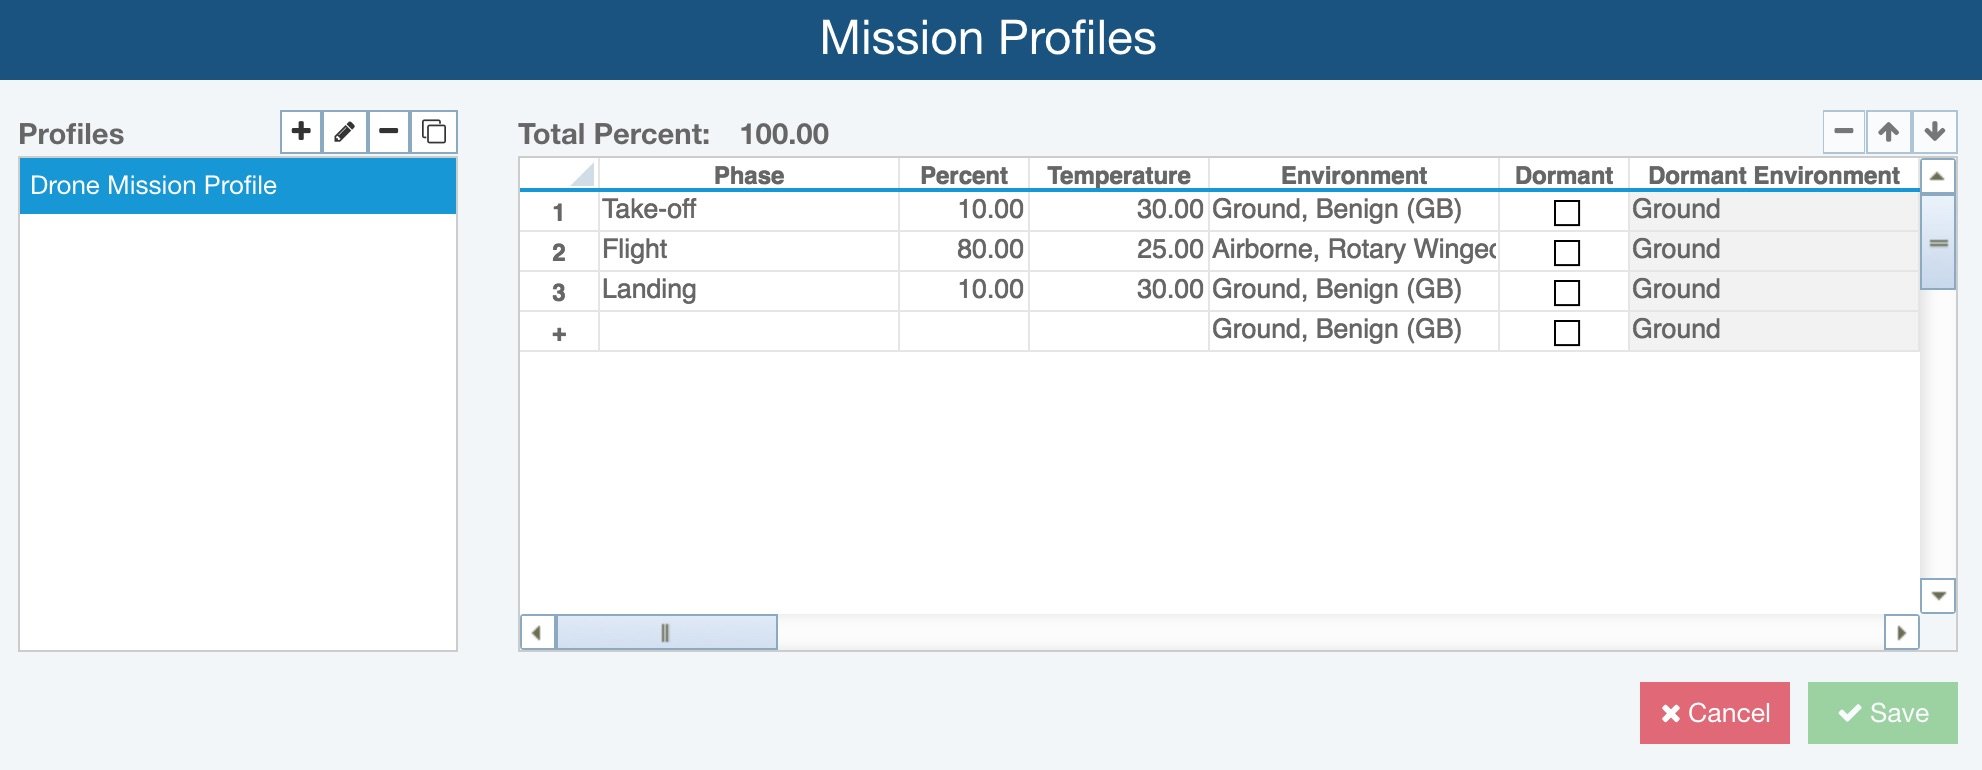
Relyence Reliability Prediction supports mission profile assessment. Using the Mission Profile Editor, describe the various phases of your mission, including the overall time in the phases, and the environment and temperatures of each phase. You can also choose to include dormant phases in your mission profiles if they are applicable. Once defined, mission profile calculations are performed using the Relyence Reliability Prediction calculation engine and results are available for reports or for inclusion in the Relyence Reliability Prediction Dashboard.
Formulas
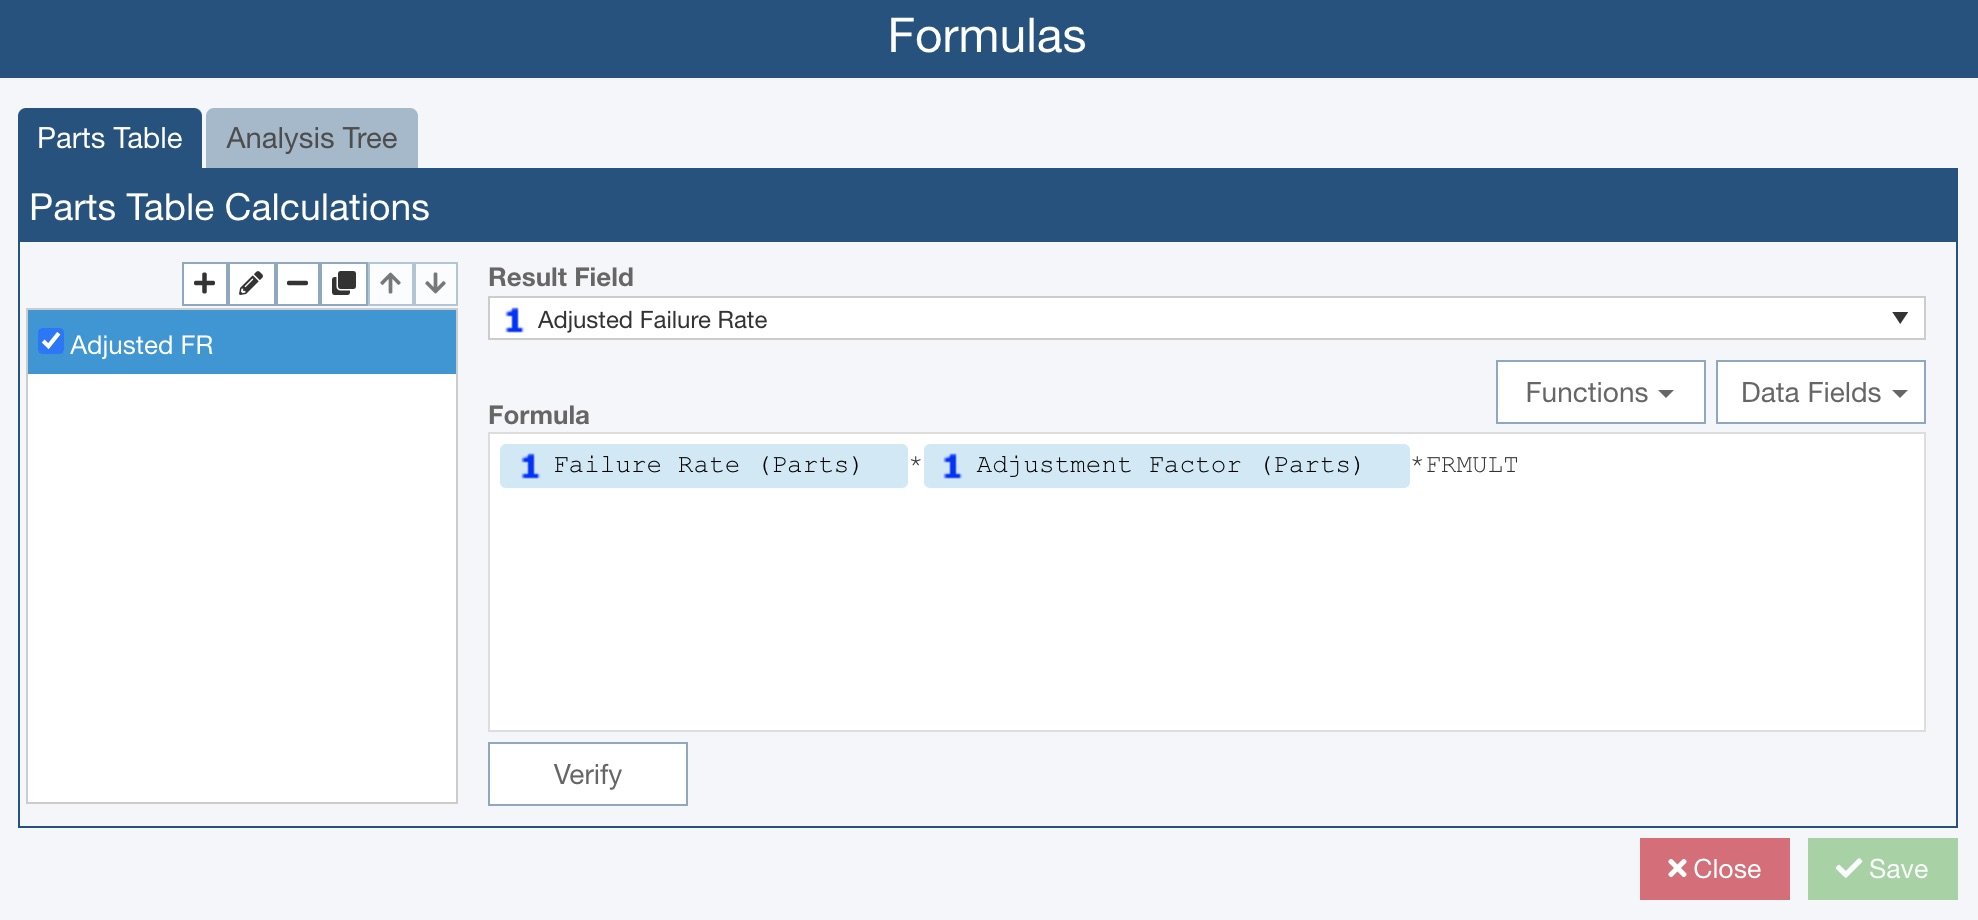
Relyence Reliability Prediction allows you to create your own customized Formulas for use in your MTBF analyses. You can use the custom Formula builder to define any number of custom computations. You can choose to activate and deactivate Formulas at any time, so you can decide when to perform your user defined calculations.
You can create both Parts-based Formulas (based on Part data), or Analysis Tree-based Formulas (based on Analysis Tree data).
A wide range of flexibility is available for creating complex Formulas, such as those including logical operators (AND, OR, <>, etc.), constants, dates, and programmatic functions (if/then/else).
Relyence Reliability Prediction Formulas also support Roll-up and Aggregate functions such as SUM and AVG for cumulative calculations.
Failure Rate Adjustment
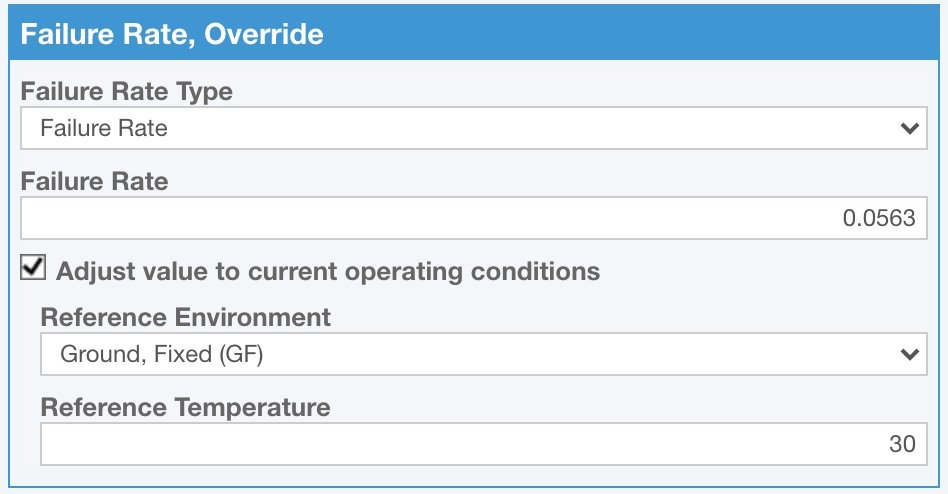
Relyence Reliability Prediction offers the ability to adjust failure rates computed based on a known environment and temperature to a different environment and temperature. The adjustment is based on a table of conversion factors defined in the Rome Laboratory Reliability Engineer’s Toolkit publication.
For example, you may know the failure rate of a component when in use in a Ground Fixed environment at 30° C. However, your current operating conditions are Ground Mobile at 35° C. Using the new Adjust Failure Rate capability, you can specify the failure rate and the reference environment and temperature and Relyence will automatically adjust it to the operating conditions.
Dormancy Factors
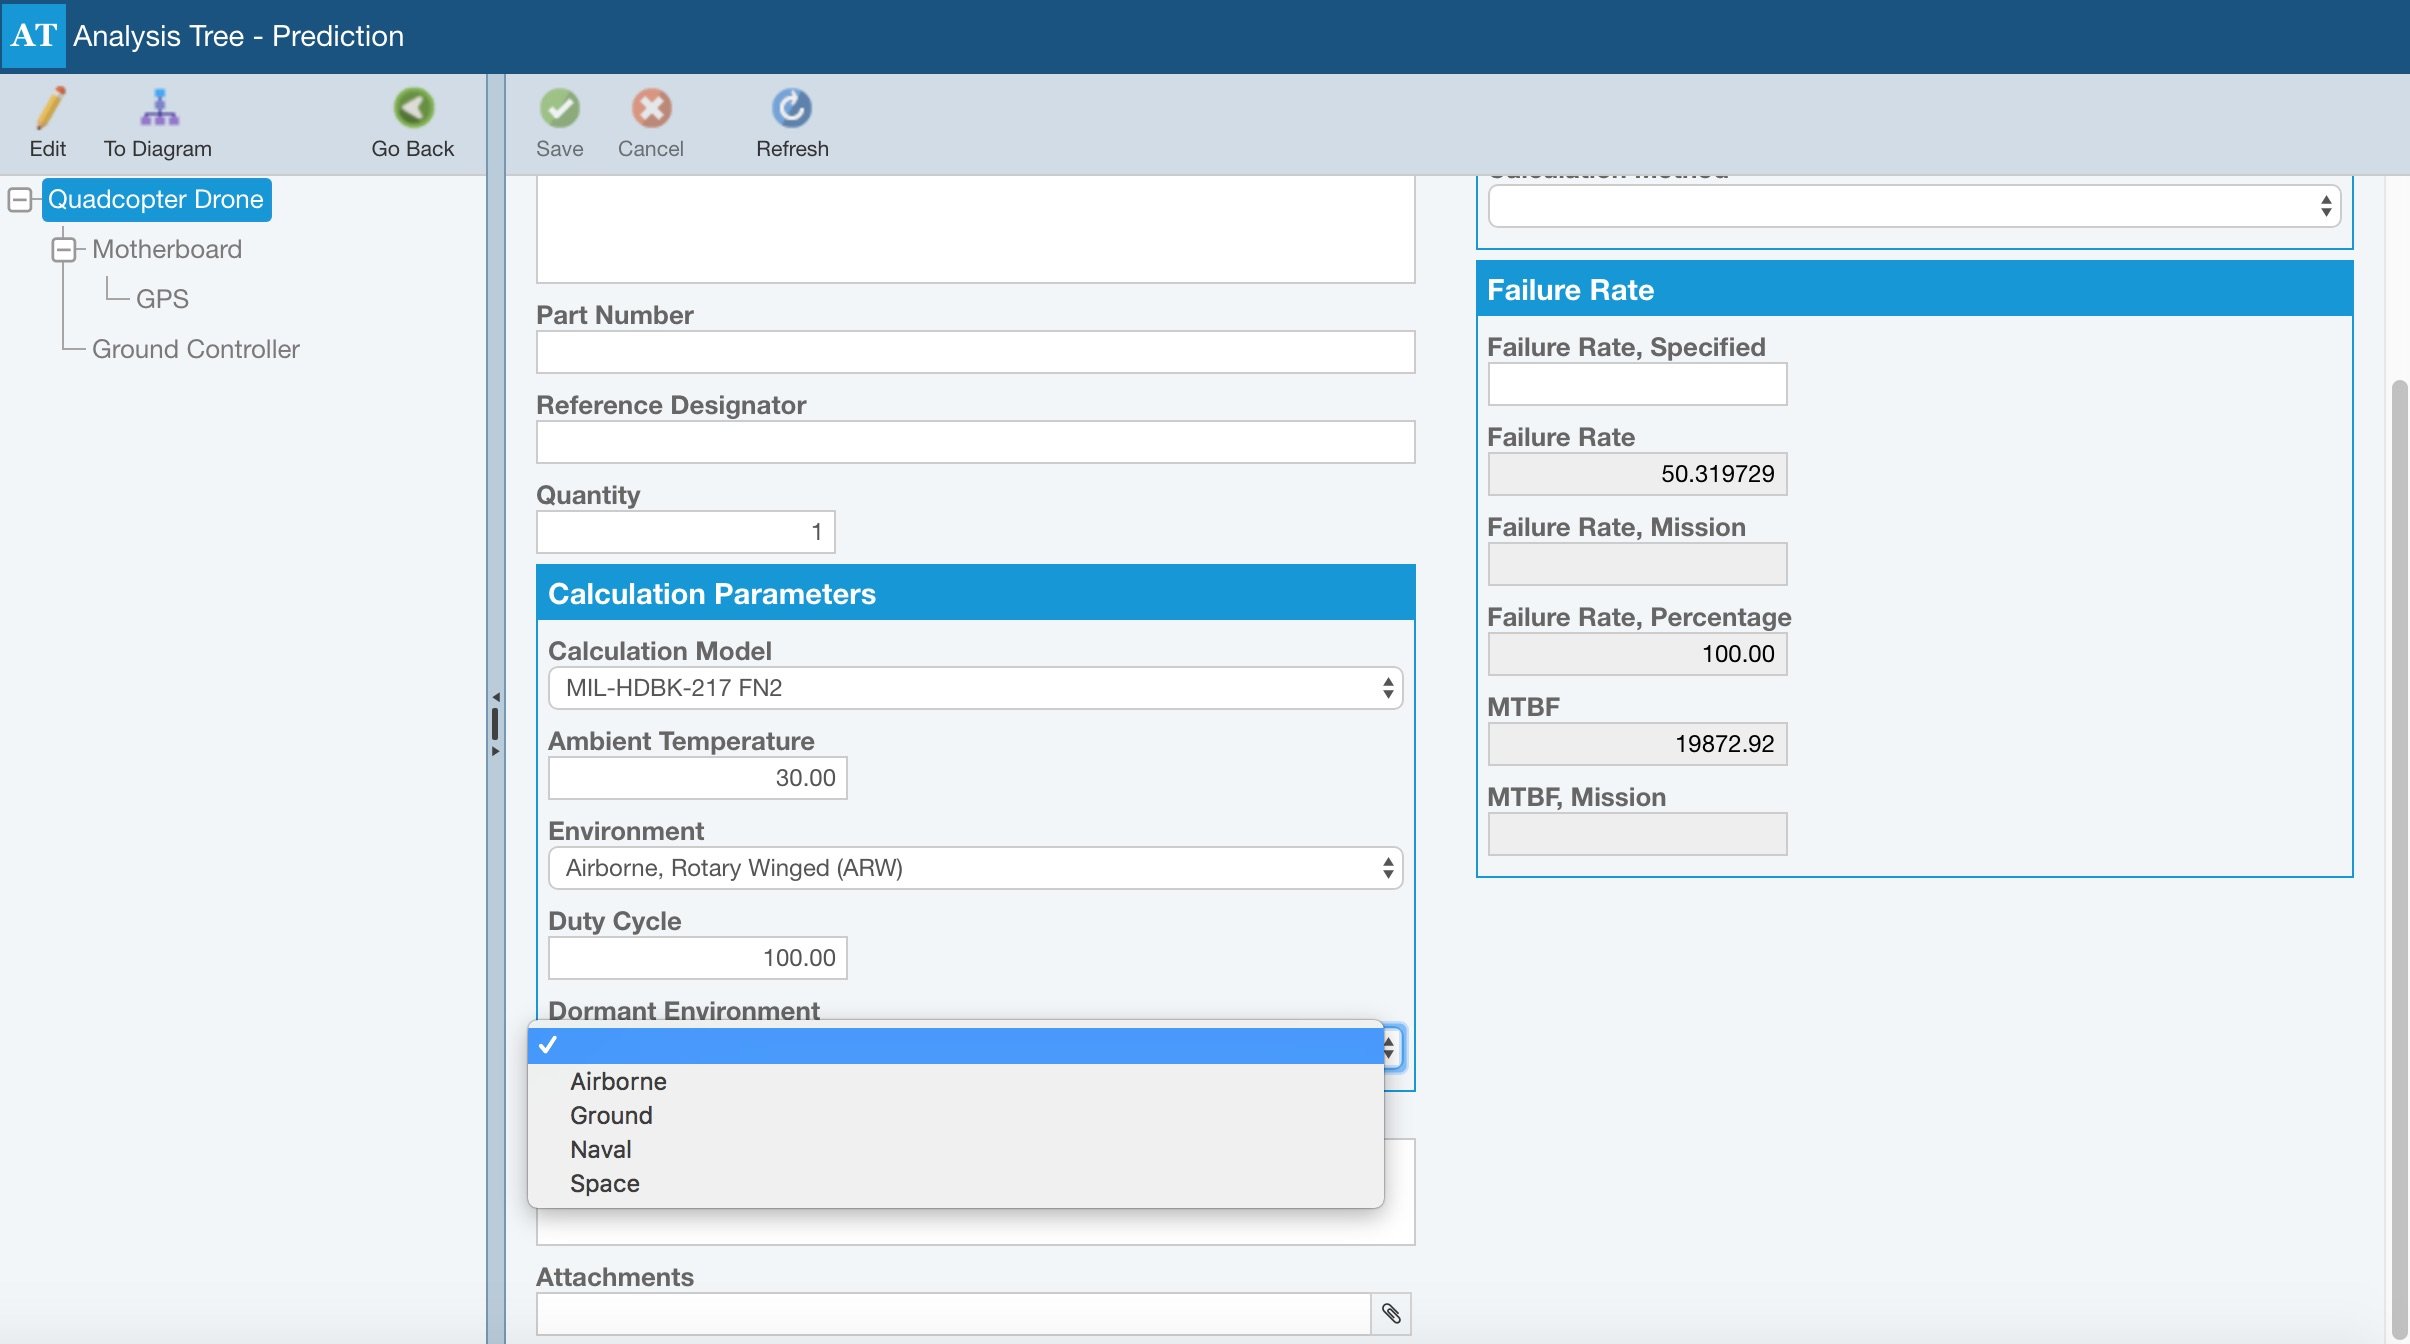
In some cases, you may want to account for dormant factors in your reliability prediction analyses. Relyence Reliability Prediction can factor in dormancy directly by specifying the dormant state in your Analysis Tree. Dormancy can also be accounted for in your mission profile analyses by defining the dormant phases and operation conditions as applicable.
Visual Analysis Diagrams
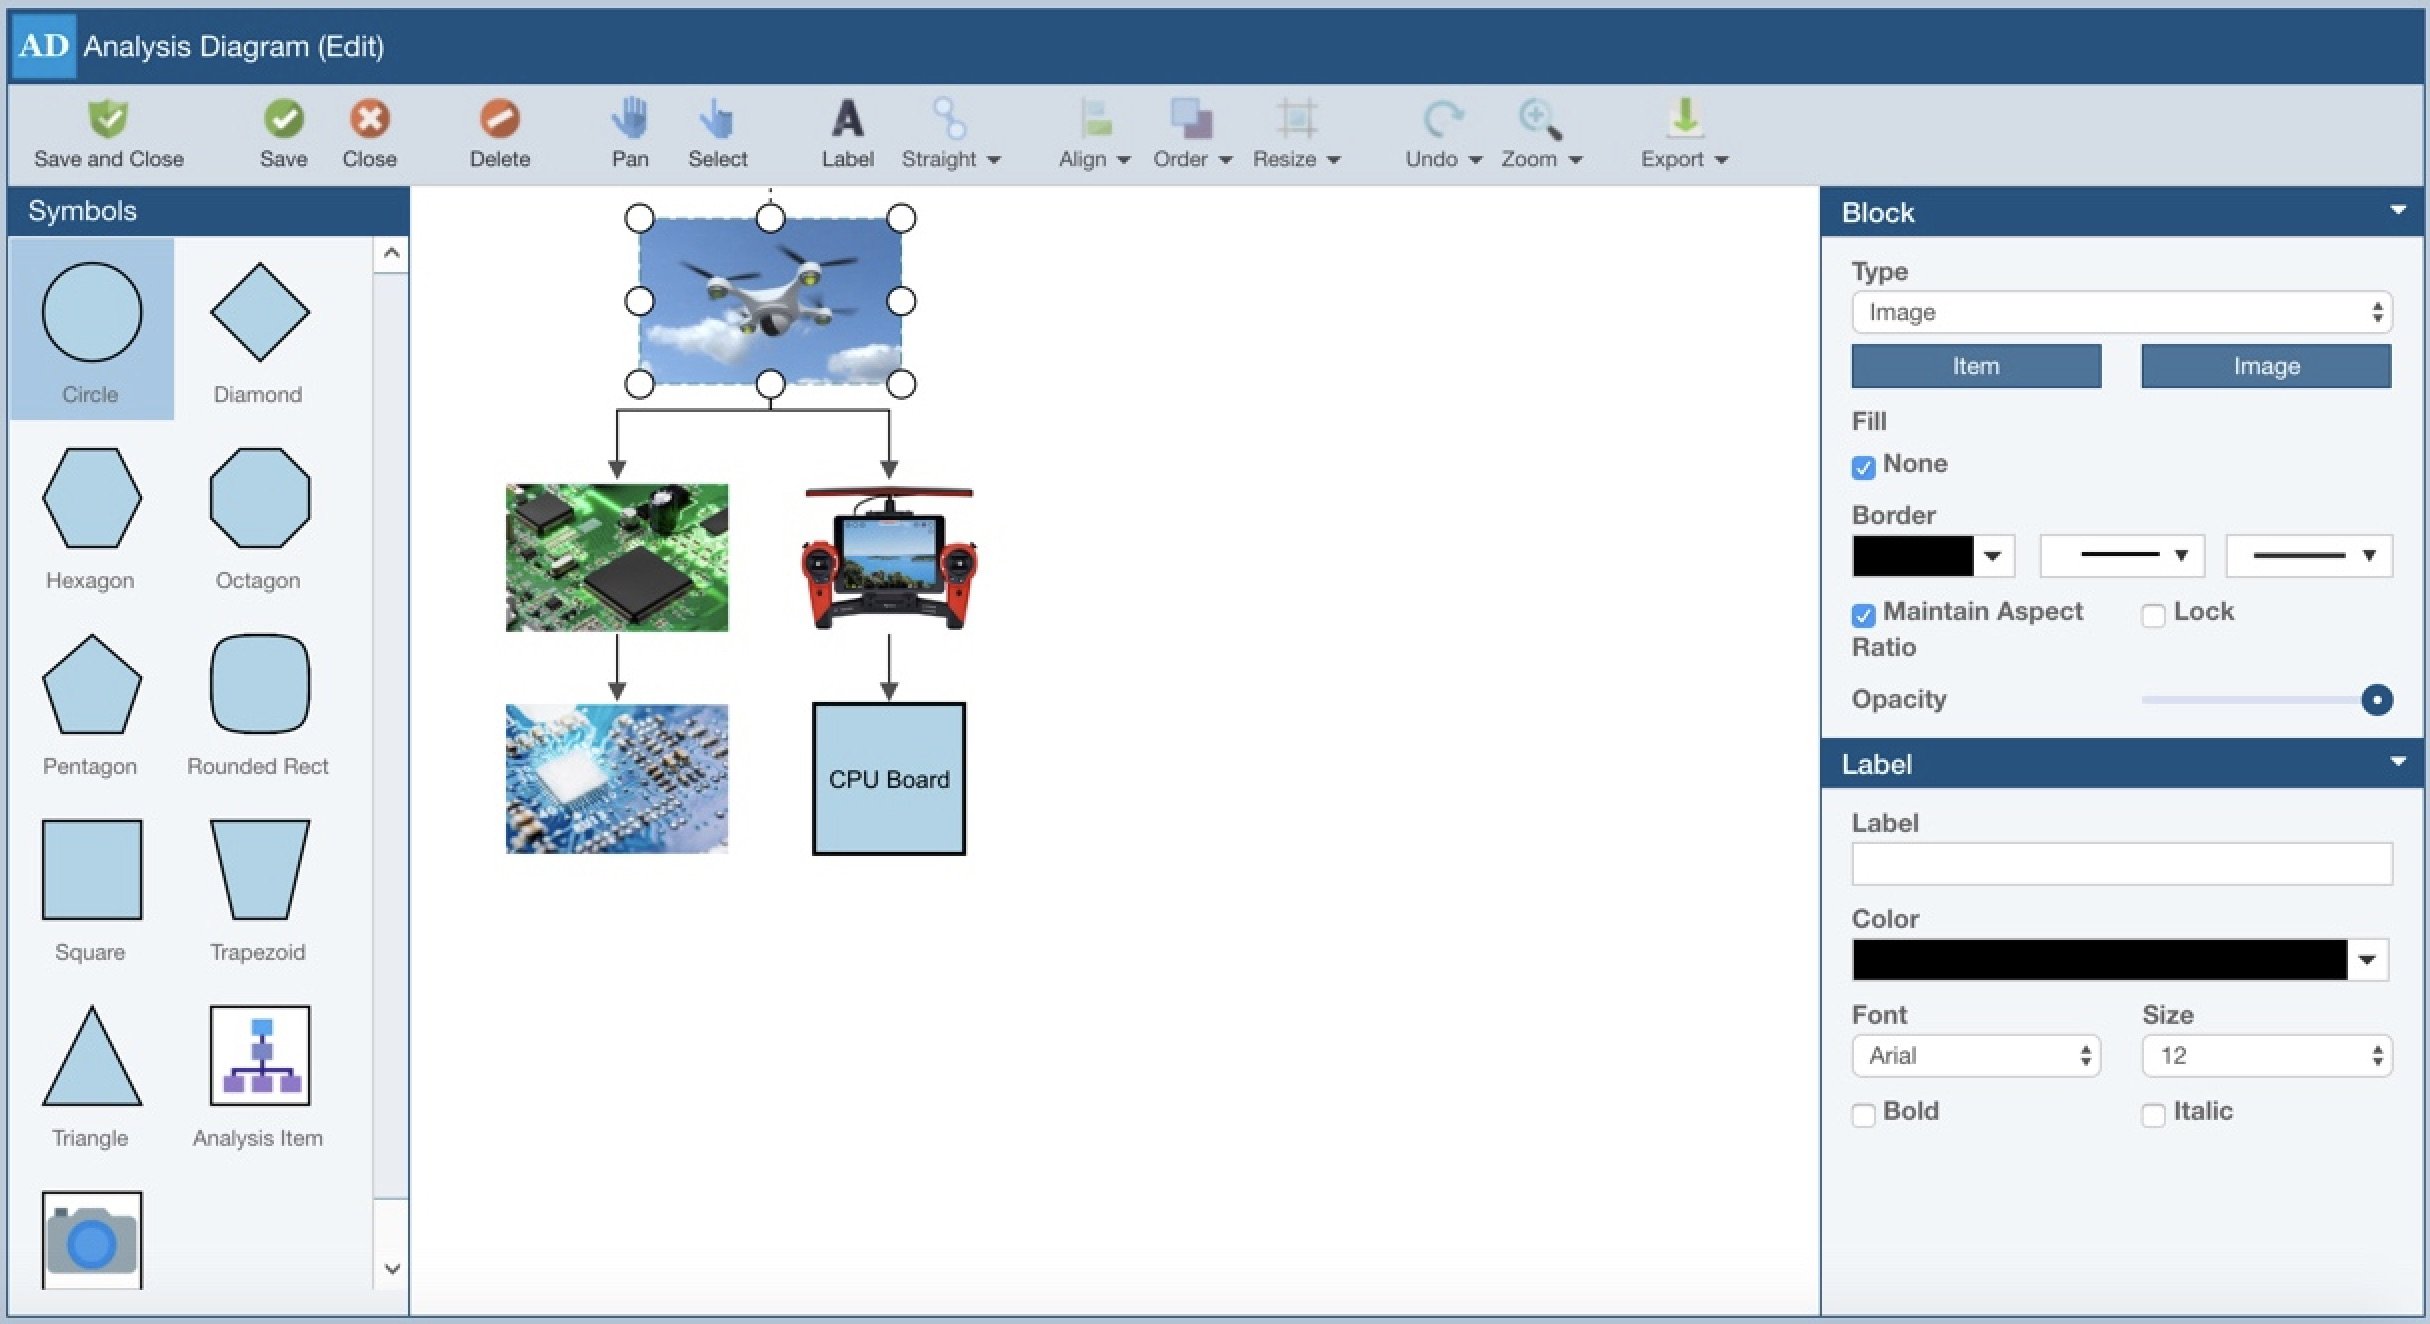
Relyence Reliability Prediction includes a diagramming tool to allow you to depict your product or system in a visually descriptive graphical format. The fully featured Analysis Diagram capability can be used in conjunction with the hierarchical tree representation of your system, or can be used stand-alone. Either way, using a drag-and-drop interface and customizing your diagram with an array of visual properties, including color, font, size, borders, etc., you can create an effective model of your system.
Complex System Modeling
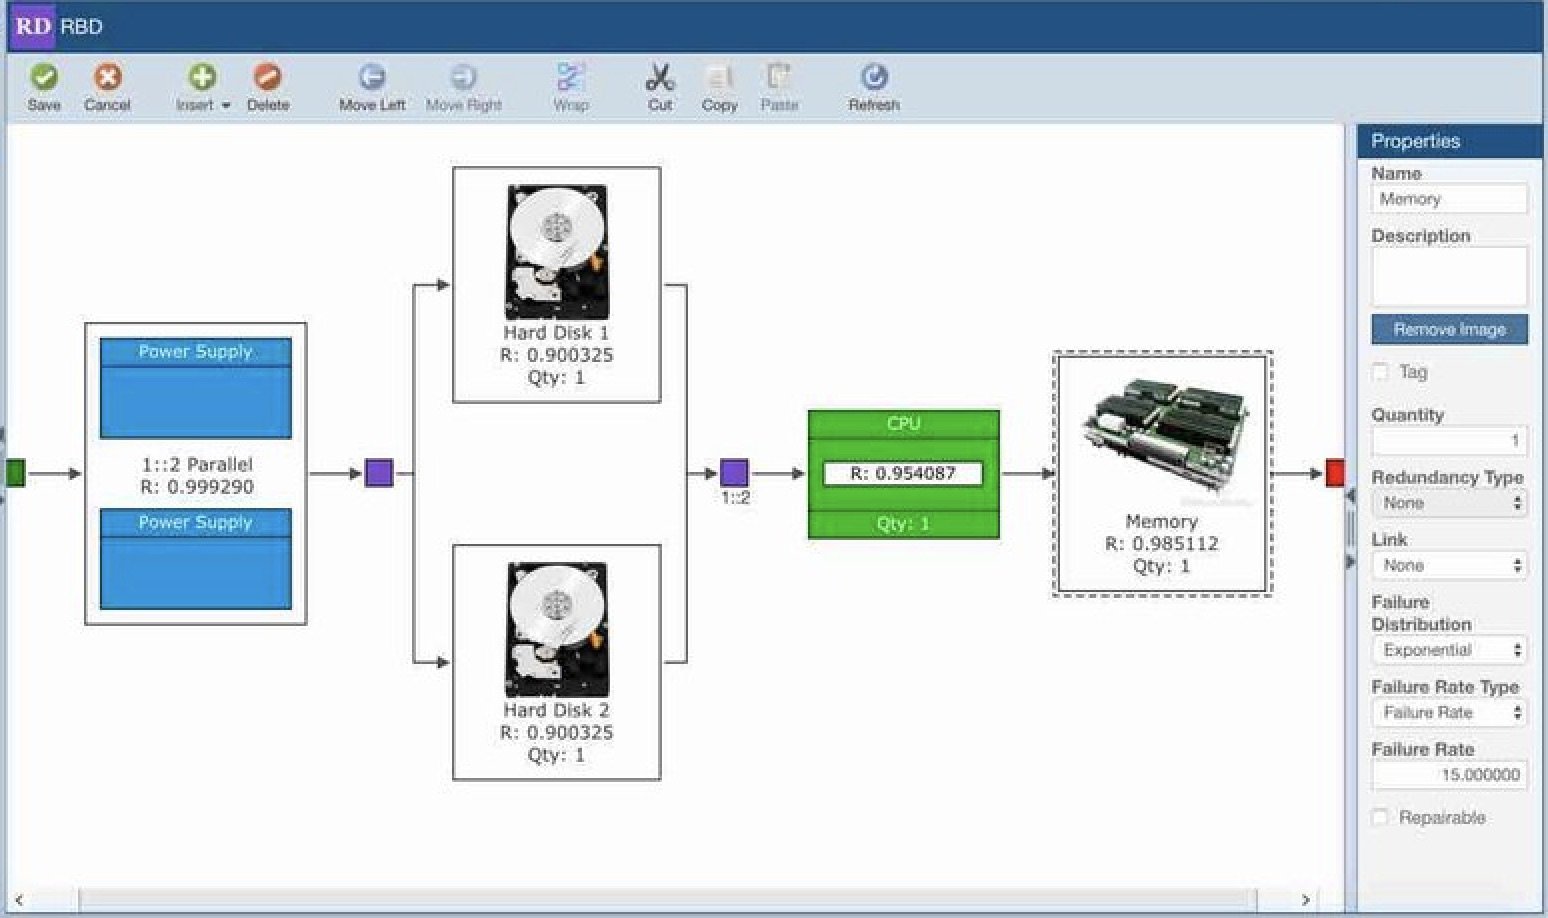
Relyence RBD is a highly capable module that enables you to model complex systems, including those that incorporate redundancy. When used together, Relyence RBD and Relyence Reliability Prediction provide a powerful combination pack for comprehensive system modeling. Components in Relyence RBD can be linked directly to your system components in Relyence Reliability Prediction, allowing your calculated failure rates to be taken into account automatically in your RBD analyses. As you modify and update your prediction analyses, those changes flow through to your RBD analyses. And with Relyence you can work in either direction – complete your prediction analyses, then build your RBD model, or build your RBD and then link it to your prediction analysis later.

