DASHBOARD OVERVIEW
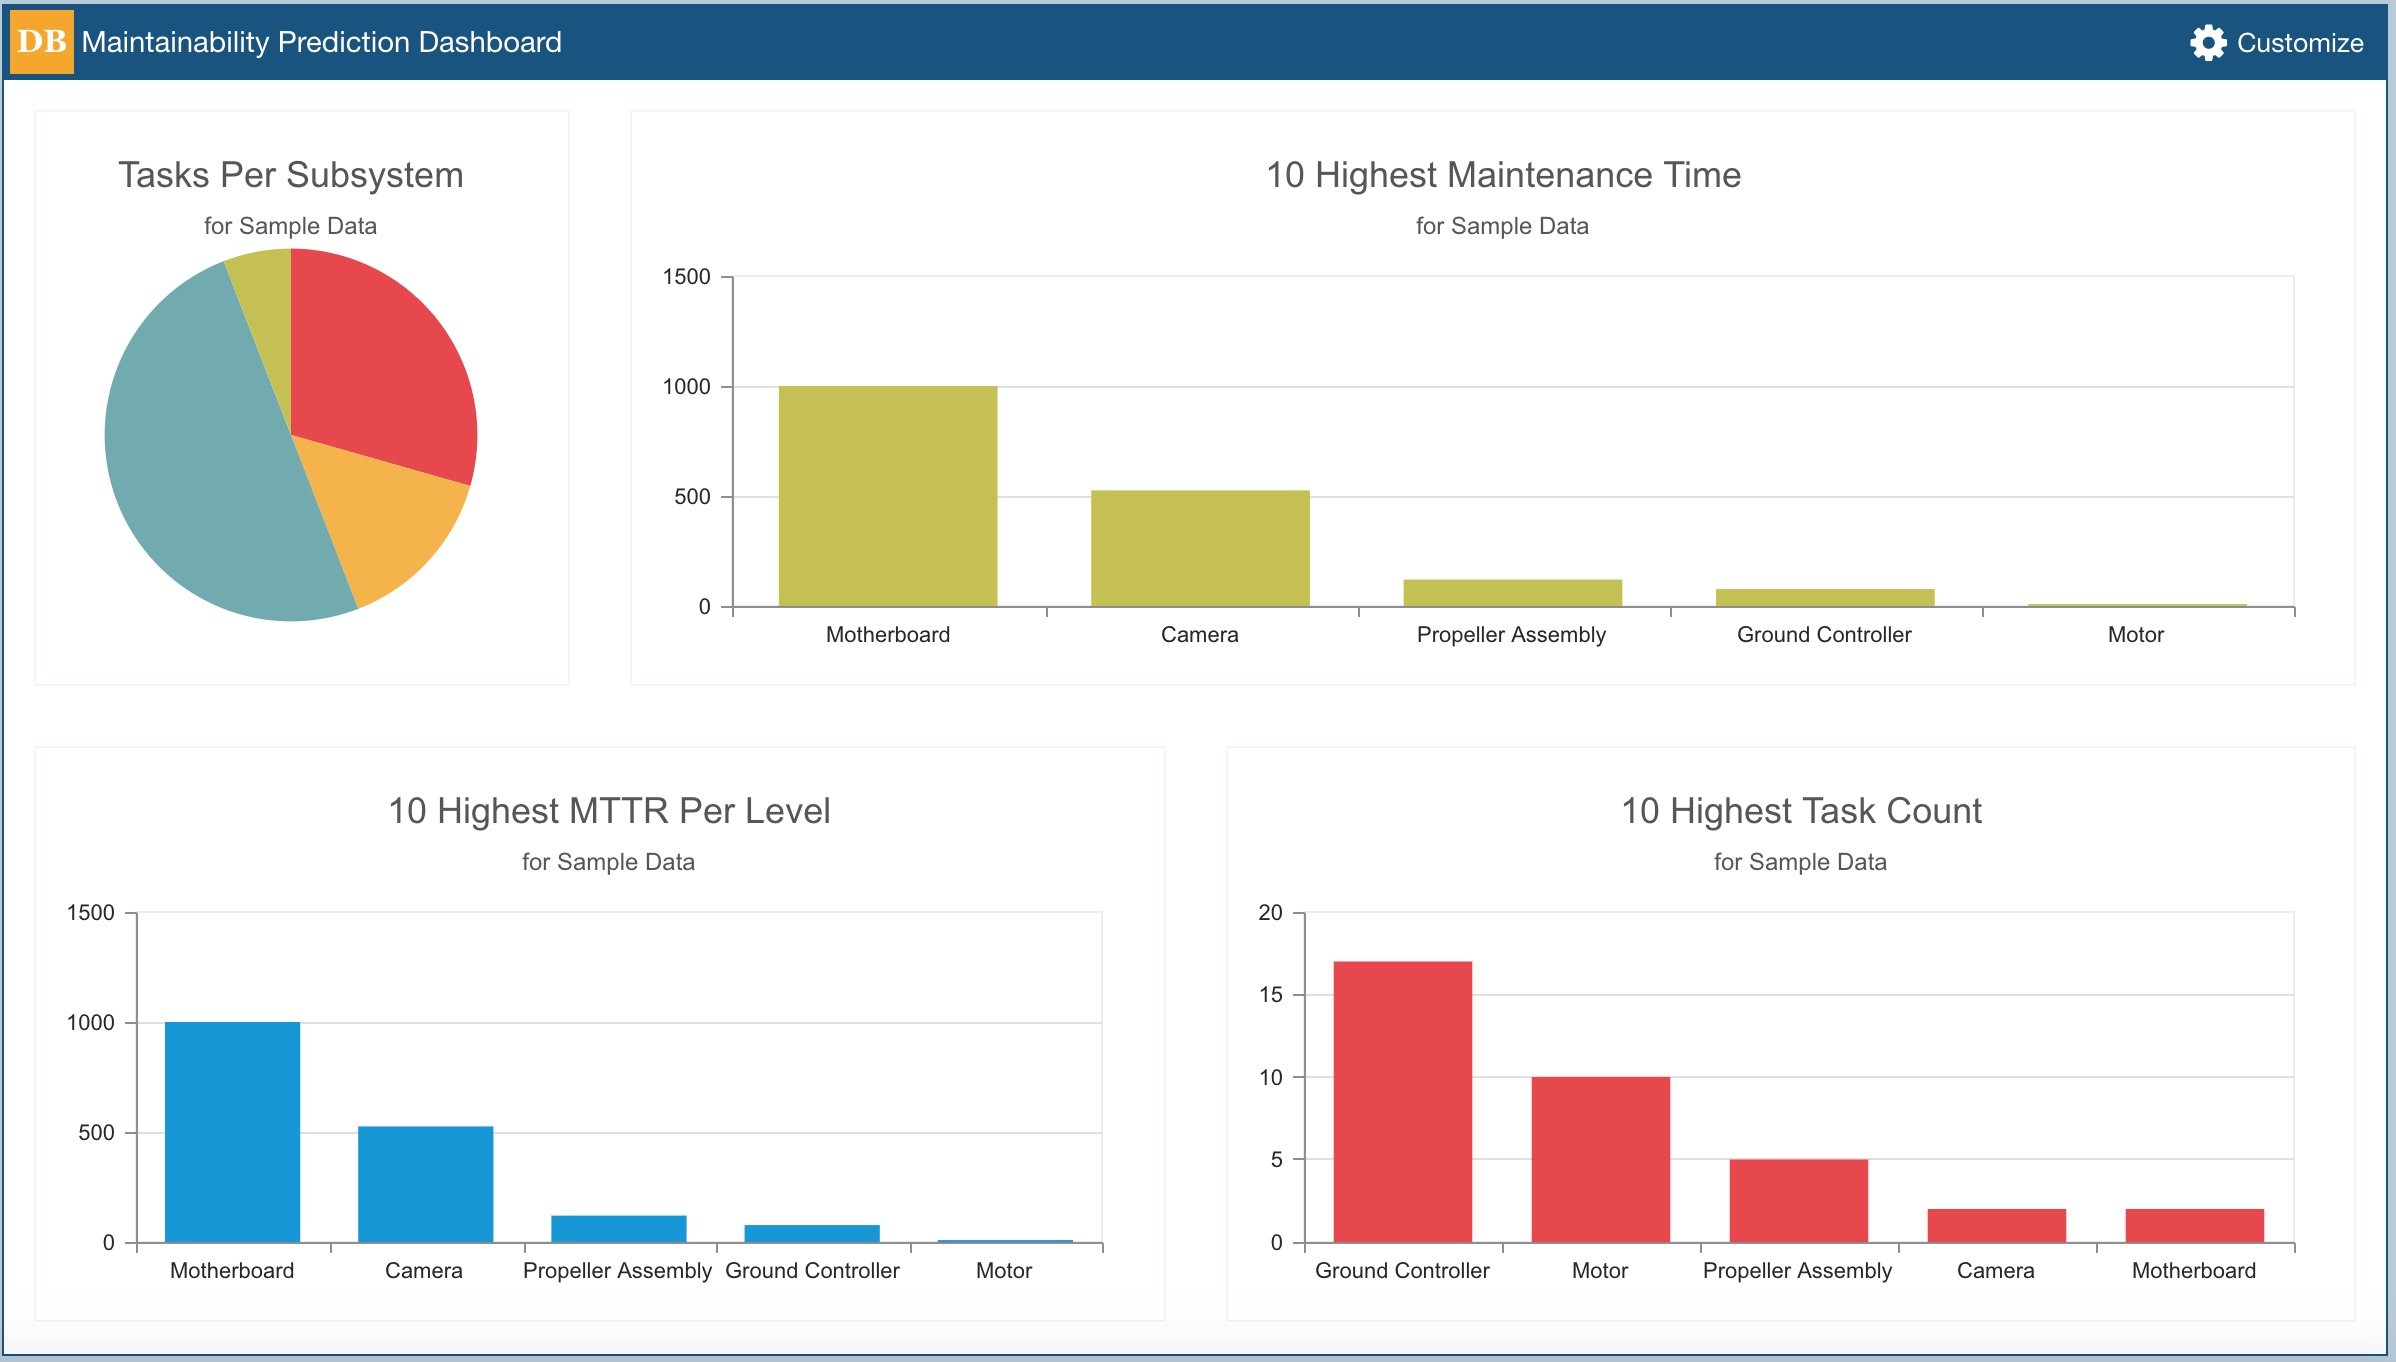
The Relyence Maintainability Prediction Dashboard provides an at-a-glance overview of your repair and maintenance metrics. Combining all the data you need for quick assessment, the Dashboard offers the ability to monitor and manage your Maintainability Predictions with efficiency and effectiveness. This focused overview enables you to quickly gauge system health, empowering you to proactively manage your repair processes and procedures.
High-Level, Across-Product Overview
The Relyence Maintainability Prediction Dashboard gathers and organizes your maintenance data to provide a holistic overview of your product or system. For example, you can use the Relyence Maintainability Prediction Dashboard to view the 10 items with the highest MTTR, or the 10 items with the lowest availability, or a breakdown of MTTR by component, or slice-and-dice an array of other repair and maintenance related metrics. The Relyence Maintainability Prediction Dashboard is useful for managers, analysts, engineers, designers – any or all team members. As with all well-designed dashboards, the Relyence Maintainability Prediction Dashboard allows team leaders as well as contributors to gather information in real-time to help achieve your system uptime goals.
Drilldown Capabilities
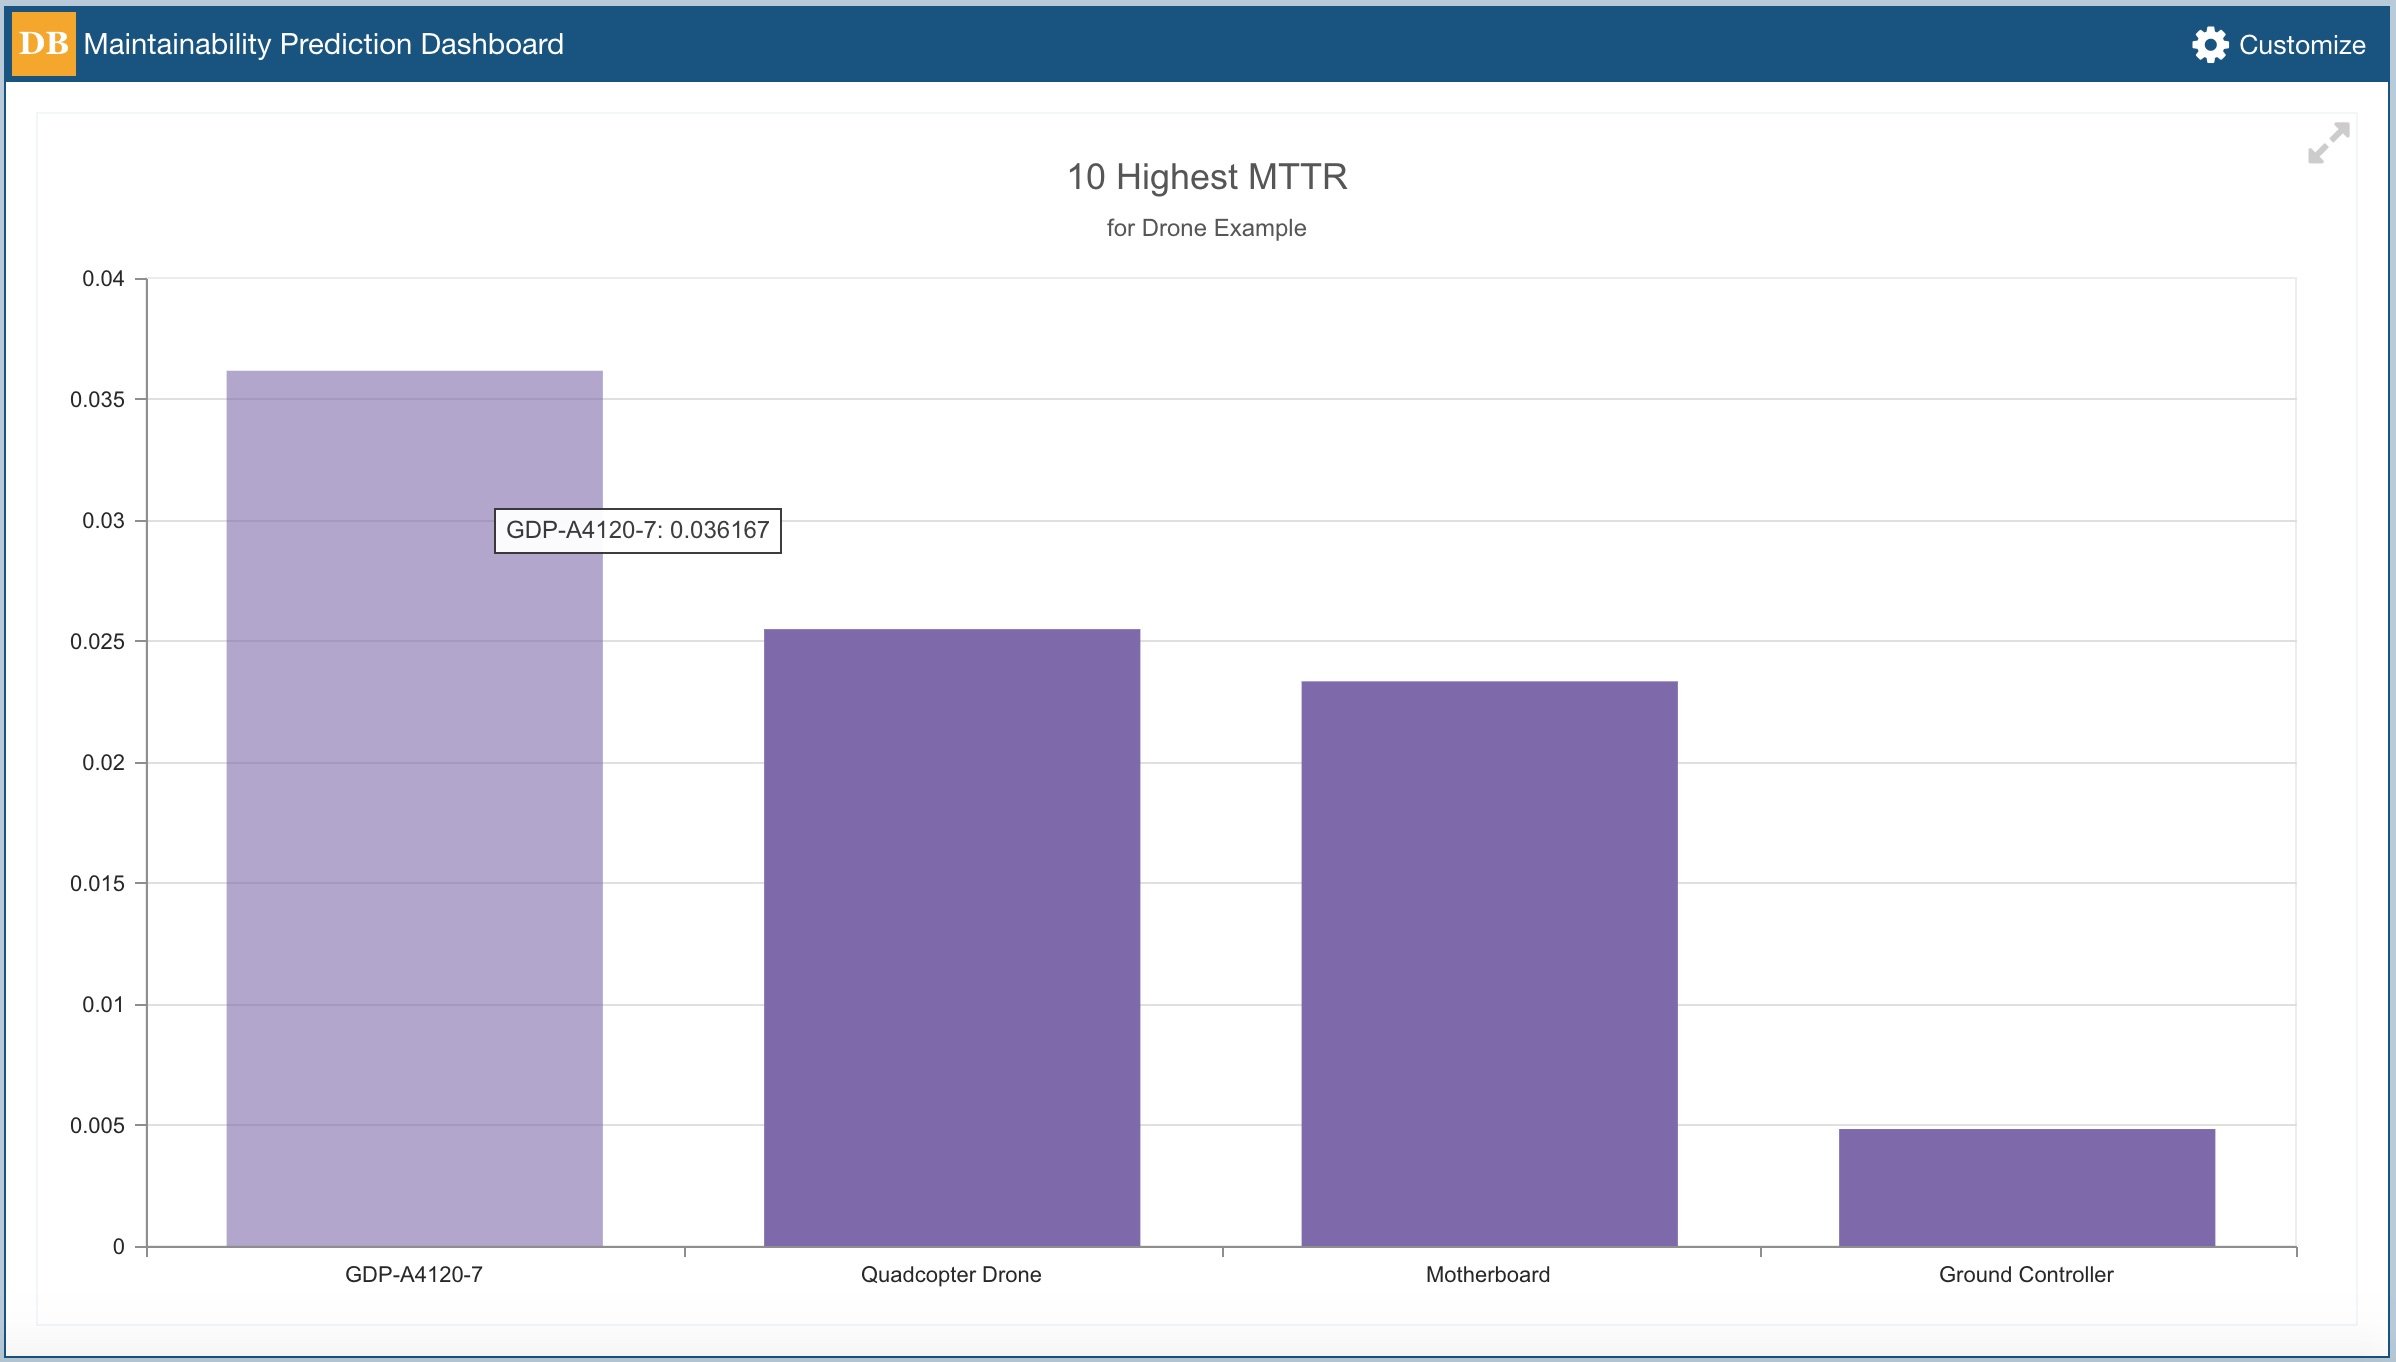
While the Relyence Maintainability Prediction Dashboard provides a high-level overview, the underlying data is always available at your fingertips with the click of your mouse. The Relyence Maintainability Prediction Dashboard’s drilldown feature takes you from a chart, table, or graph directly to the corresponding analysis information. Want to view your component with the highest MTTR? Simply click on the item in your Dashboard and go directly to that component in your analysis. Want to get the details on the item which has a complex repair process? Click for quick drilldown access to the component in question.
Customizable Dashboard
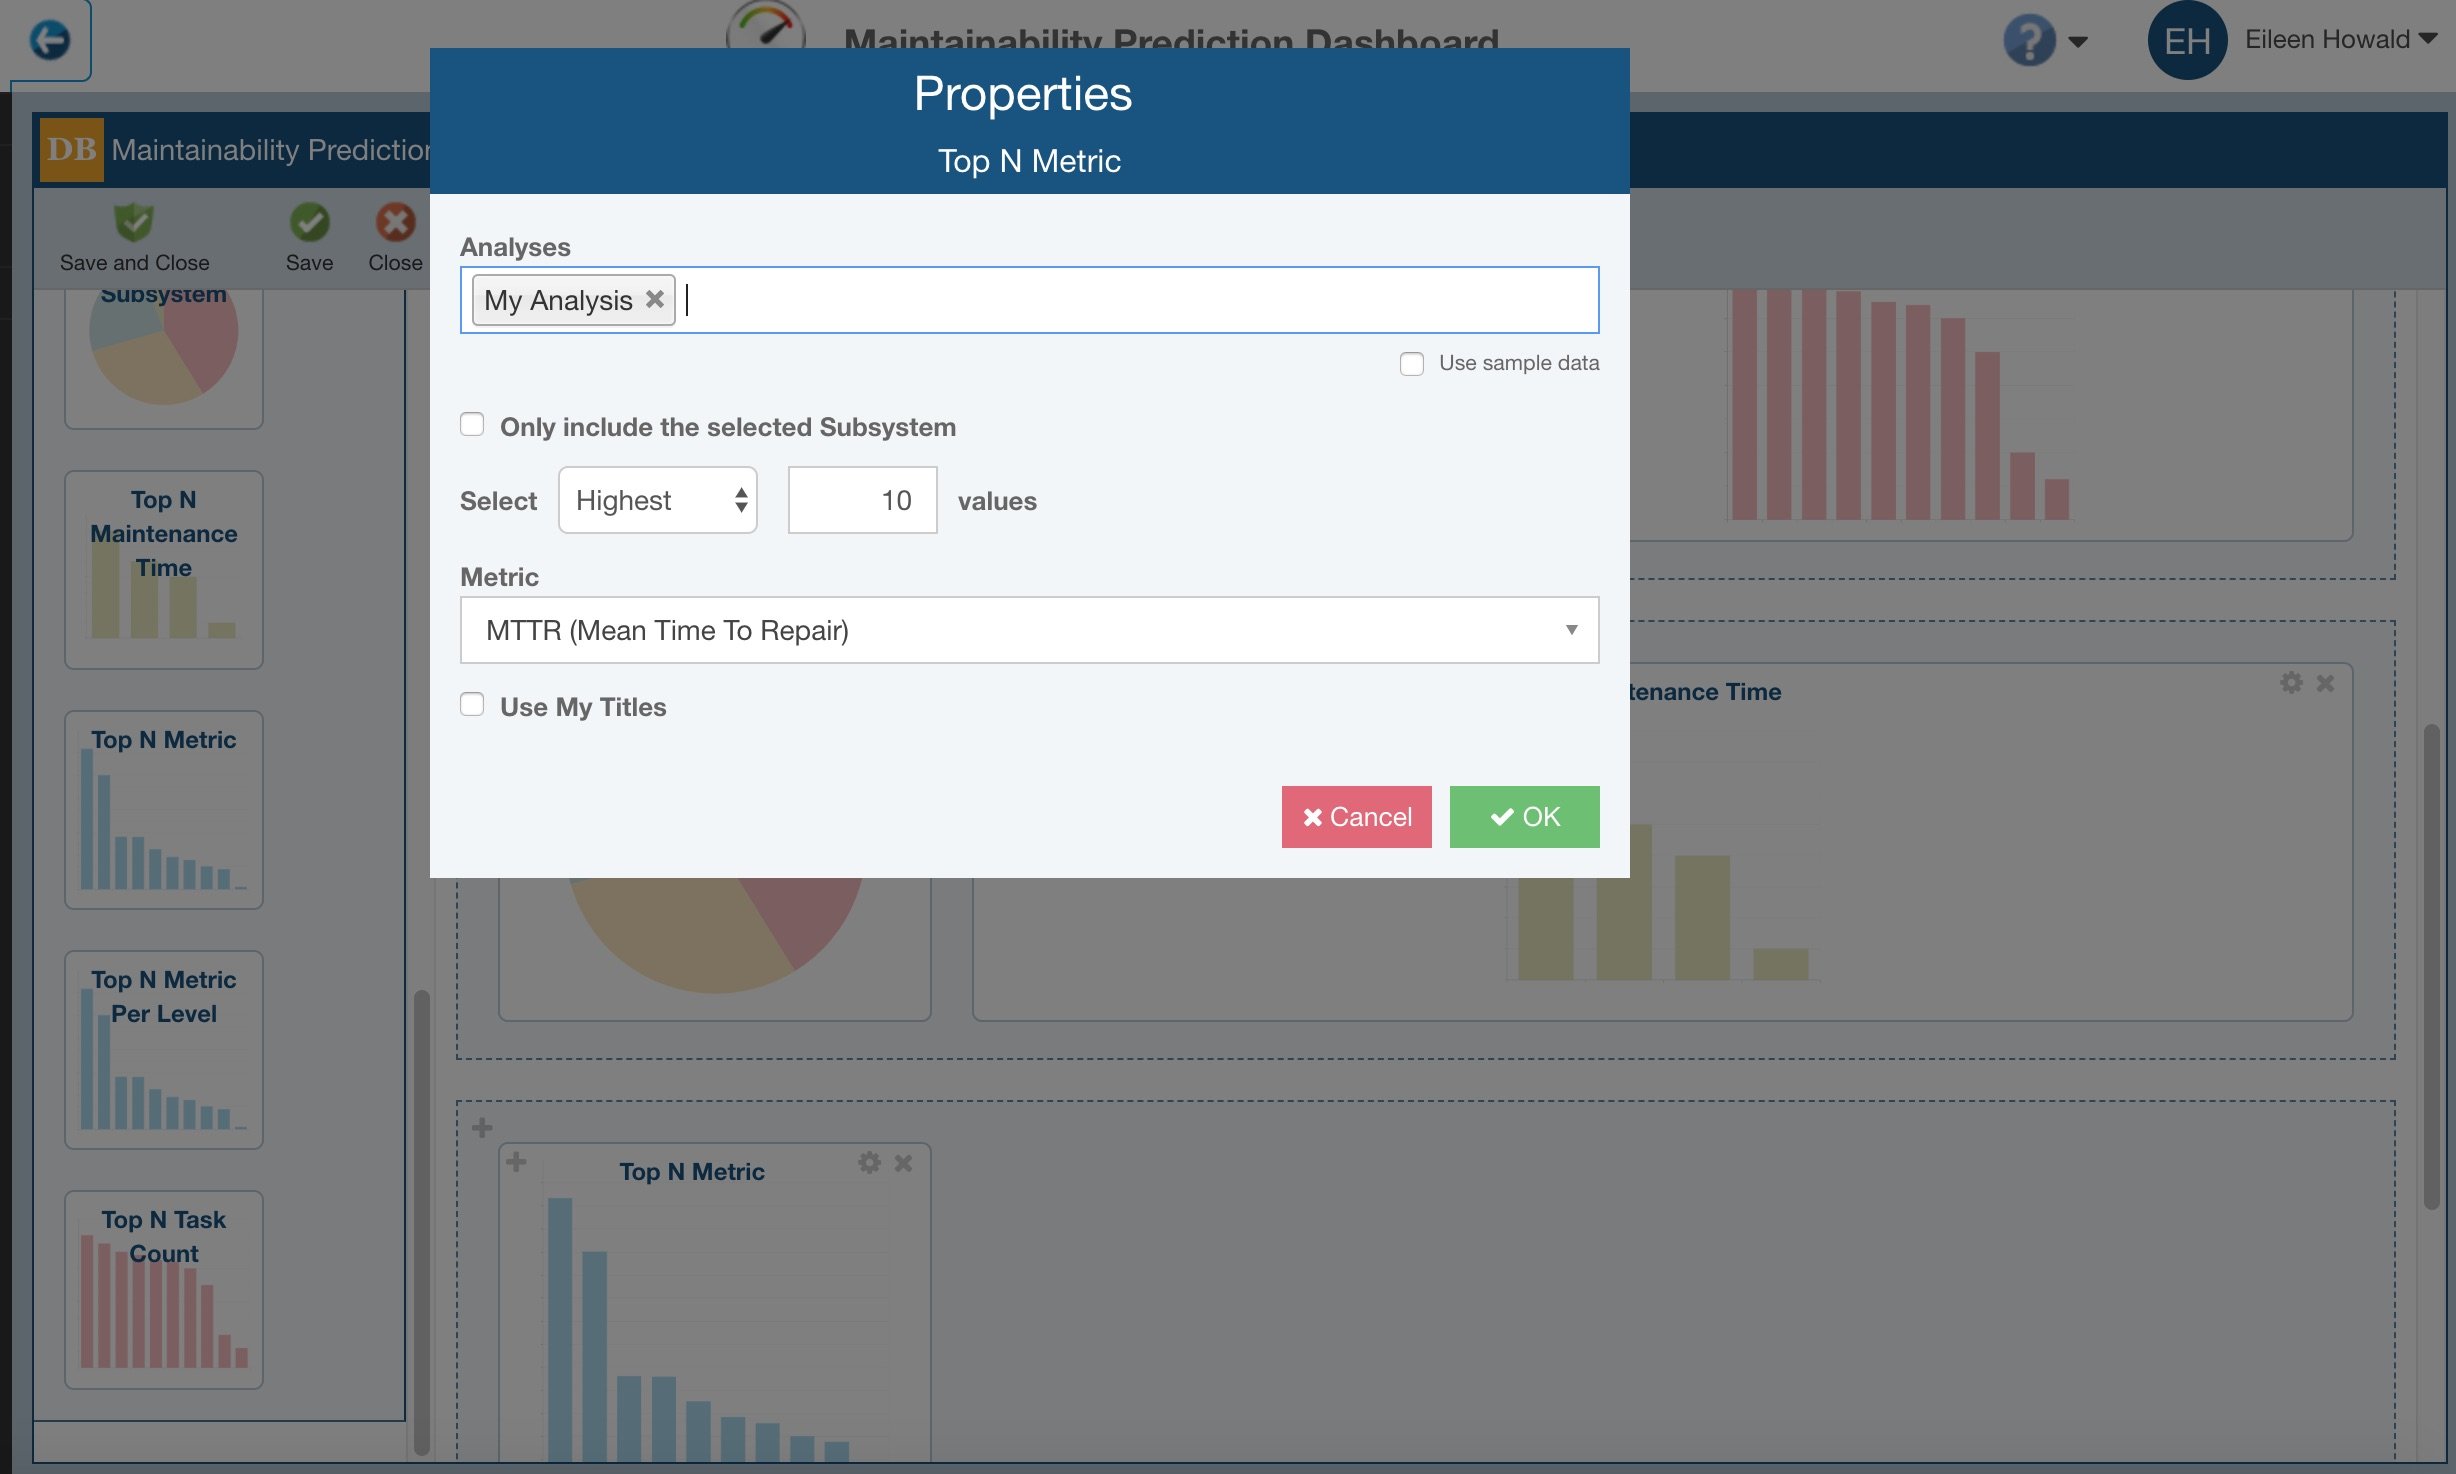
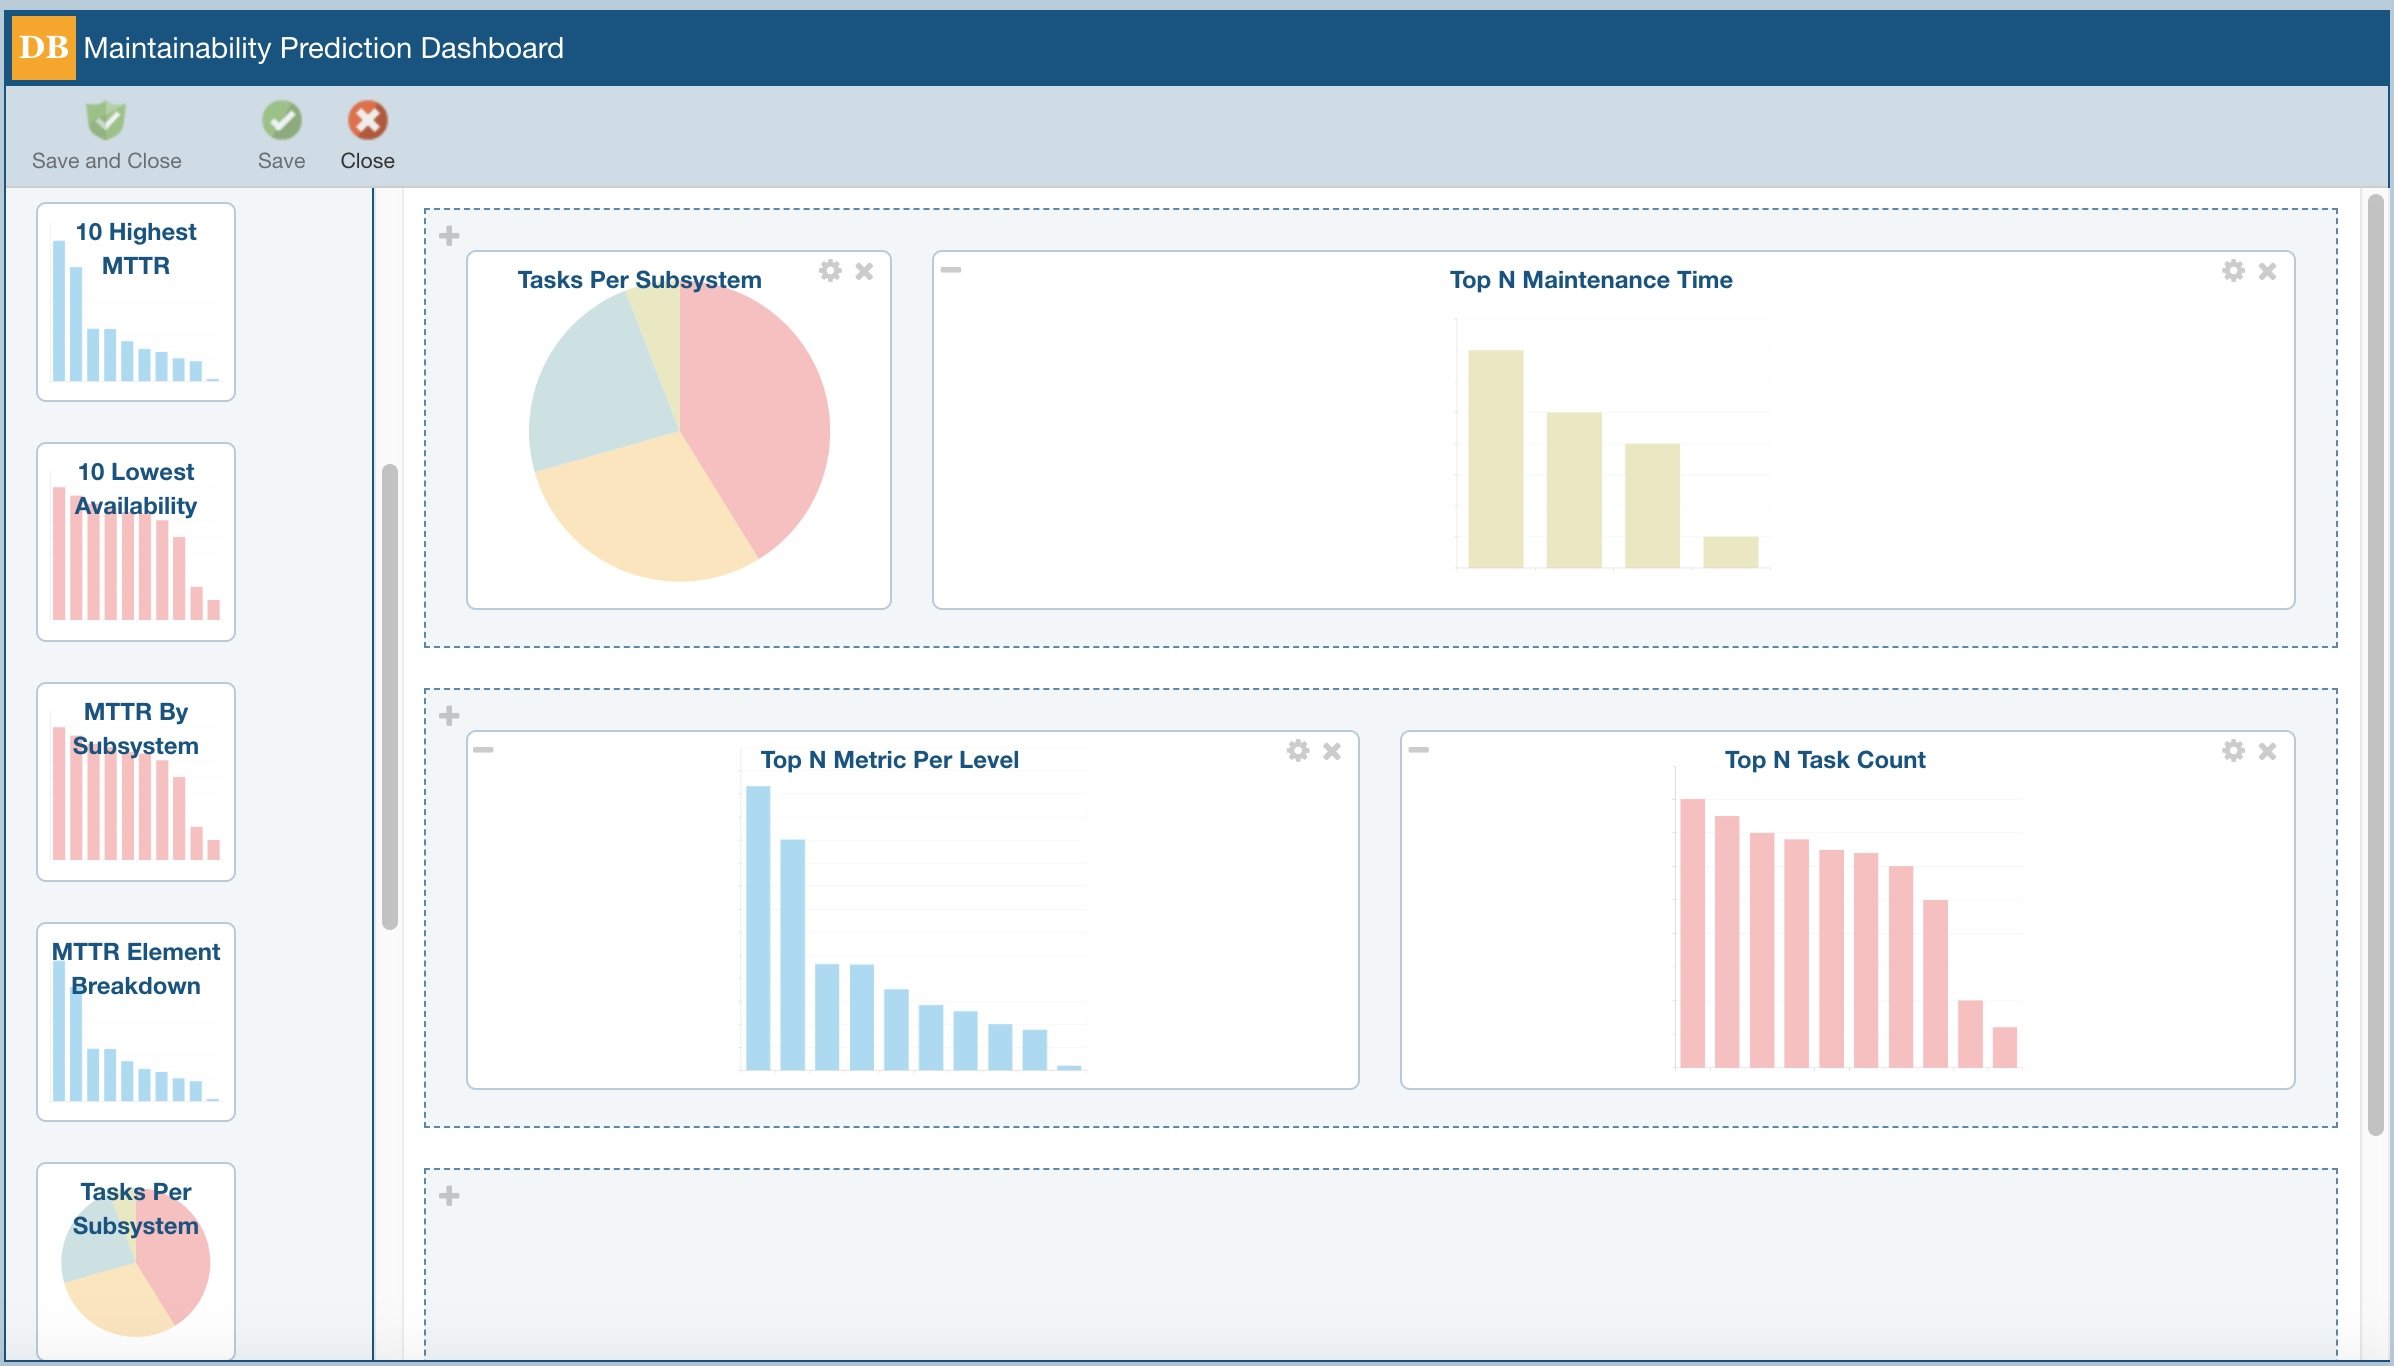
The Relyence Maintainability Prediction Dashboard is completely customizable, so you can create a dashboard suitable for your needs, or create any number of dashboards. You can define the look and layout of your dashboards, as well as specify properties of your various charts and graphs. You can combine data from other Relyence modules into a single dashboard for a comprehensive overview of system health.
The Widgets
Using the easy drag-and-drop interface, select from the comprehensive set of dashboard elements, or widgets, to include in your dashboard. The widgets built into the Relyence Maintainability Prediction Dashboard include:
- 10 Highest MTTR: Bar graph of the 10 items in your Maintainability Predictions with the highest MTTR (Mean Time To Repair) values
- 10 Lowest Availability: Bar graph of the 10 items in your Maintainability Predictions with the lowest availability
- MTTR by Subsystem: A listing of the MTTR values for each Subsystem in your Analysis
- MTTR Element Breakdown: A breakdown of each individual MTTR Element – Preparation, Fault Isolation, Disassembly, Interchange, Reassembly, Alignment, Checkout, and Start Up
- Tasks per Subsystem: A breakdown of the number of tasks per Subsystem in your Analysis
- Top (N) Maintenance Time: Chart of the top (N) number of items with the highest maintenance time. The widgets that include the (N) designator allow you to specific the number of items to include on the chart. For example, you may want to see the top 3 in some cases, or the top 10 in others. Typically, (N) is set to 10 by default, but you can select the quantity in the widget properties.
- Top (N) Metric: A generic widget allowing you to specify the metric you wish to chart and the number of items to include
- Top (N) Metric per Level: Similar to the Top (N) Metric widget, allowing you to specific the metric you wish to chart and the number of items to include, but categorized by Maintenance Level. By default, Relyence Maintainability defines the levels as those from MIL-HDBK-472 – Organizational, Intermediate, and Depot – but you can customize this list to your preferences.
- Top (N) Task Count: The specified number of items with the highest task count. This widget is helpful to see which items have a complex repair process, and may be open to further review and assessment.


