FRACAS METRICS
By providing a unique set of calculated metrics based on your Incident and Problem data, Relyence FRACAS enables you to extend your FRACAS process into a true analytical tool for actionable insight. Relyence FRACAS can compute reliability and availability metrics, perform trend analysis, and in conjunction with Relyence Reliability Prediction, enables you to compare fielded reliability metrics to your predicted values. Additionally, Relyence FRACAS provides an easy-to-use interface for creating your own custom calculations for trackable metrics to meet your specific needs.

Reliability Metrics
Relyence FRACAS provides the ability to incorporate operating time information alongside your Incident and Problem data. As you capture data about your issues, you can augment it with time-related data. This combination of failure reports and operating time enables Relyence FRACAS to calculate Failure Rate and MTBF (Mean Time Between Failures). Over time, your reliability metrics become more refined as your data sample grows and becomes a more accurate reflection of your product performance.
Repair and Availability Metrics
Along with your failure reports, your associated repair data can be utilized to provide insight into your product performance. Using a combination of failure reports and repair information, Relyence FRACAS can compute MTTR (Mean Time to Repair). Adding on operating time information through the use of Relyence FRACAS Time Logs, MTTF (Mean Time to Failure) and Availability can be calculated.


Trend Scores
Relyence FRACAS includes the capability to compute the valuable trend score metric. Your trend score is an indicator of whether your system is improving, remaining stable, or degrading over time. The trend score value is computed based on both your FRACAS incident reports and operating time data. A trend score of zero indicates your system is in a relatively steady-state condition, meaning your incident report rate is remaining fairly constant. Negative trend scores indicate a decreasing incident rate or an improving system. Positive trend scores indicate incident reports are increasing or a degrading system. Relyence color-codes your trend scores for easier assessment: green is improving, red is degrading. This unique metric enables you to quickly gauge your system health and work proactively to address problems in their early stages.
Predictive vs Actual Metrics
Relyence FRACAS provides insightful metrics to allow you to gauge your current and ongoing system health by computing the following set of reliability and availability metrics:
- Failure Rate
- MTBF (Mean Time Between Failures)
- MTTF (Mean Time to Failure)
- MTTR (Mean Time to Repair)
- Availability
If you use Relyence FRACAS in conjunction with Relyence Reliability Prediction and/or Relyence RBD, you have the ability to compare your actual field-based metrics obtained from your FRACAS information to the predicted metrics obtained from Relyence’s analytical tools, enabling you to track and analyze your fielded units based on your predictive analyses.

Formulas
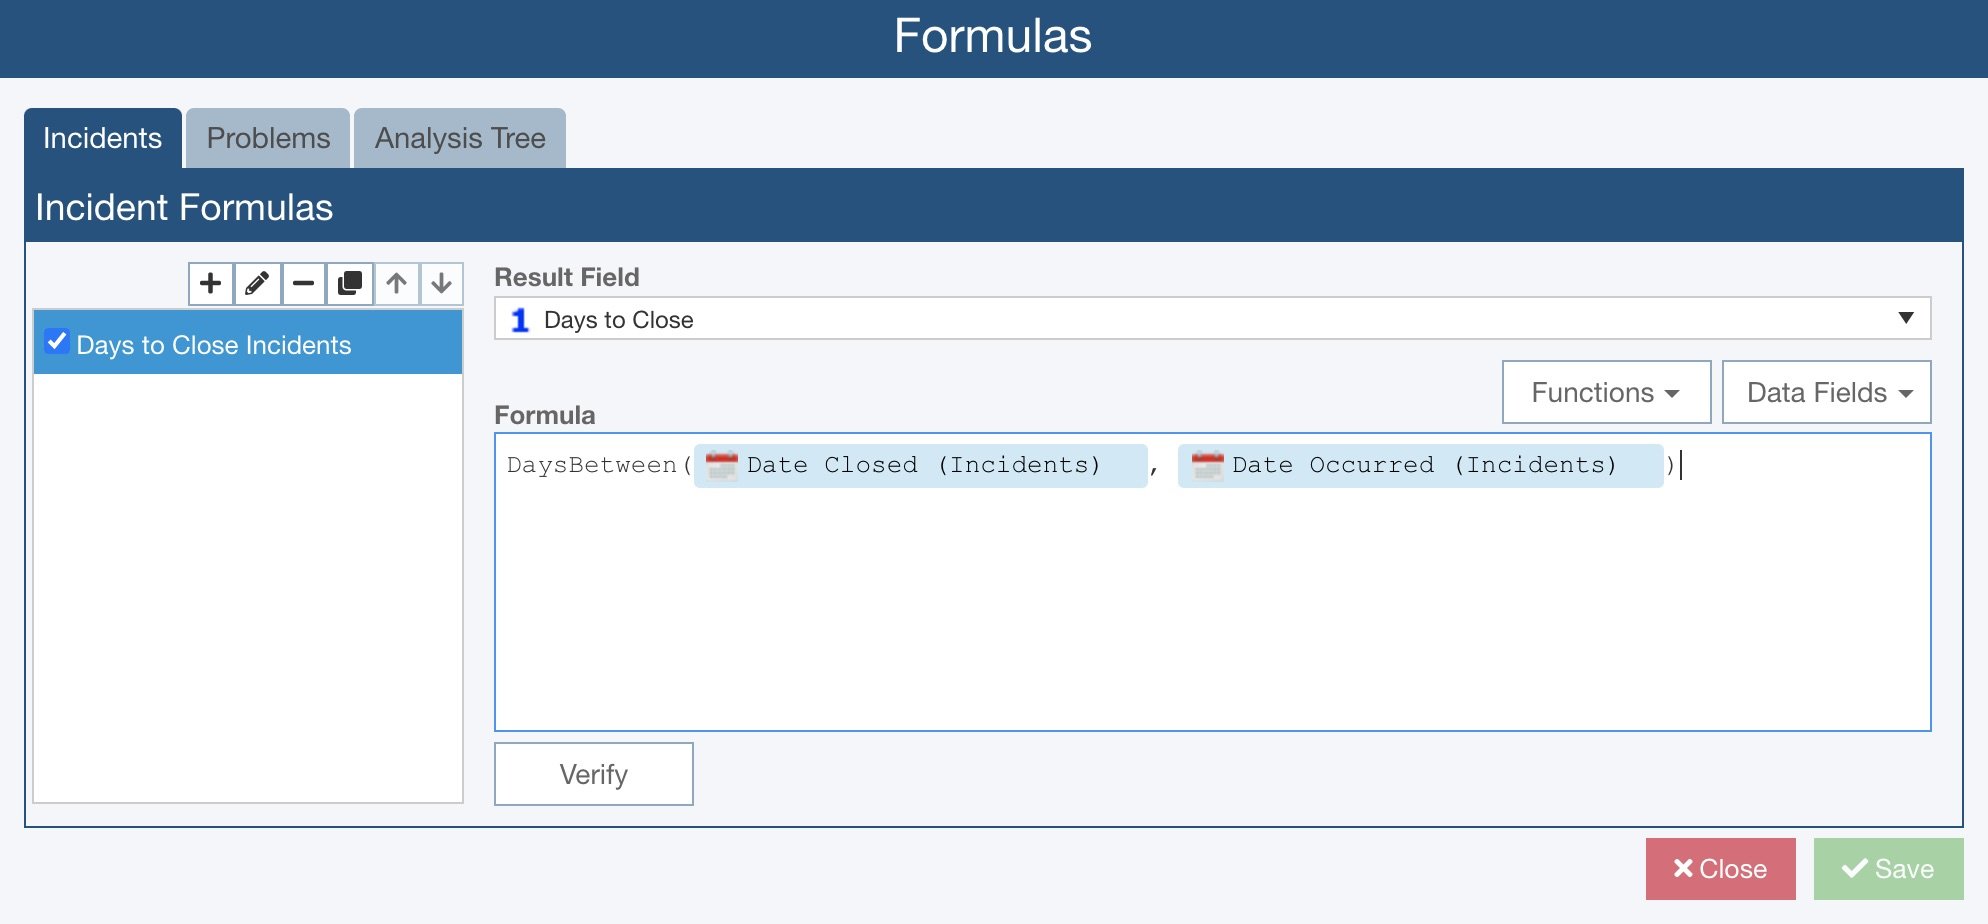
Relyence FRACAS includes an intuitive interface to define your own completely customized Formulas. This enables you to set up calculations for FRACAS-based metrics that are most beneficial to your organization. For example, using this feature, you can compute the total cost of repairs, or the number of days to close an incident, or a host of other metrics.
There are four types of FRACAS Formulas you can create: Incident-based, Problems-based, Subtable-based, or Analysis Tree-based.
A wide range of flexibility is available for creating complex Formulas, such as those including logical operators (AND, OR, <>, etc.), constants, dates, and programmatic functions (if/then/else).
FRACAS Formulas also support Roll-up and Aggregate functions such as SUM and AVG to provide cumulative calculations.

