ANALYTICS
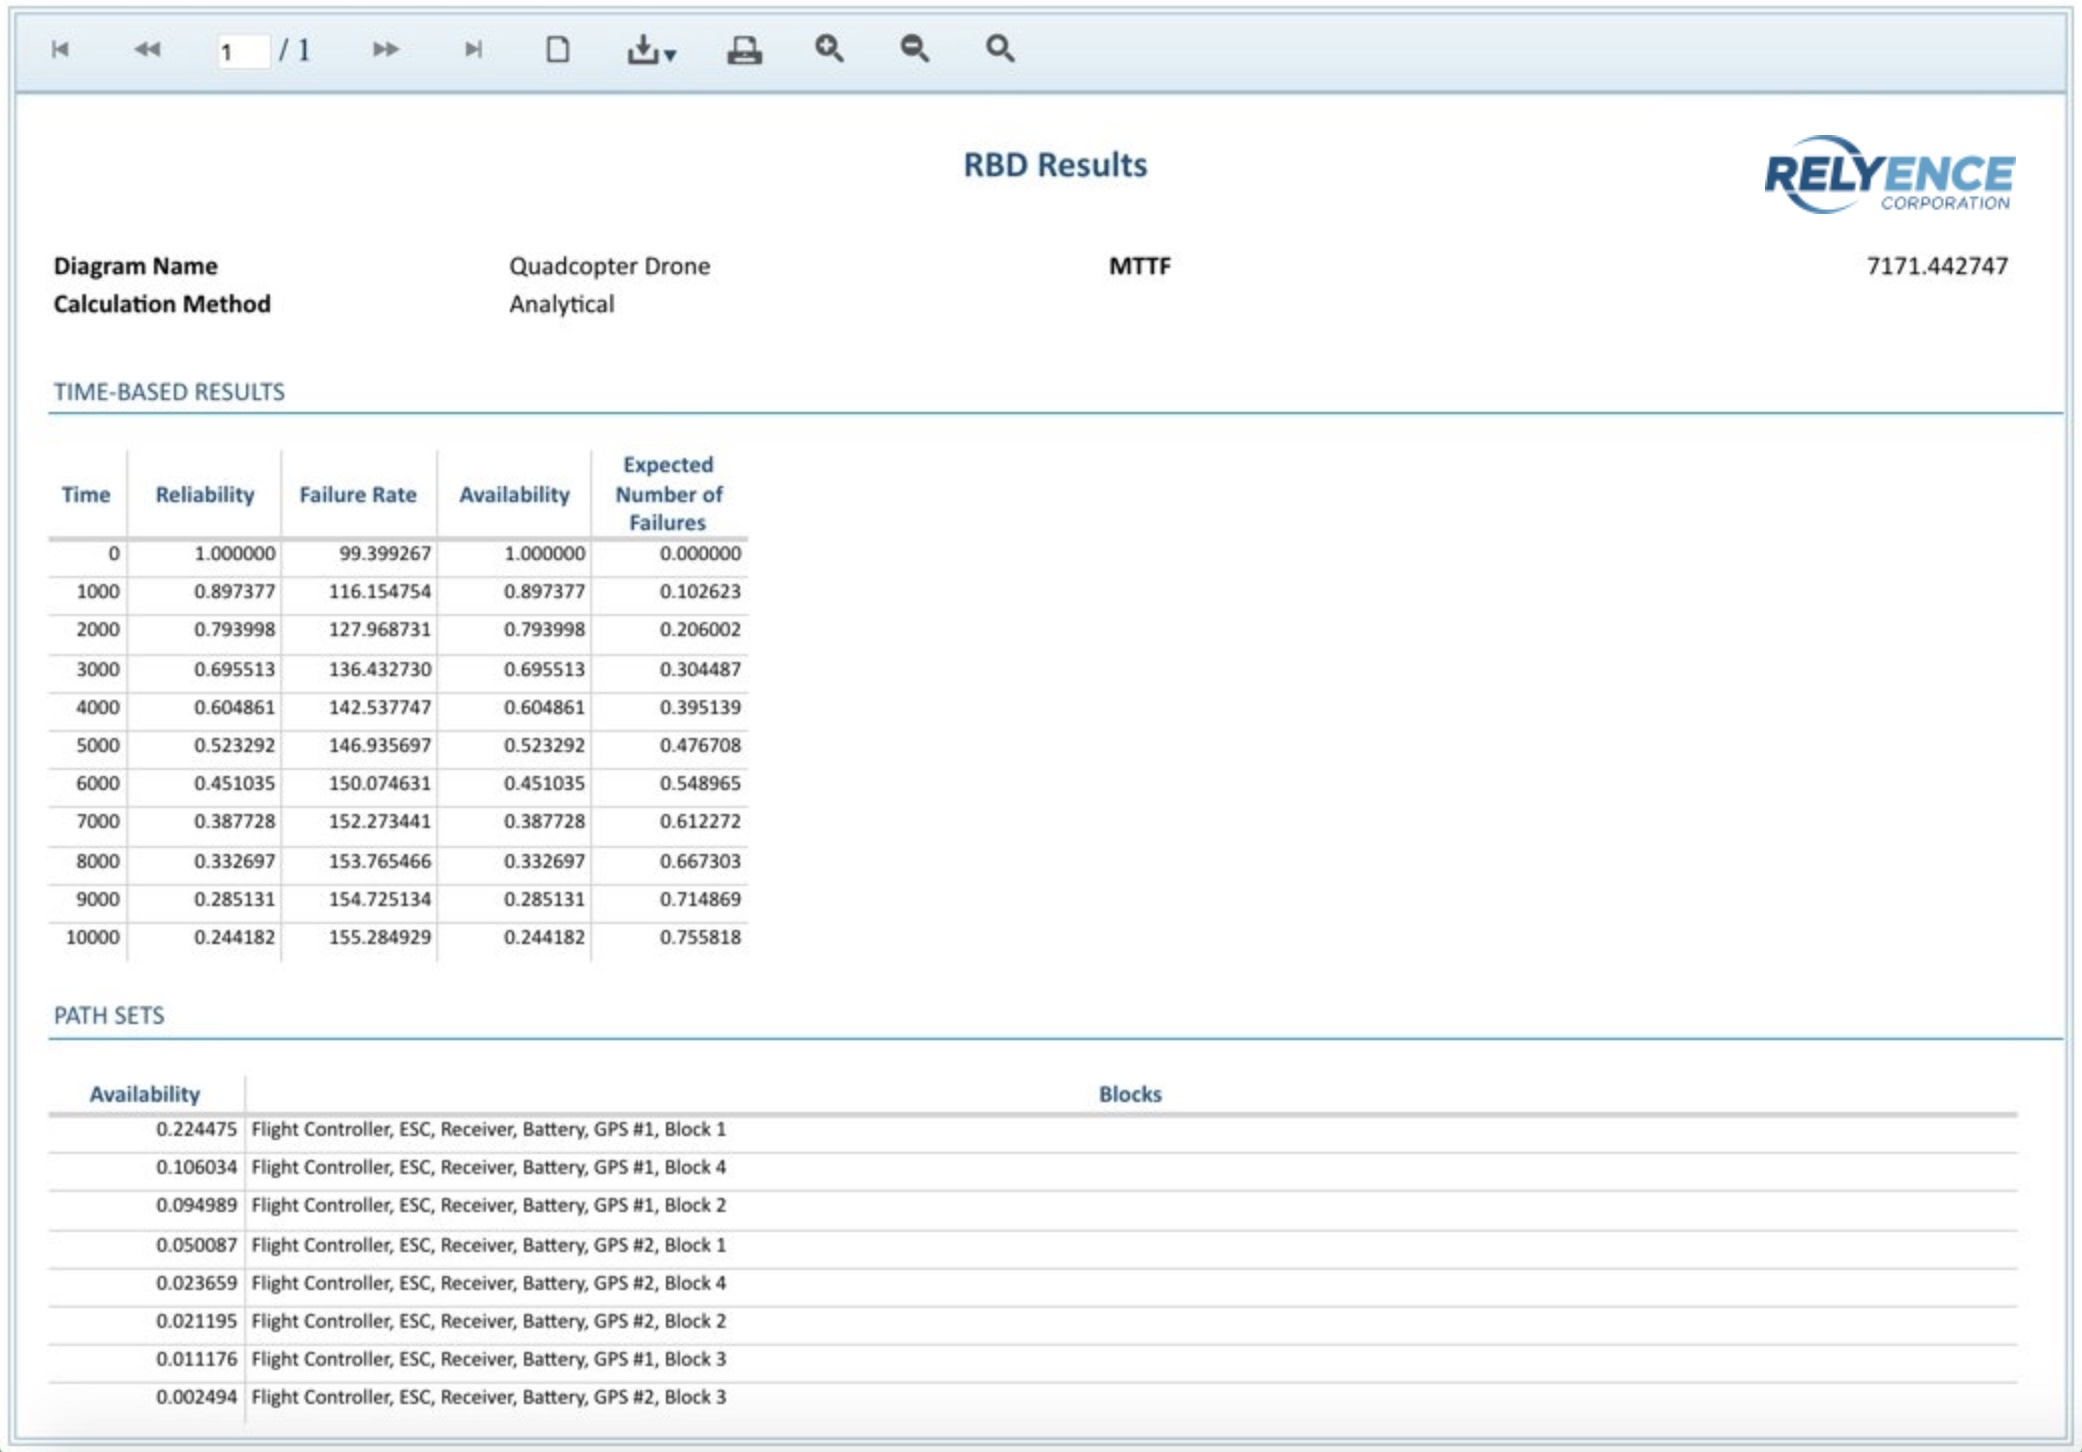
Relyence RBD calculates all your most critical metrics for evaluating system performance: reliability, unreliability, availability, mean unavailability, total downtime, failure frequency, path sets, and more. The Relyence RBD calculation engine encompasses a diagram analyzer to determine the most efficient computational methods, and a mathematical engine to perform quick and accurate calculations using both exact and simulation analyses.
Metrics
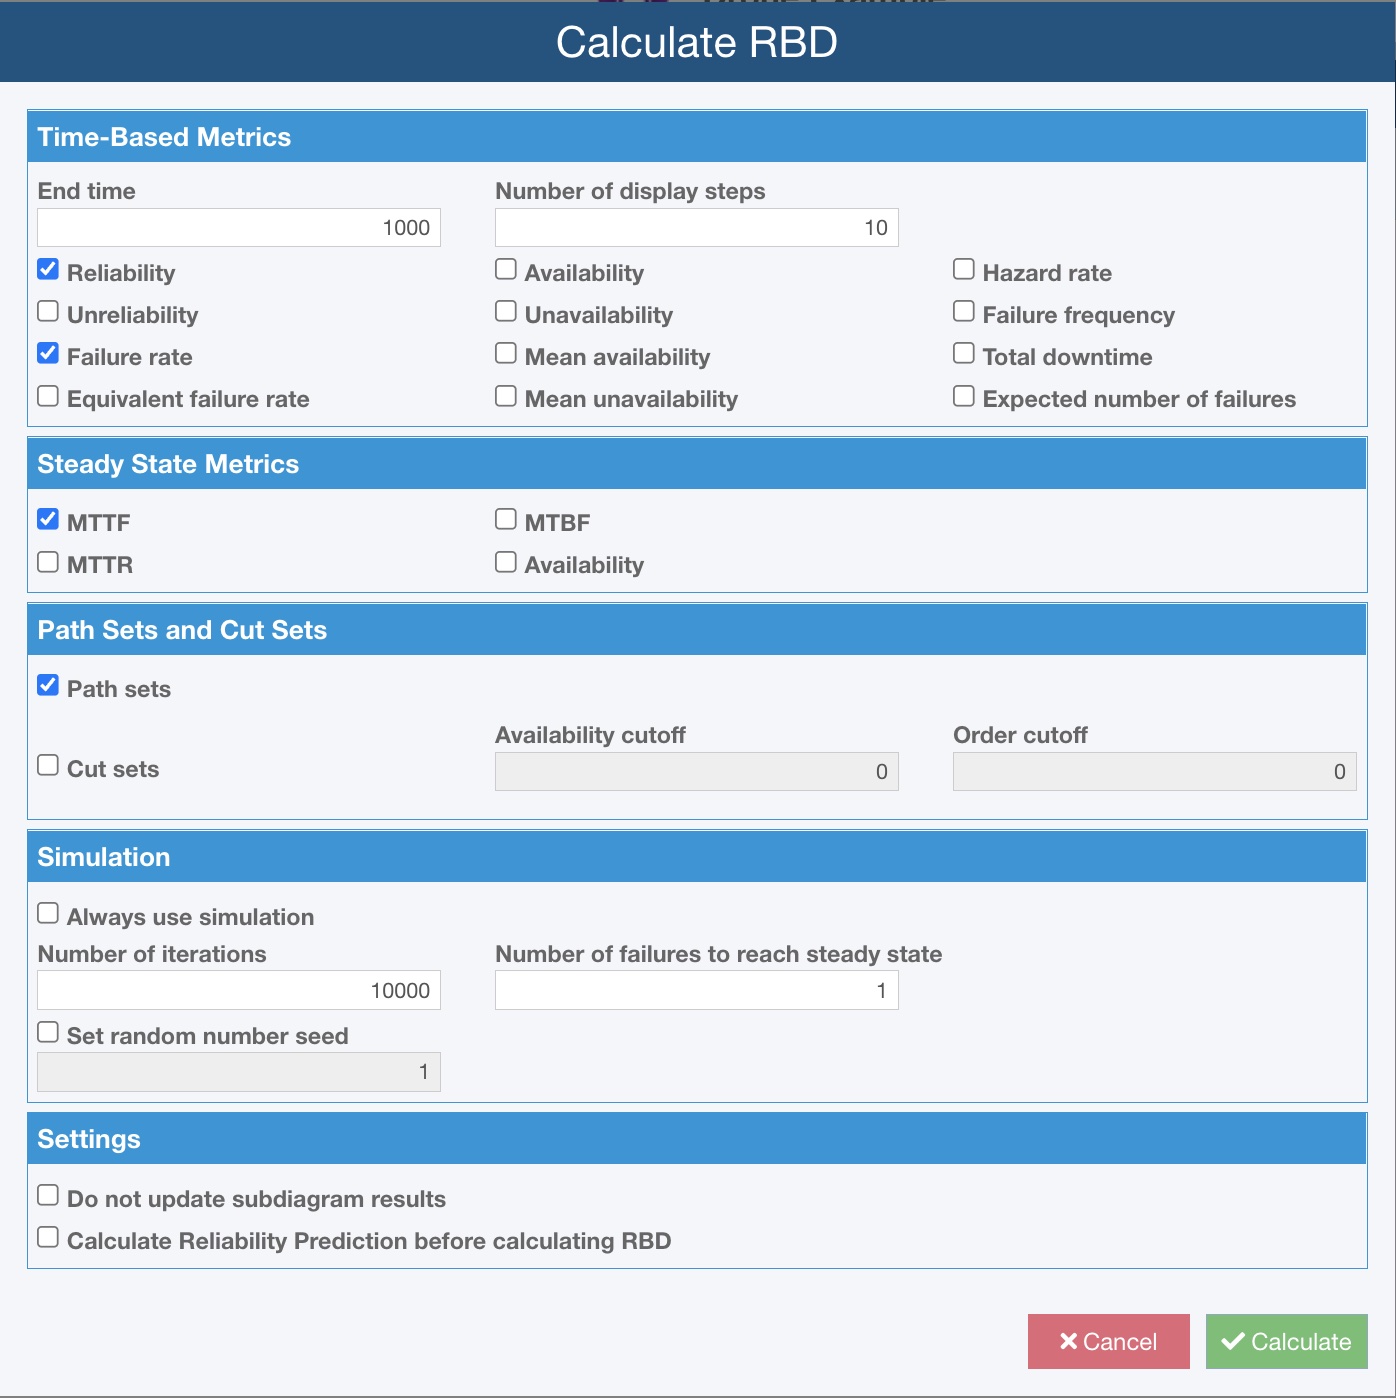
Relyence RBD calculates an array of reliability and availability metrics, any and all of which can be optionally enabled according to your needs. Available Relyence RBD metrics include:
- Reliability
- Failure rate
- Availability
- Mean availability
- Hazard rate
- Total downtime
- Unreliability
- Equivalent failure rate
- Unavailability
- Mean unavailability
- Failure frequency
- Expected number of failures
- Steady-state MTTF
- Steady-state MTTR
- Steady-state MTBF
- Steady-state Availability
RBD Plots
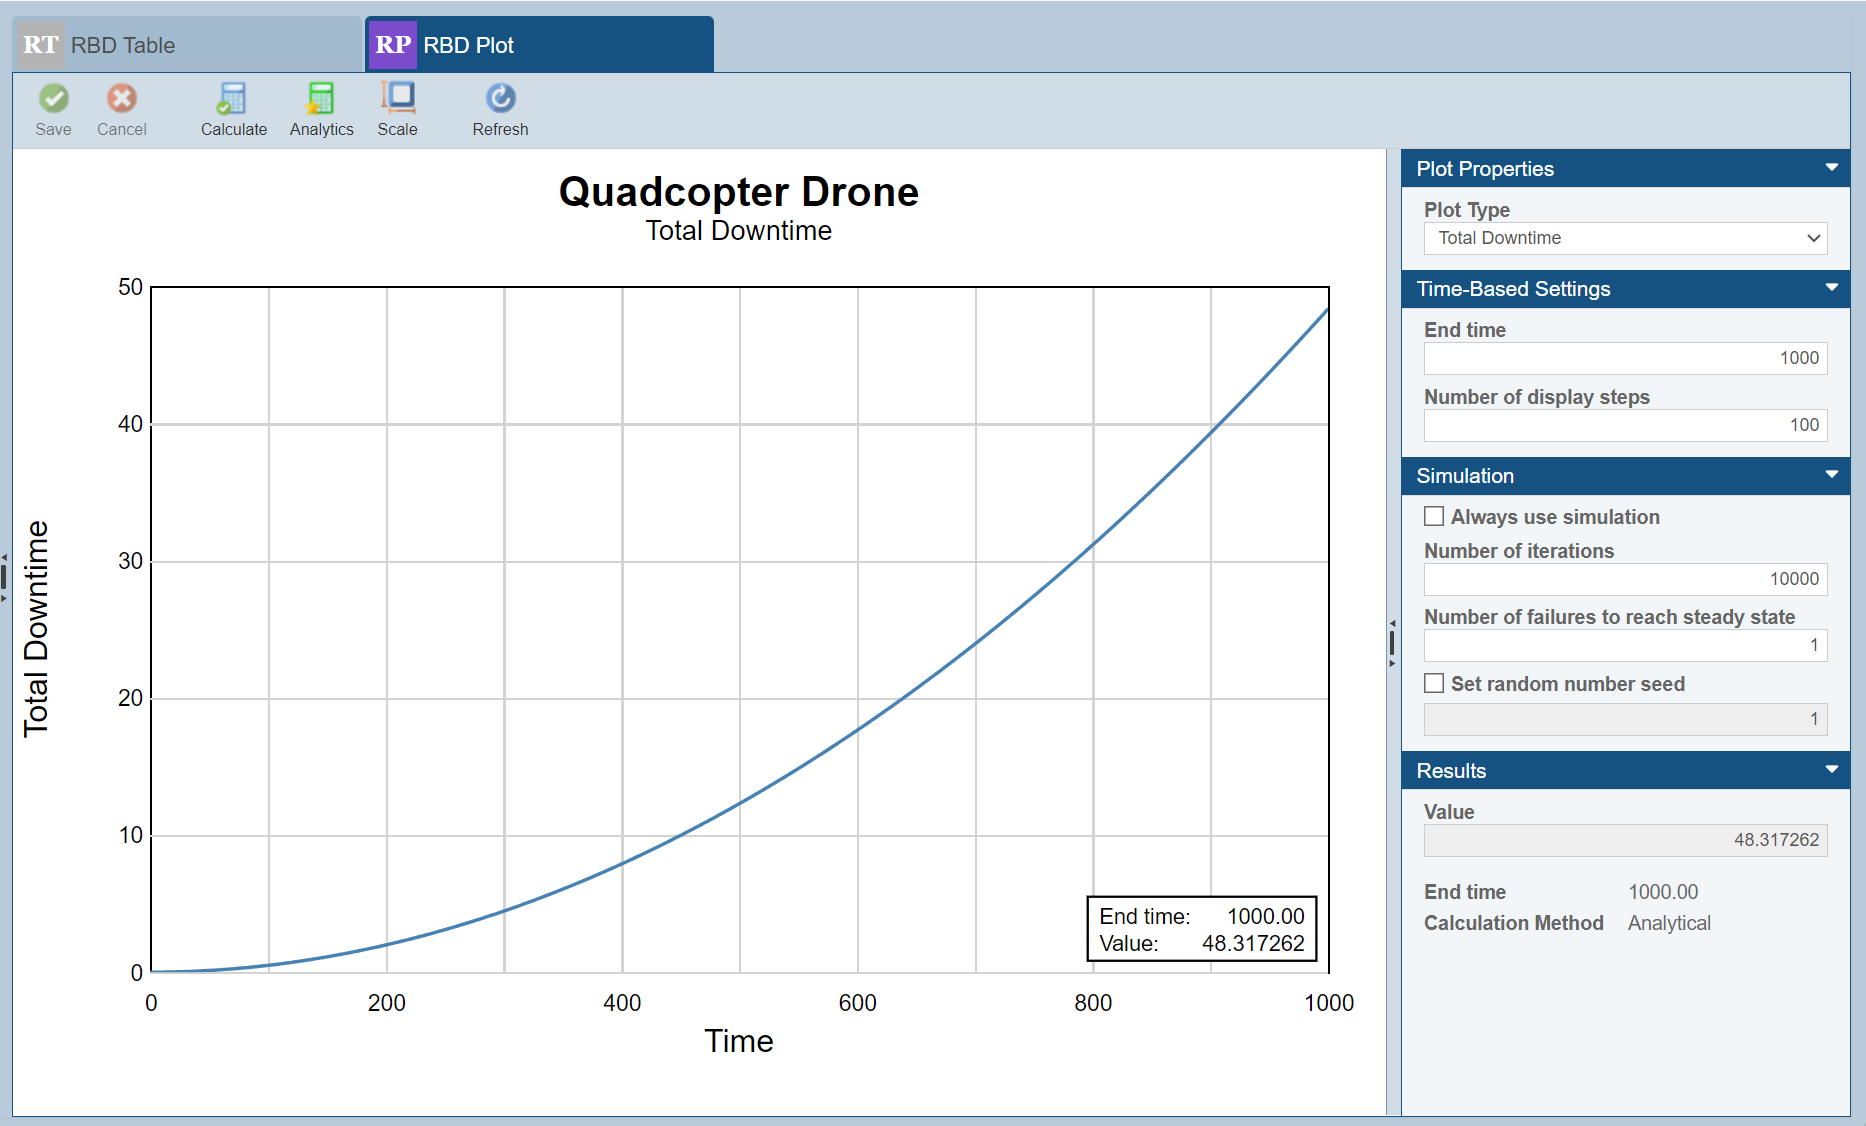
RBD plots provide an impactful visual approach for assessing system performance metrics over time. Select from several different plot types to view a graph of time-based metrics:
- Availability vs Time
- Total Downtime
- Failure Rate vs Time
- Hazard Rate
- Number of Failures vs Time
- PDF (Probability Density Function) Plot
- Reliability vs Time
- Unavailability vs Time
- Unreliability vs Time
Additionally, the useful Simulation Convergence plot helps to determine the optimal iteration count that should be used in order to achieve accurate results for an RBD simulation calculation.
Analytical and Simulation Methods
Depending on the complexity and layout of your RBD, and the selection of metrics to compute, the Relyence RBD calculation engine determines the optimal approach for calculation by analyzing your diagram. The Relyence RBD calculation engine includes both the ability to perform analytical, or exact, calculations and employ its Monte Carlo simulation engine if needed. You can optionally choose to always perform simulation analysis if you prefer. Calculation preferences also allow you to set the number of iterations to perform when using simulation, the number of failures required to reach steady state, and set the random number generator seed.
Analytics Calculator
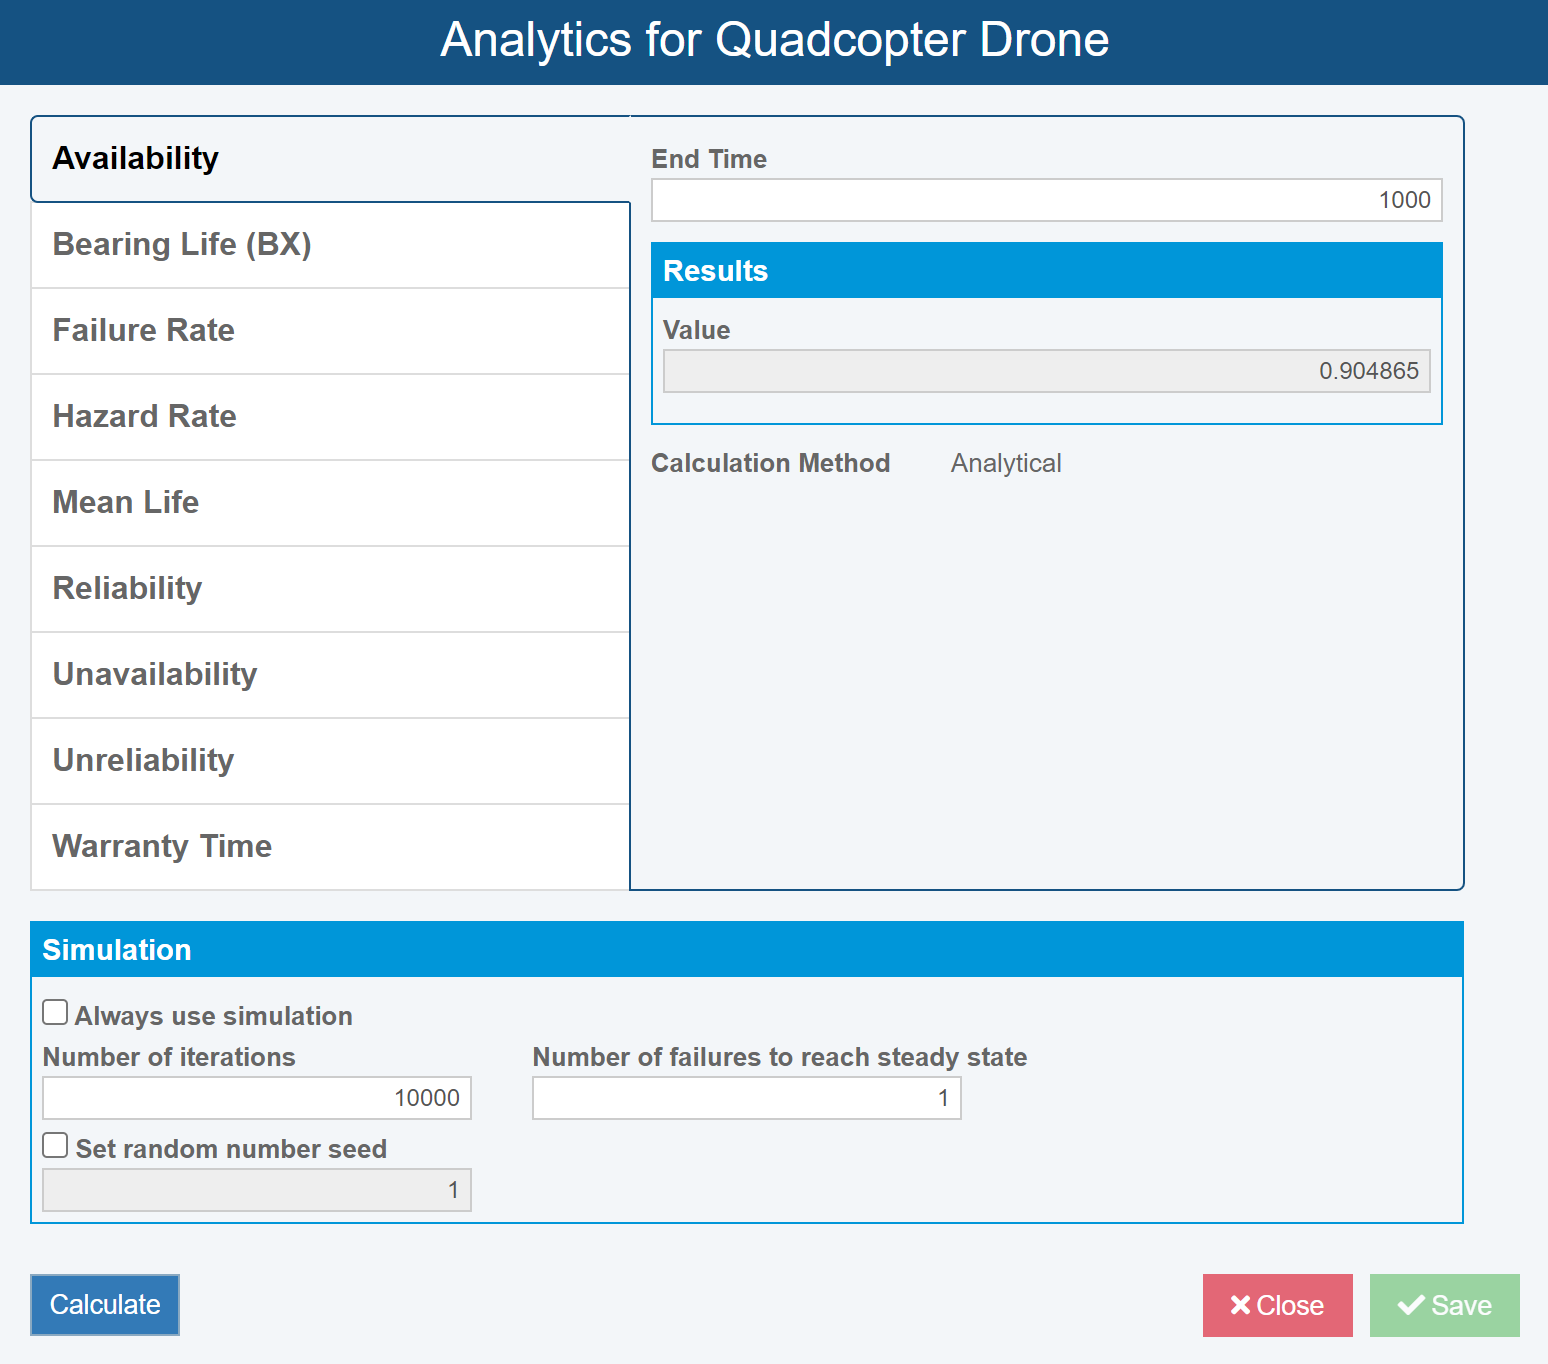
The Relyence RBD Analytics Calculator can be used to calculate various point-based RBD metrics. Metrics available for calculation include Availability, Bearing Life (used to calculate B10 Life), Failure Rate, Mean Life, Reliability, Warranty Time, and more.
Relyence RBD’s smart calculation engine will calculate the metrics using analytical methods, Monte Carlo simulation techniques, or a combination of the two. In addition, the Analytics calculator allows analysts to choose to always use simulation if desired.
Path Sets
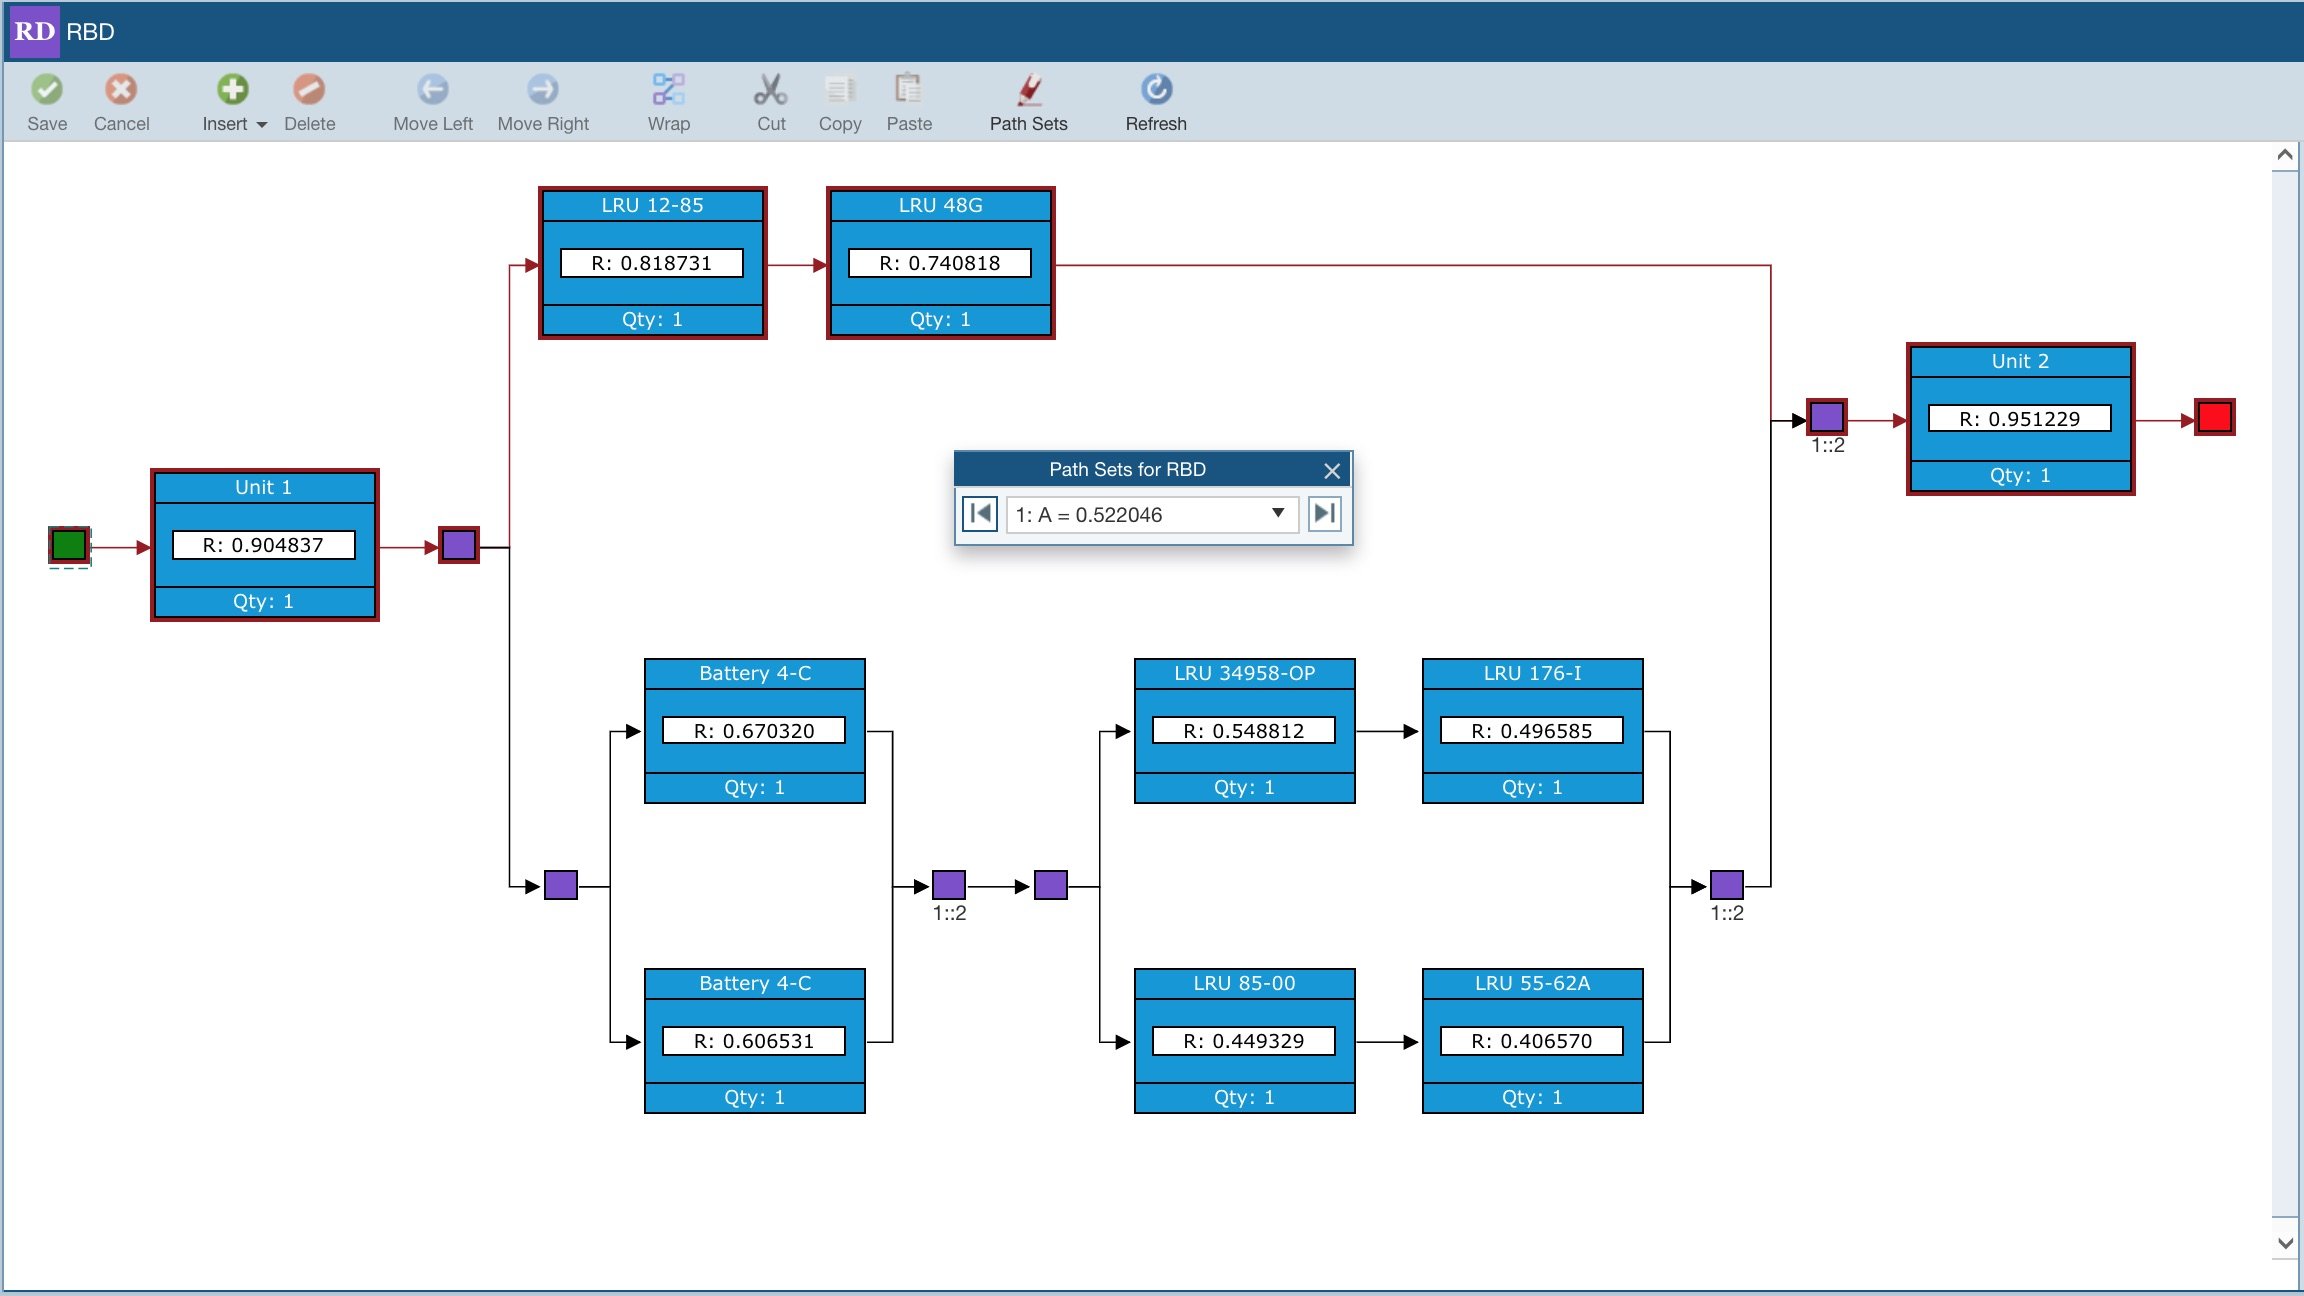
Relyence RBD includes the ability to evaluate the Path Sets of your diagram. Path sets are the pathways through your diagram that result in a successful route from start node through to end node. Path sets are useful for evaluating the overall reliability of your system, areas where improvement may be necessary, and areas where redundancy may be helpful.
Cut Sets
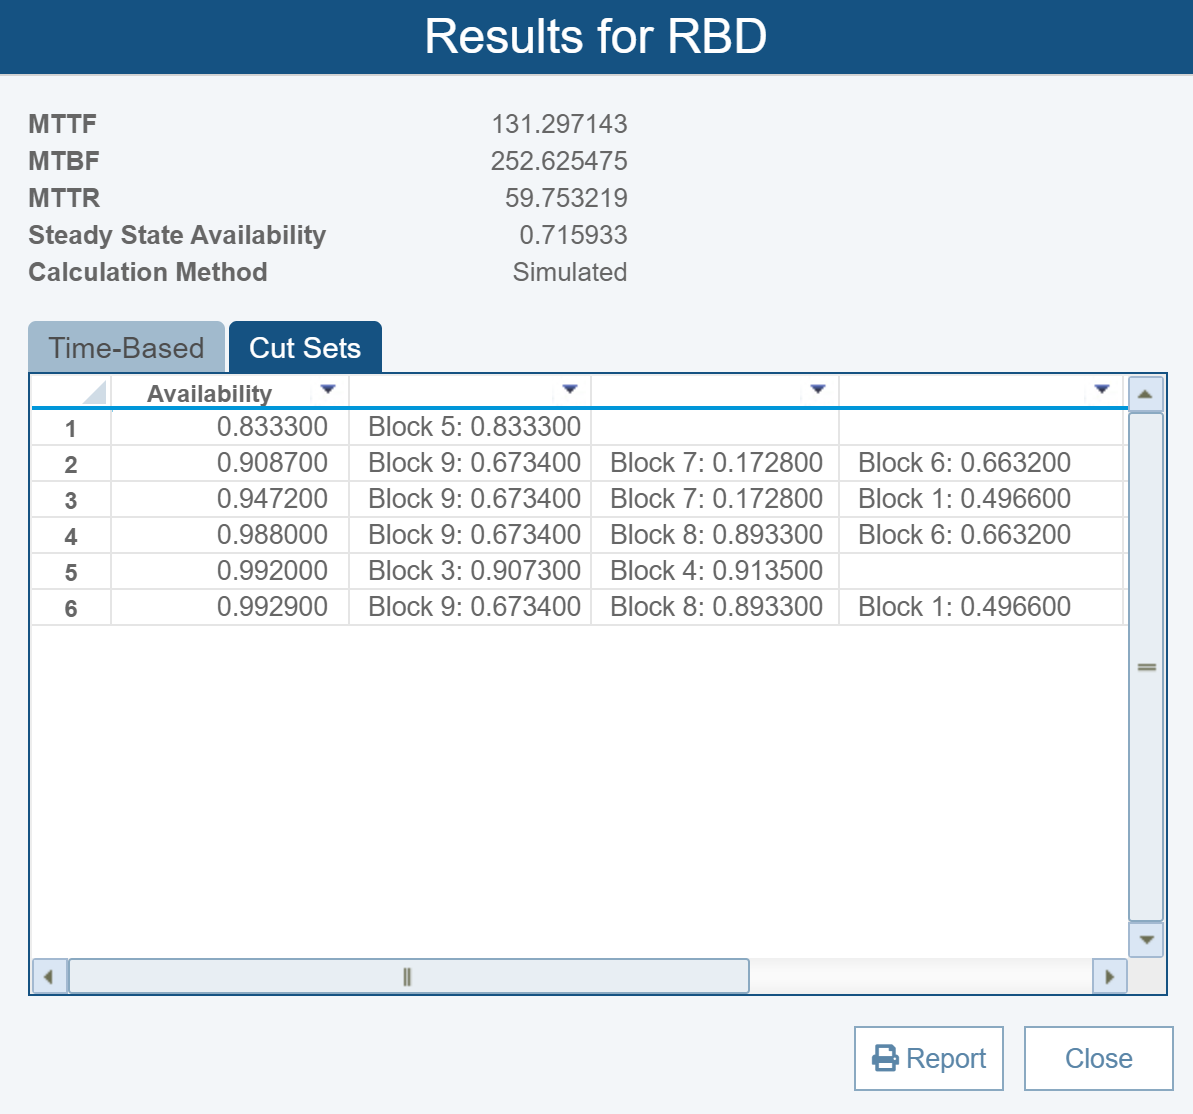
A Cut Set is a group of system components that, upon failure, lead to an overall top-level system failure. Cut Sets can be calculated in Relyence RBD. Results from cut set calculations include the individual block names that make up each cut set with their availability, as well as the overall availability of the cut set. Cut set analysis provides insight into the most critical components in your system and helps target product improvement efforts.
Path Set and Cut Set Highlighting
The Relyence RBD Path Set and Cut Set Highlighter tools sequentially highlight each path or cut set on your RBDs. You can also select a specific path or cut set to highlight on the diagram. This handy tool enables you to easily view and sequence through the appropriate groups of components on your RBD.
While most metrics of your RBDs are presented in a table format, this graphical format of results is uniquely intuitive and helpful in providing a visual view of system performance. The ability to view component data directly on the graphical views offers a meaningful and advantageous way to interpret your path and cut set data. Because the information is much more easily explained and, therefore, understood, these visual views are very helpful for presentations or when working in a collaborative team environment.
Optimal Replacement Time Calculator
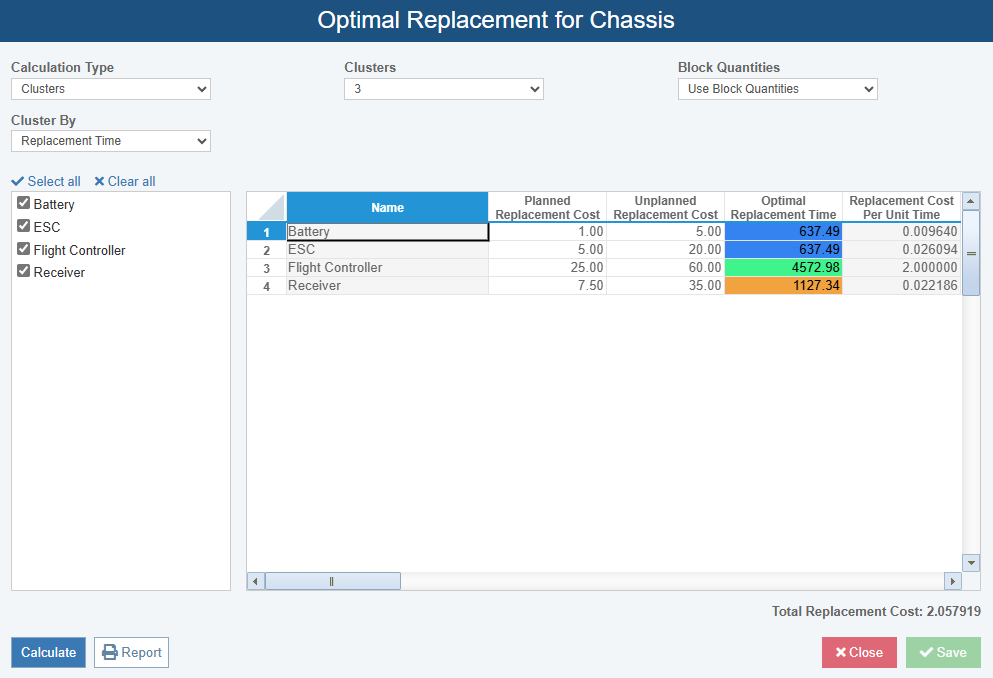
For some components in your system, you may find that performing preventive (i.e. before component failure) replacement is a more cost-effective approach compared to corrective (i.e. replacing a component after it fails) replacement. For these situations, Relyence RBD includes an Optimal Replacement tool that can be used to help determine the best time for planned component replacement.
Based on the component’s failure characteristics and associated planned and unplanned replacement costs, the Optimal Replacement tool calculates the optimal replacement interval. Optimal Replacement times can be calculated uniquely for each component or blocks can be grouped together to share the same replacement time, allowing you to balance cost and practicality.
Allocation Analysis
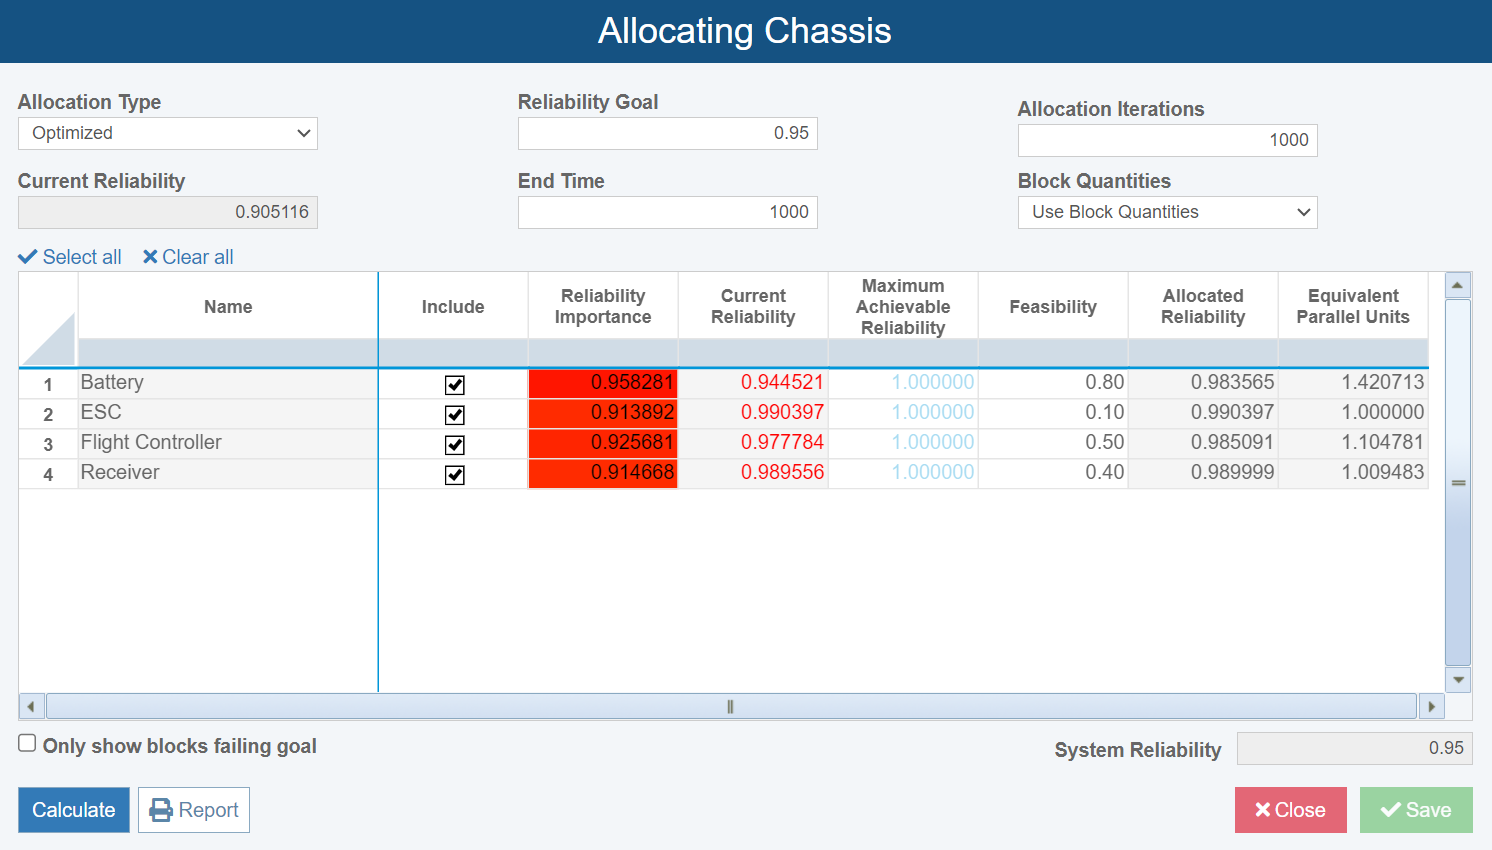
Oftentimes when a product is in the design phase, the team is required to meet an established reliability goal. Allocations in RBD allow you to determine how to effectively achieve that reliability goal by distributing—or allocating—that goal across the system’s components.
Relyence RBD includes four Allocation Types to choose from: Equal Apportionment, Balanced Apportionment, Weighted, and Optimized. Depending on the Allocation Type, calculation settings for Maximum Achievable Reliability, Feasibility, and Block Quantities allow you to tailor the Allocation analysis to your needs and ensure accurate results are obtained.

