SYSTEM MODELING
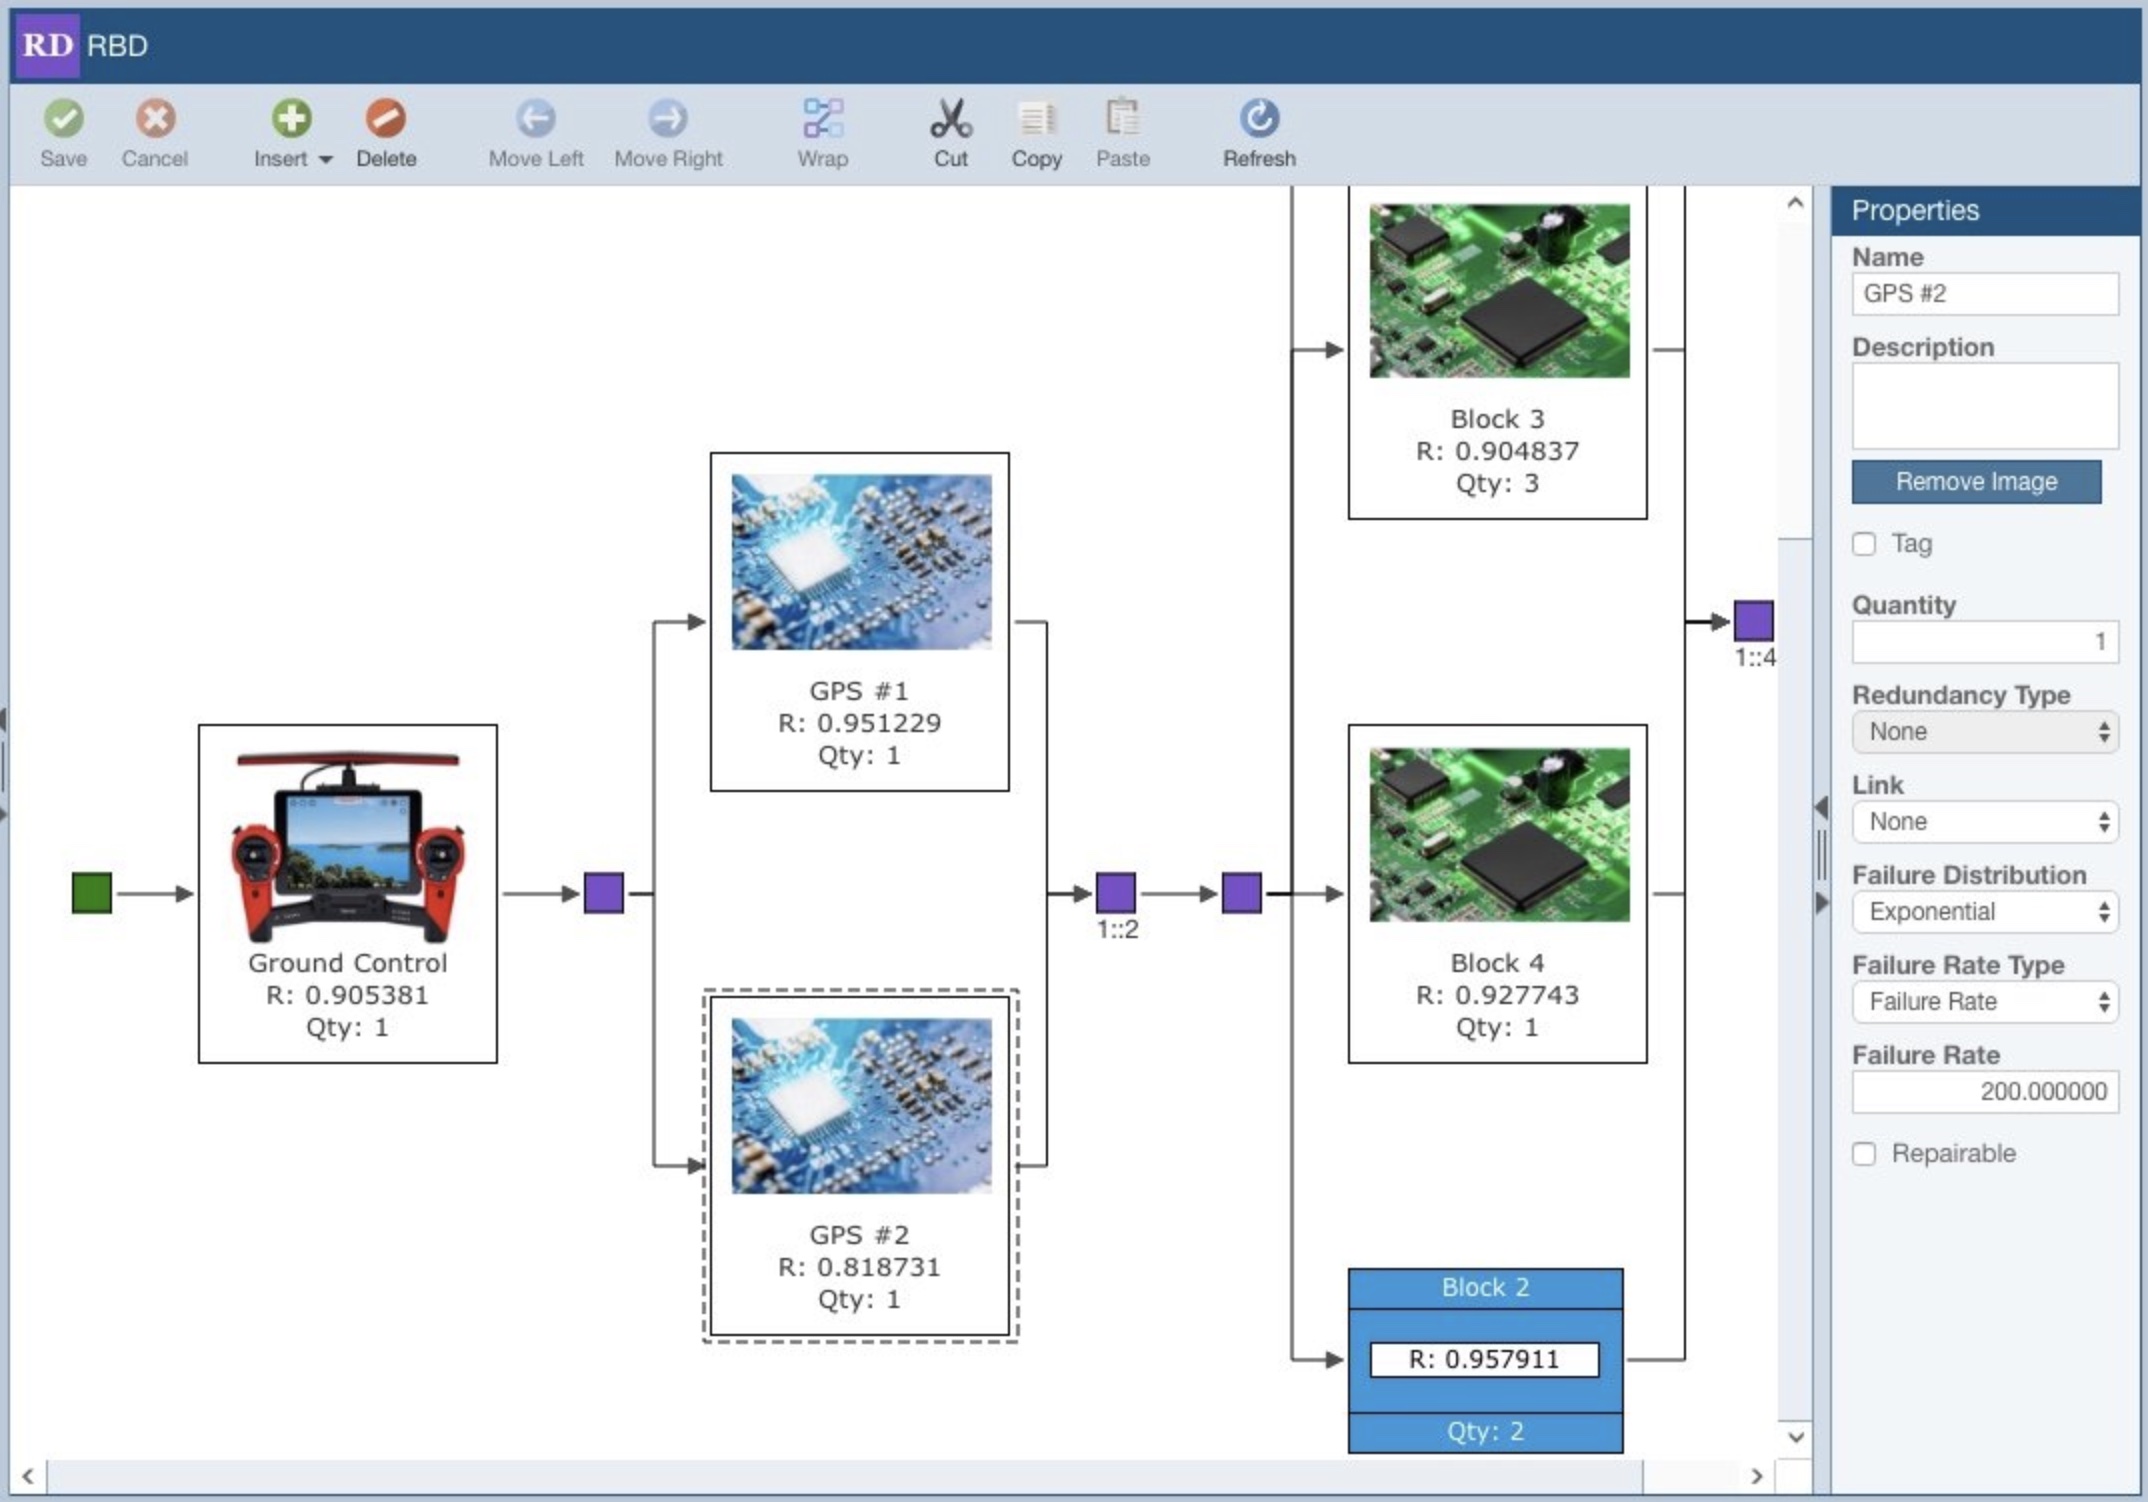
Relyence RBD provides a fast, easy-to-use interface that allows you to quickly create your reliability block diagrams. The smart layout capability intelligently connects and organizes your diagram for optimal review. Modeling complex systems, especially those incorporating redundancy, has never been easier.
Visual Diagrammer
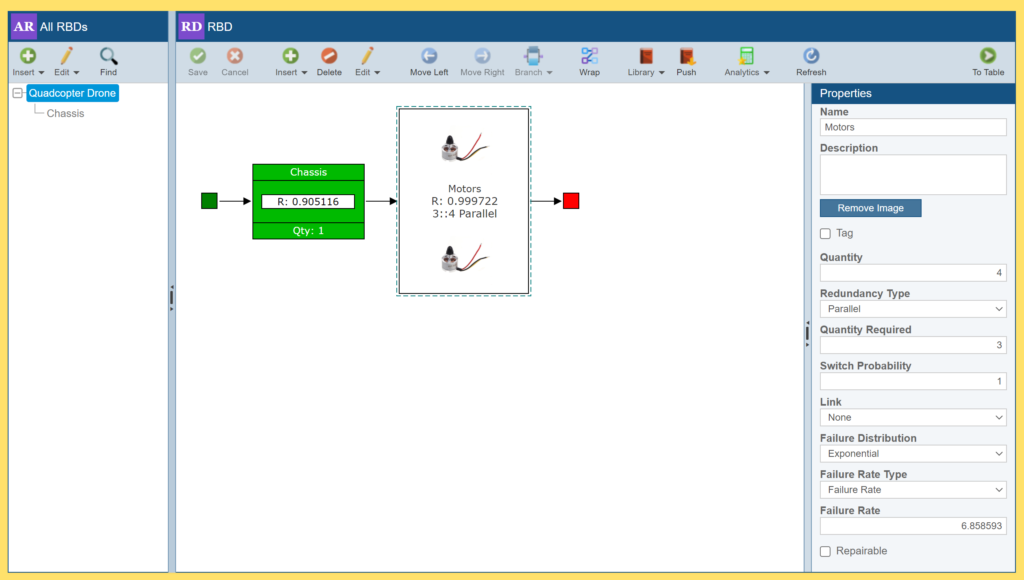
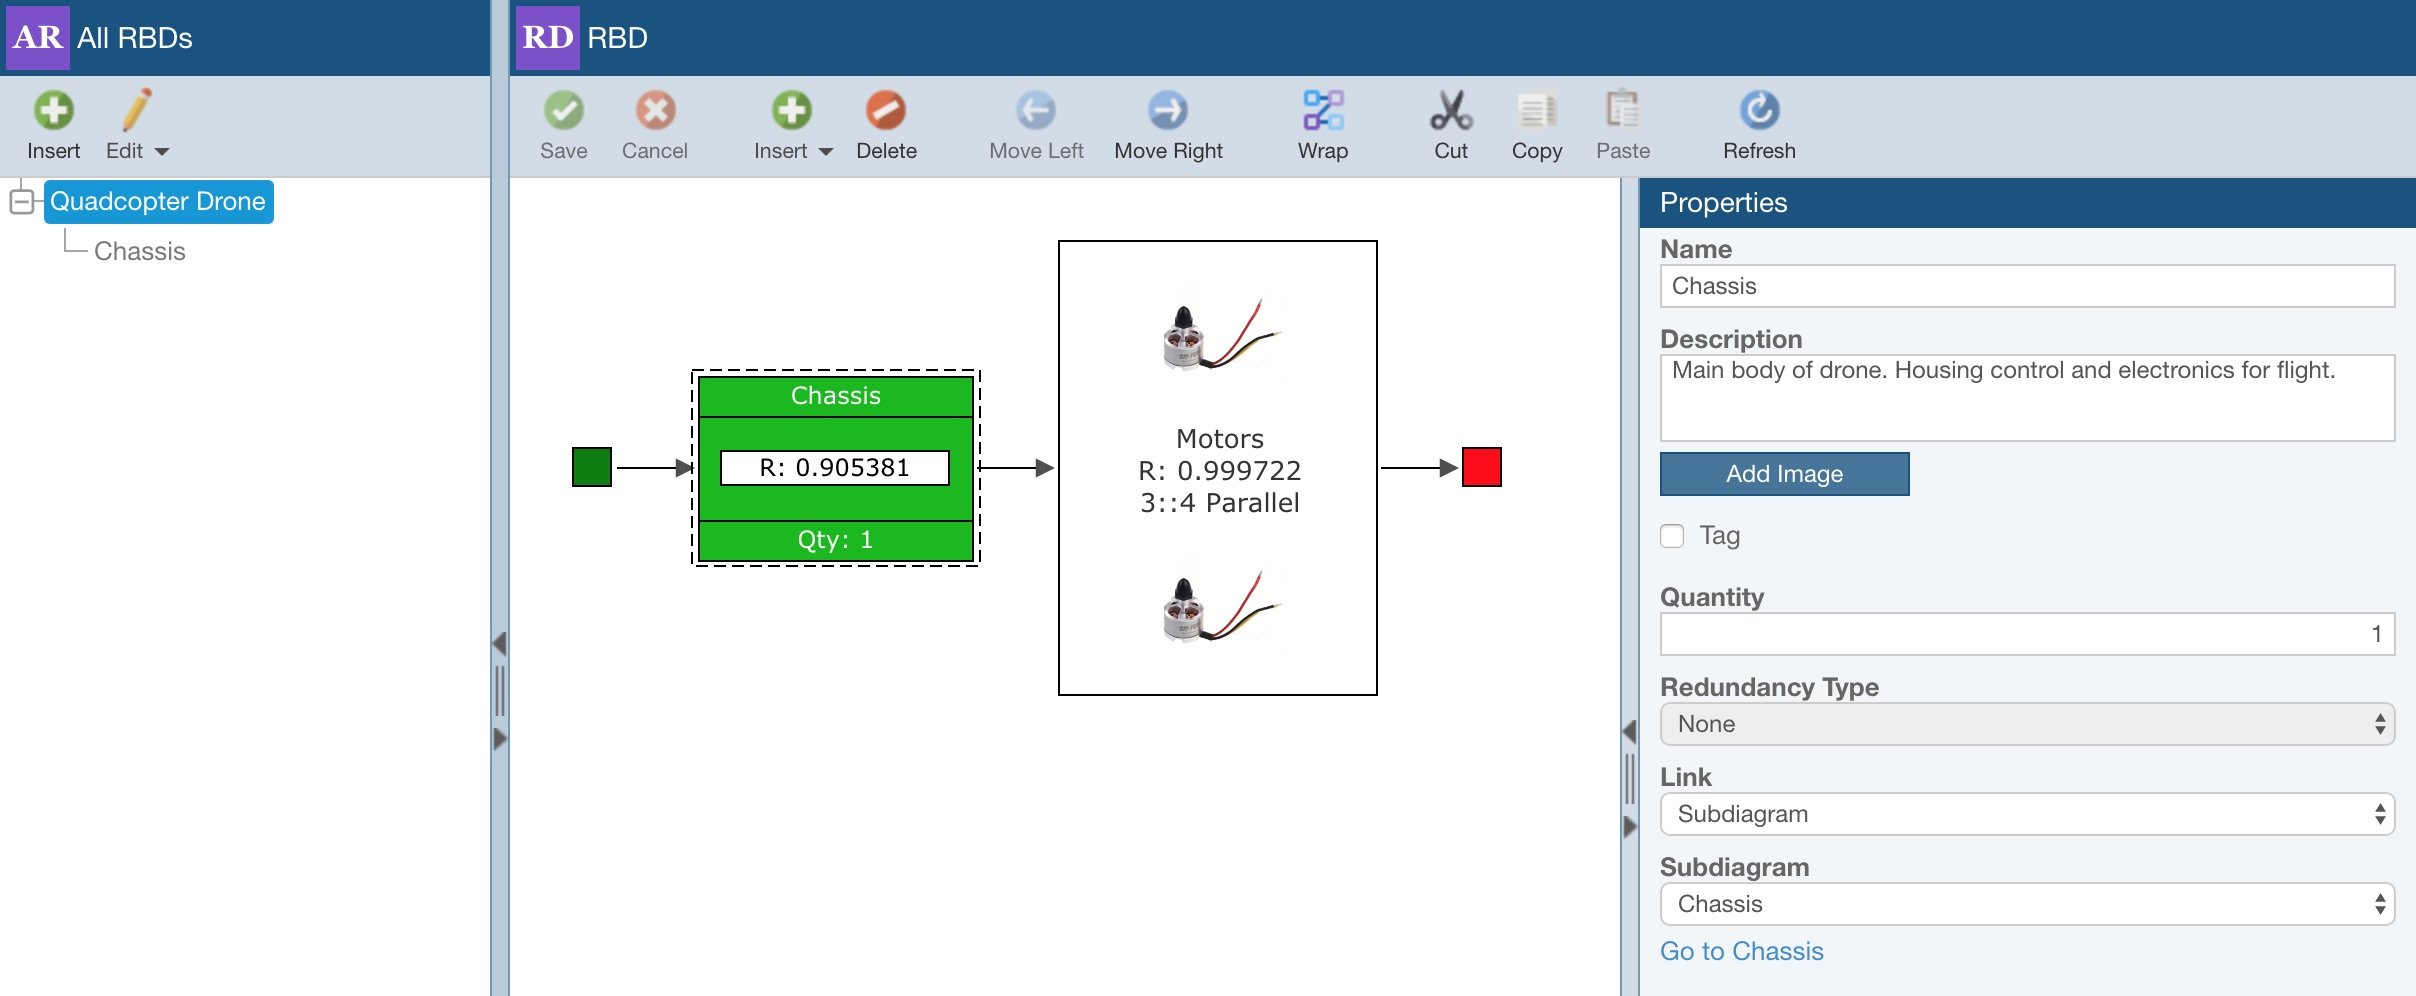
Relyence RBD provides a fast, easy-to-use interface that allows you to quickly create your reliability block diagrams. You simply insert blocks, assign images as desired, and intuitively arrange the blocks as you choose. You can quickly create series, hot standby, cold standby, and parallel configurations. And you can create subdiagrams to organize large analyses, grouping the blocks as you desire, and navigating to them quickly using the tree structure that Relyence RBD maintains for you.
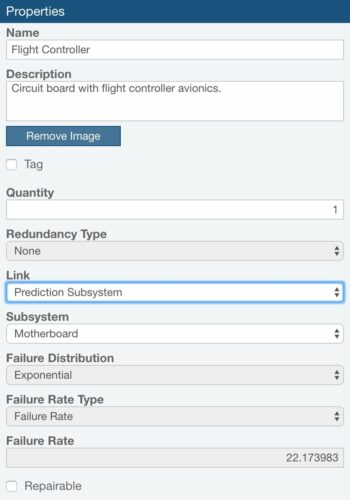
A simple click on a block shows the failure and repair properties for that block – allowing you to define the redundancy type, failure distribution, repair distribution, if applicable, and the properties of the distribution such as failure rate, mean and standard deviation, or MTTR. Adding blocks and setting properties is a snap with Relyence RBD.
Redundancy
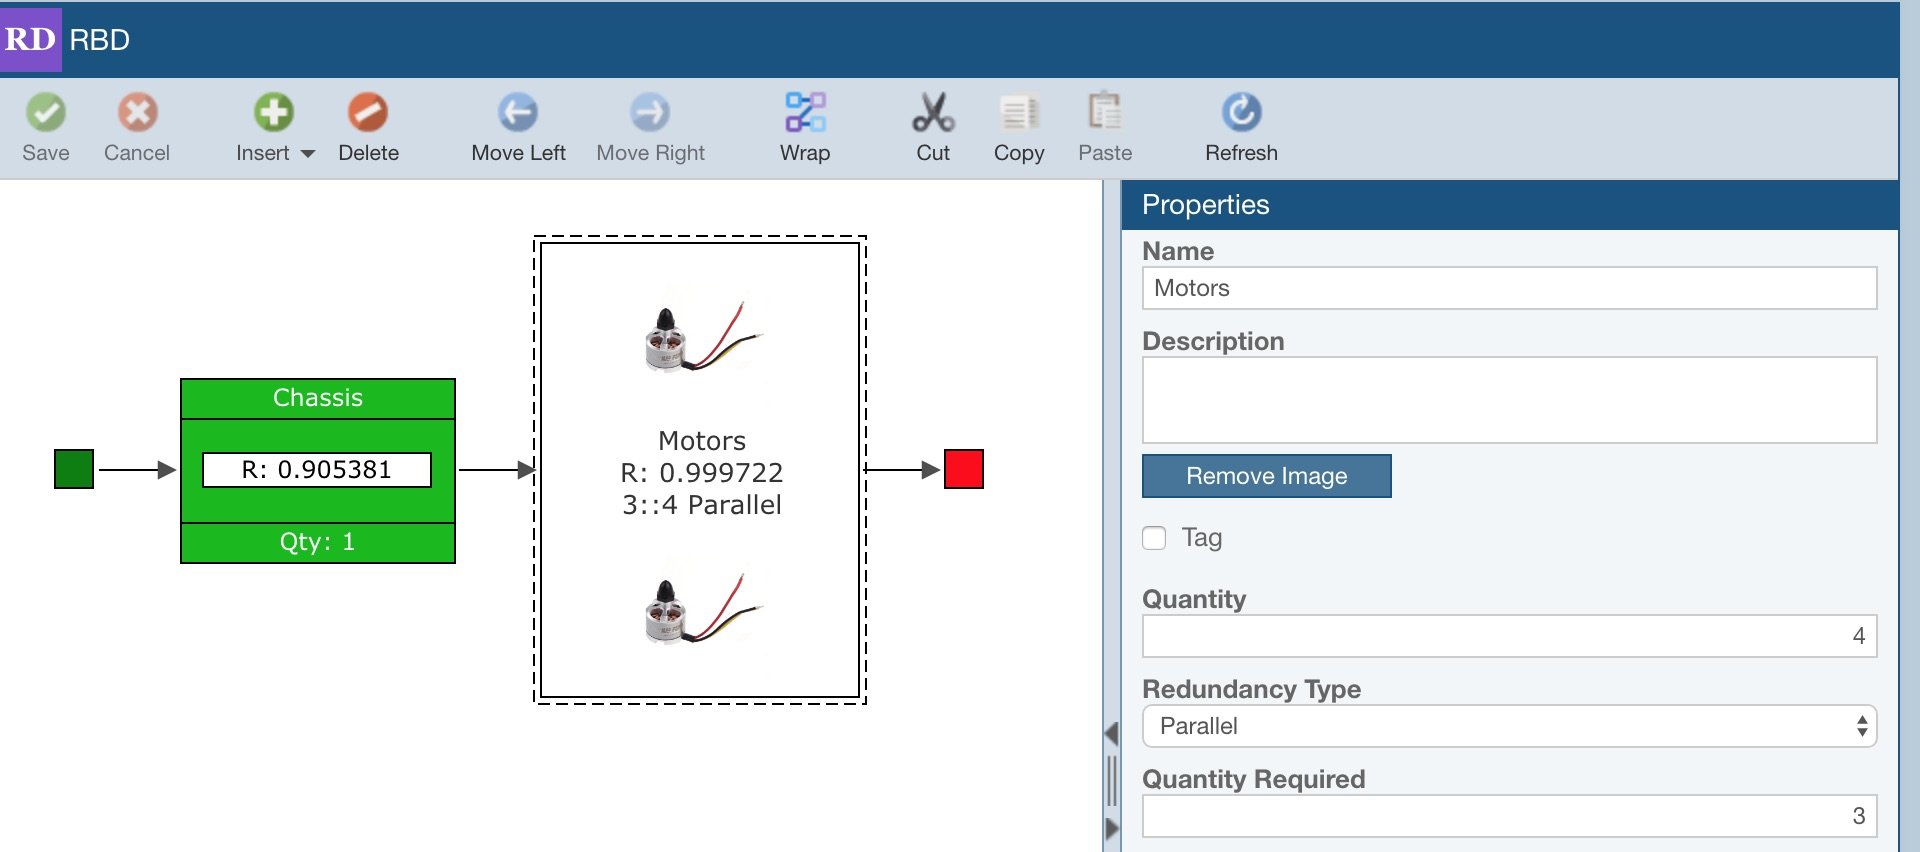
Designing with redundancy is an important technique when system uptime is crucial. Building redundancy into your system in critical areas means that when a component or pathway fails, a backup takes over to keep your system operational. Many industries where high availability is of utmost importance rely on redundancy to meet their uptime goals. With Relyence RBD, you can model both redundant components and redundant branches (redundant paths in your system model). Relyence RBD includes support for the various types of redundancy:
- Series: A series configuration has no redundancy, and all components are connected in series and all must be operating for the system to successfully function.
- Cold Standby: Cold standby is defined as a number of identical components in a redundant configuration. Oftentimes, noted as k-out-of-n redundancy, indicating that a quantity (k) out of a total of (n) components are required for the system to operate. In cold standby, the standby components are not active and will not fail. Once a failure occurs, the standby unit is activated so that the system remains operational.
- Hot Standby: Similar to cold standby, however, the standby units are turned on. When a unit fails, the standby unit takes over.
- Warm Standby: Warm Standby configurations incorporate backup components that are partially active and ready to take over in case the primary component fails. In certain cases, they can provide faster recovery than cold standby while offering lower overall failure rates than hot standby.
- Parallel: In a parallel redundant configuration, all components are operating all the time and only the designated quantity is required to keep the system operating.
For redundant components, you can also include information on the Switch Probability and Switch Delay. Switch Probability is the likelihood the switchover to use a redundant component in order to prevent system failure will be successful. Switch Delay is the time it will take to switch over to a backup unit upon failure.
Failure and Repair Distributions
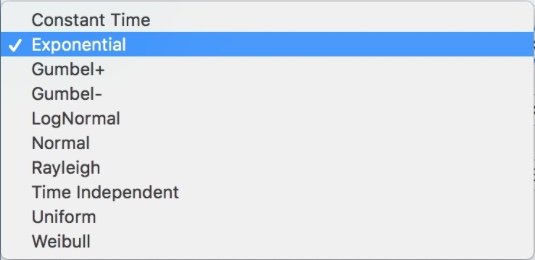
An important part of modeling your system is defining the failure and repair profiles of your components. In RBD analysis this is accomplished by selecting the appropriate distribution that matches your components’ characteristics. In Relyence RBD, you can select from various failure and repair distributions when modeling the failure and repair characteristics of your components. The distributions supported include:
- Constant Time
- Exponential
- Gumbel+
- Gumbel-
- Lognormal
- Normal
- Rayleigh
- Time Independent
- Uniform
- Weibull
RBD Libraries
Well-organized RBDs are key to effectively performing your system performance analyses. For this reason, Relyence RBD supports Libraries for efficient management of your RBD data.
Relyence RBD Libraries allow you to save entire diagrams and all included data for reusability and to ensure data consistency. For example, you may have a certain group of components or subassembly that is used across several products in the same configuration. RBD Libraries allow you to easily save and reuse this component group wherever it is required.
Additionally, RBD Libraries support saving a collection of individual blocks for reuse anywhere in Relyence RBD. Depending on the complexity and level of detail required in your analysis, RBD blocks can represent anything from individual passive components to subassemblies purchased from third party vendors.
By providing a data bank of reusable diagrams and blocks, RBD Libraries allow efficient construction of your RBDs and ensure accuracy and consistency in your system modeling analyses.
Plots
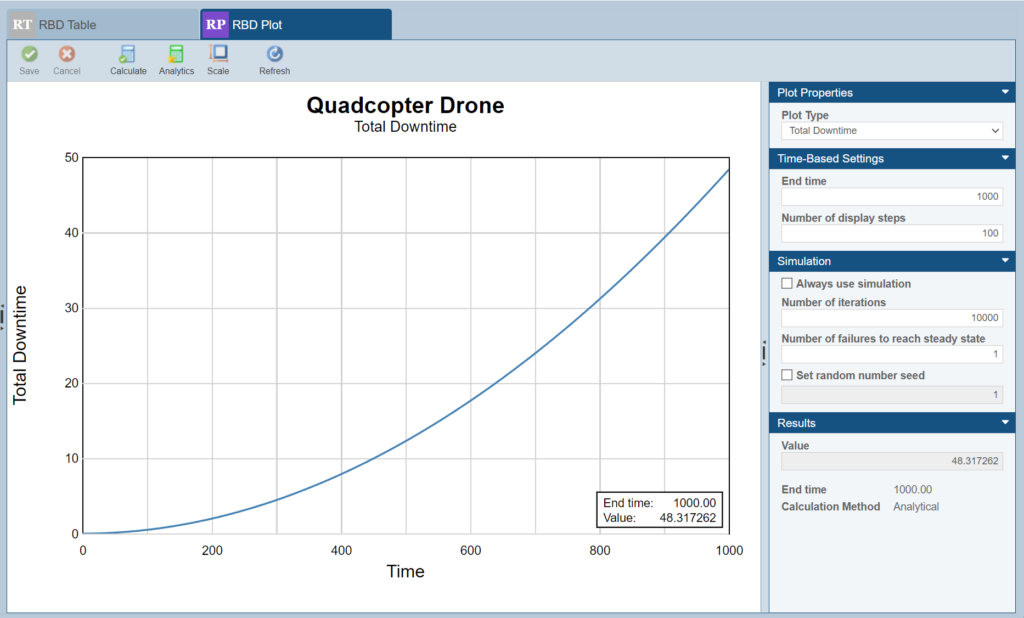
RBD plots allow you to easily visualize your system performance over time by providing a visual representation of various time-based metrics. Multiple time-based metric results can be visualized with plot types such as Availability vs Time, Reliability vs Time, Failure Rate vs Time, Total Downtime and more.
RBD Plots can be helpful in various system improvement efforts, such as:
- Taking action to analyze and then mitigate or prevent upticks in downtime using the Total Downtime plot.
- Ensuring that your repairable system never drops below a given Availability target using the Availability vs. Time plot.
- Targeting system improvement efforts to address early-life failures or wear-out revealed on the Failure Rate vs. Time plot.
Relyence RBD also offers a Simulation Convergence plot, which represents the precision of your simulated results at a given iteration count. This plot can be used to estimate the optimal iteration count that should be used in order to achieve accurate results for an RBD simulation calculation.
Integration with Other Relyence Analysis Tools
Using the Relyence platform enables you to use your RBD analyses together with your other Relyence analysis tools for a useful and efficient combo pack.
When defining the distributions of your system components, Relyence RBD enables you to link directly to the failure data from Relyence Reliability Prediction. You can link any component in your RBD to a component in your reliability prediction analysis. When performing calculations, the failure information from Relyence Reliability Prediction will be used in your RBD.
Additionally, you can link your RBD components directly to Weibull Data Sets from Relyence Weibull. In this case, the distribution information from the selected Weibull Data Set will be used when performing RBD calculations.
To make things easy when viewing your RBD, components that are linked to another data source and that do not have an image attached are shown in green.
Subdiagrams
Relyence RBD enables you to efficiently model complex diagrams by supporting subdiagram linking. Subdiagram links allow you to link a single block in one RBD to another diagram. For example, if you are modeling a system which is broken into three distinct units, you can construct an independent RBD for each of the three units, and then create a fourth diagram with three components linking to each independent RBD. Subdiagram linking is also advantageous for reuse – if you have an assembly used in more than one place, you only need to construct a single RBD then link to it as required. Linking to subdiagrams is done on the block properties pane in Relyence RBD, by simply selecting the subdiagram you want to link to from the autogenerated list of choices. Any blocks in your diagram that are linked are shown in green so they are easy for you to recognize.

