WHAT-IF? ANALYSIS
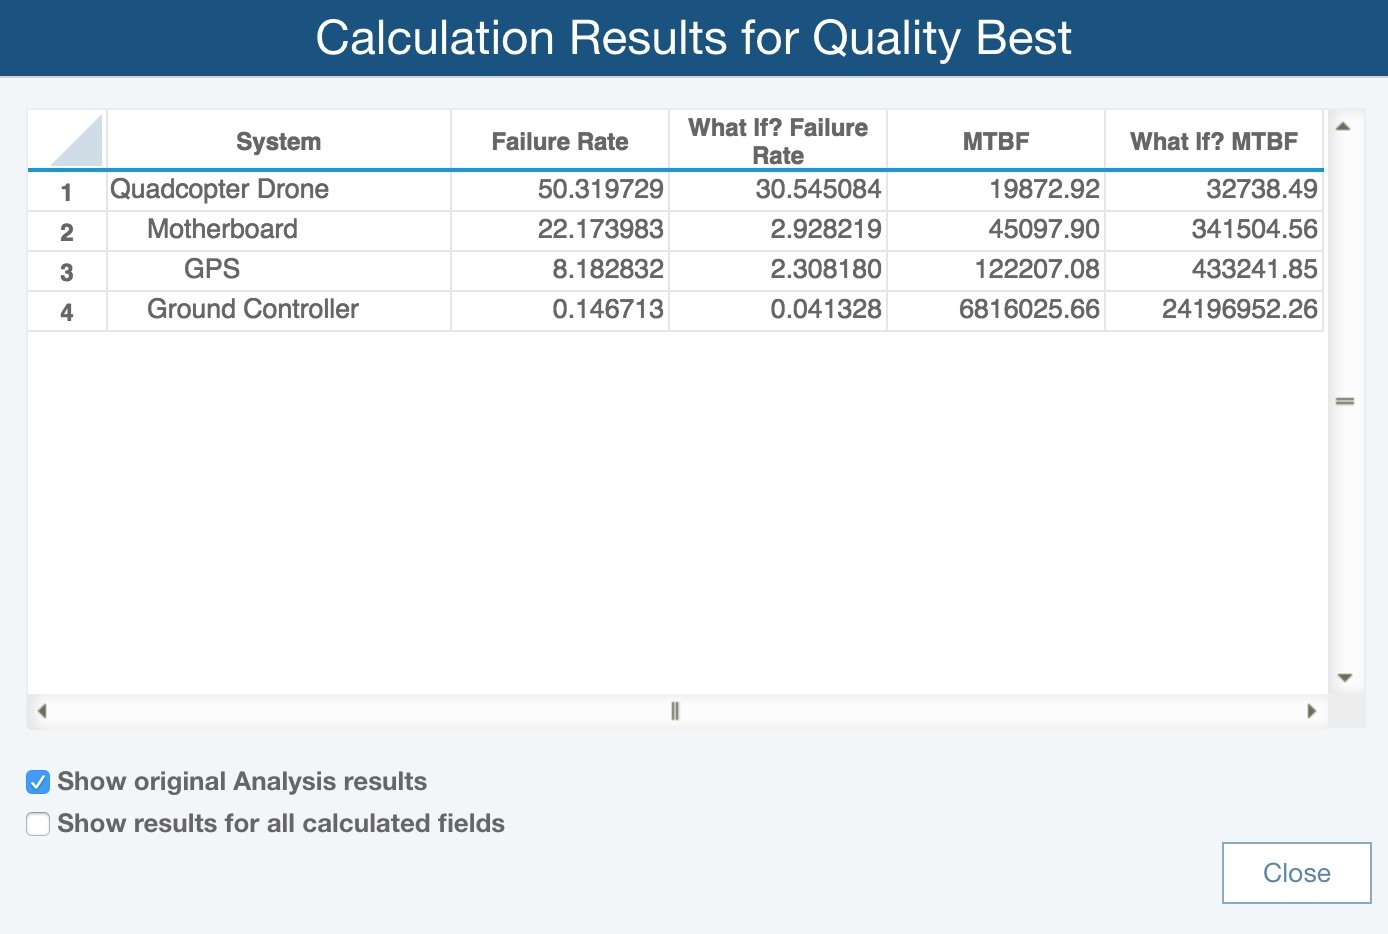
Reliability Prediction is a great tool for assessing the impact of design tradeoffs on your reliability calculations, especially in early design stages. Performing What-If? studies provides quick methods to evaluate reliability and MTBF using various design alternatives, delivering metric-based results for making critical business decisions. The ability to assess reliability using comparative results helps to ensure the oftentimes hidden costs of COPQ (cost of poor quality) are revealed.
Use What-If? Analysis to Evaluate Alternatives Based on Reliability
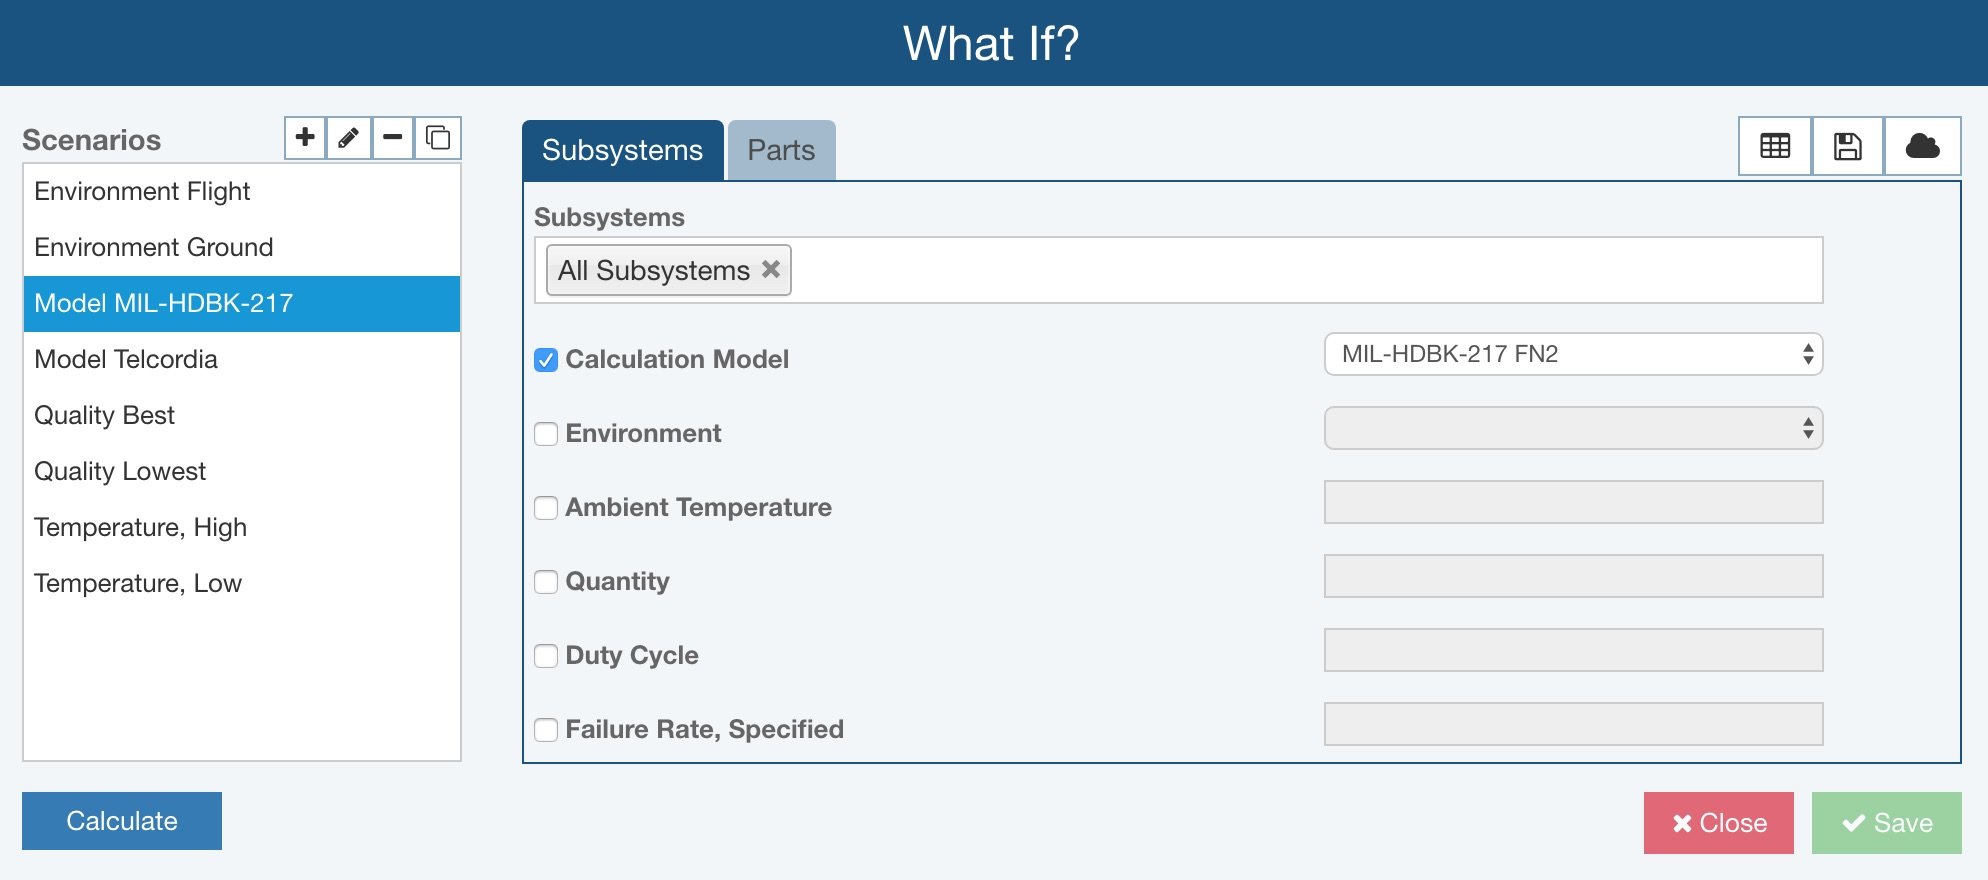
Relyence Reliability Prediction includes a streamlined What-If? MTBF (Mean Time Between Failures) calculation scenario editor for quick and easy assessment of trade-off analyses. You can create any number of trade-off studies by changing a variety of data parameters such as temperatures, environments, quality levels, duty cycles, specified failure rates, and calculation models used to calculate reliability. The changes can be optionally applied across your entire system, to specified system components, or even at the parts level. The flexible interface keeps all your What-If? MTBF calculation analyses organized and on-hand for further review and refinement at any time during the design process.
Global Changes and Impacts on Your Product MTBF
The Relyence Reliability Prediction What-If? feature can be extended to perform global changes to data in your analyses with a simple click of the mouse. For example, you calculate MTBF or failure rate and determine that by purchasing your devices at the highest available quality levels your product reliability is significantly enhanced. In this case, you may decide that this design improvement is worth the cost. Once the decision is made by your team to move forward with this change, select the appropriate scenario and simply click the Update button to incorporate those modifications into your reliability prediction analysis. You can use the What-If? feature to make global modifications to your reliability analysis and MTBF calculation in this manner at any time.
Dashboards Provide a Clear Visual Overview of MTBF
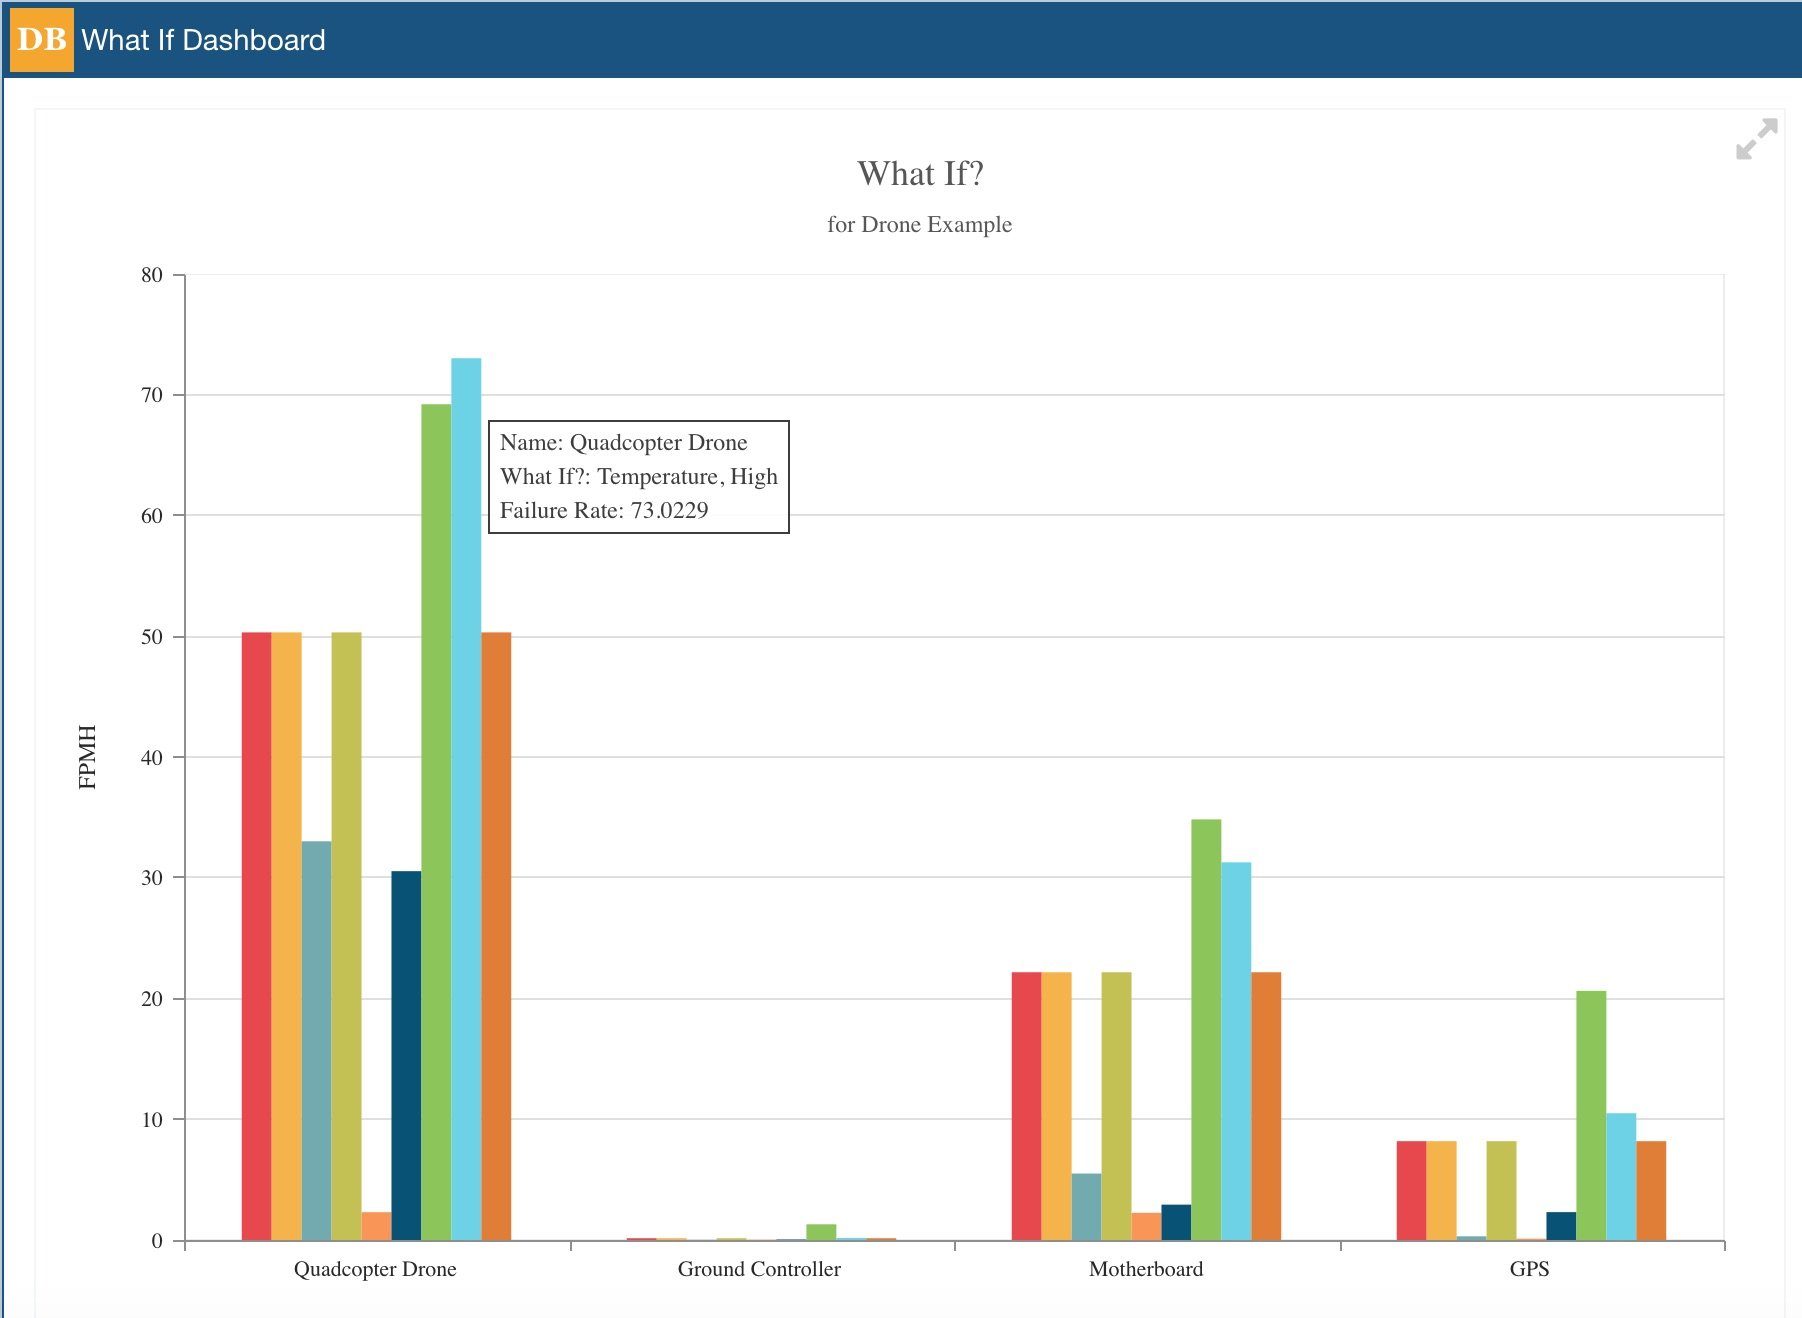
What better way to evaluate MTBF and view the various results from trade-off studies than through a visually impactful, easy-to-understand, graphical format? The Relyence Reliability Prediction Dashboard What-If? widget accomplishes that objective in a concise, easily explainable format that can be used for management review and team discussion. The What-If? widget presents your analyses in bar chart format with complete hover information for details on specific results for more in-depth reviews.


