RELIABILITY GROWTH ANALYSIS, BEST FIT, ANALYTICS CALCULATOR, AND MORE
Relyence Weibull incorporates a host of additional capabilities to provide a powerful package for performing your Weibull analyses. Reliability Growth Analysis (RGA) based on the Crow-AMSAA technique enables you to evaluate the effects of product improvements on product performance over time. Use the built-in Best Fit analyzer to mathematically determine the distribution that best fits your data set. The Analytics Calculator provides a handy way to compute a variety of important metrics based on your life data. Create output reports of both input and output data for sharing, printing, presentations, and more. Use our advanced techniques to intelligently integrate Weibull data with other analysis modules.
Reliability Growth Analysis
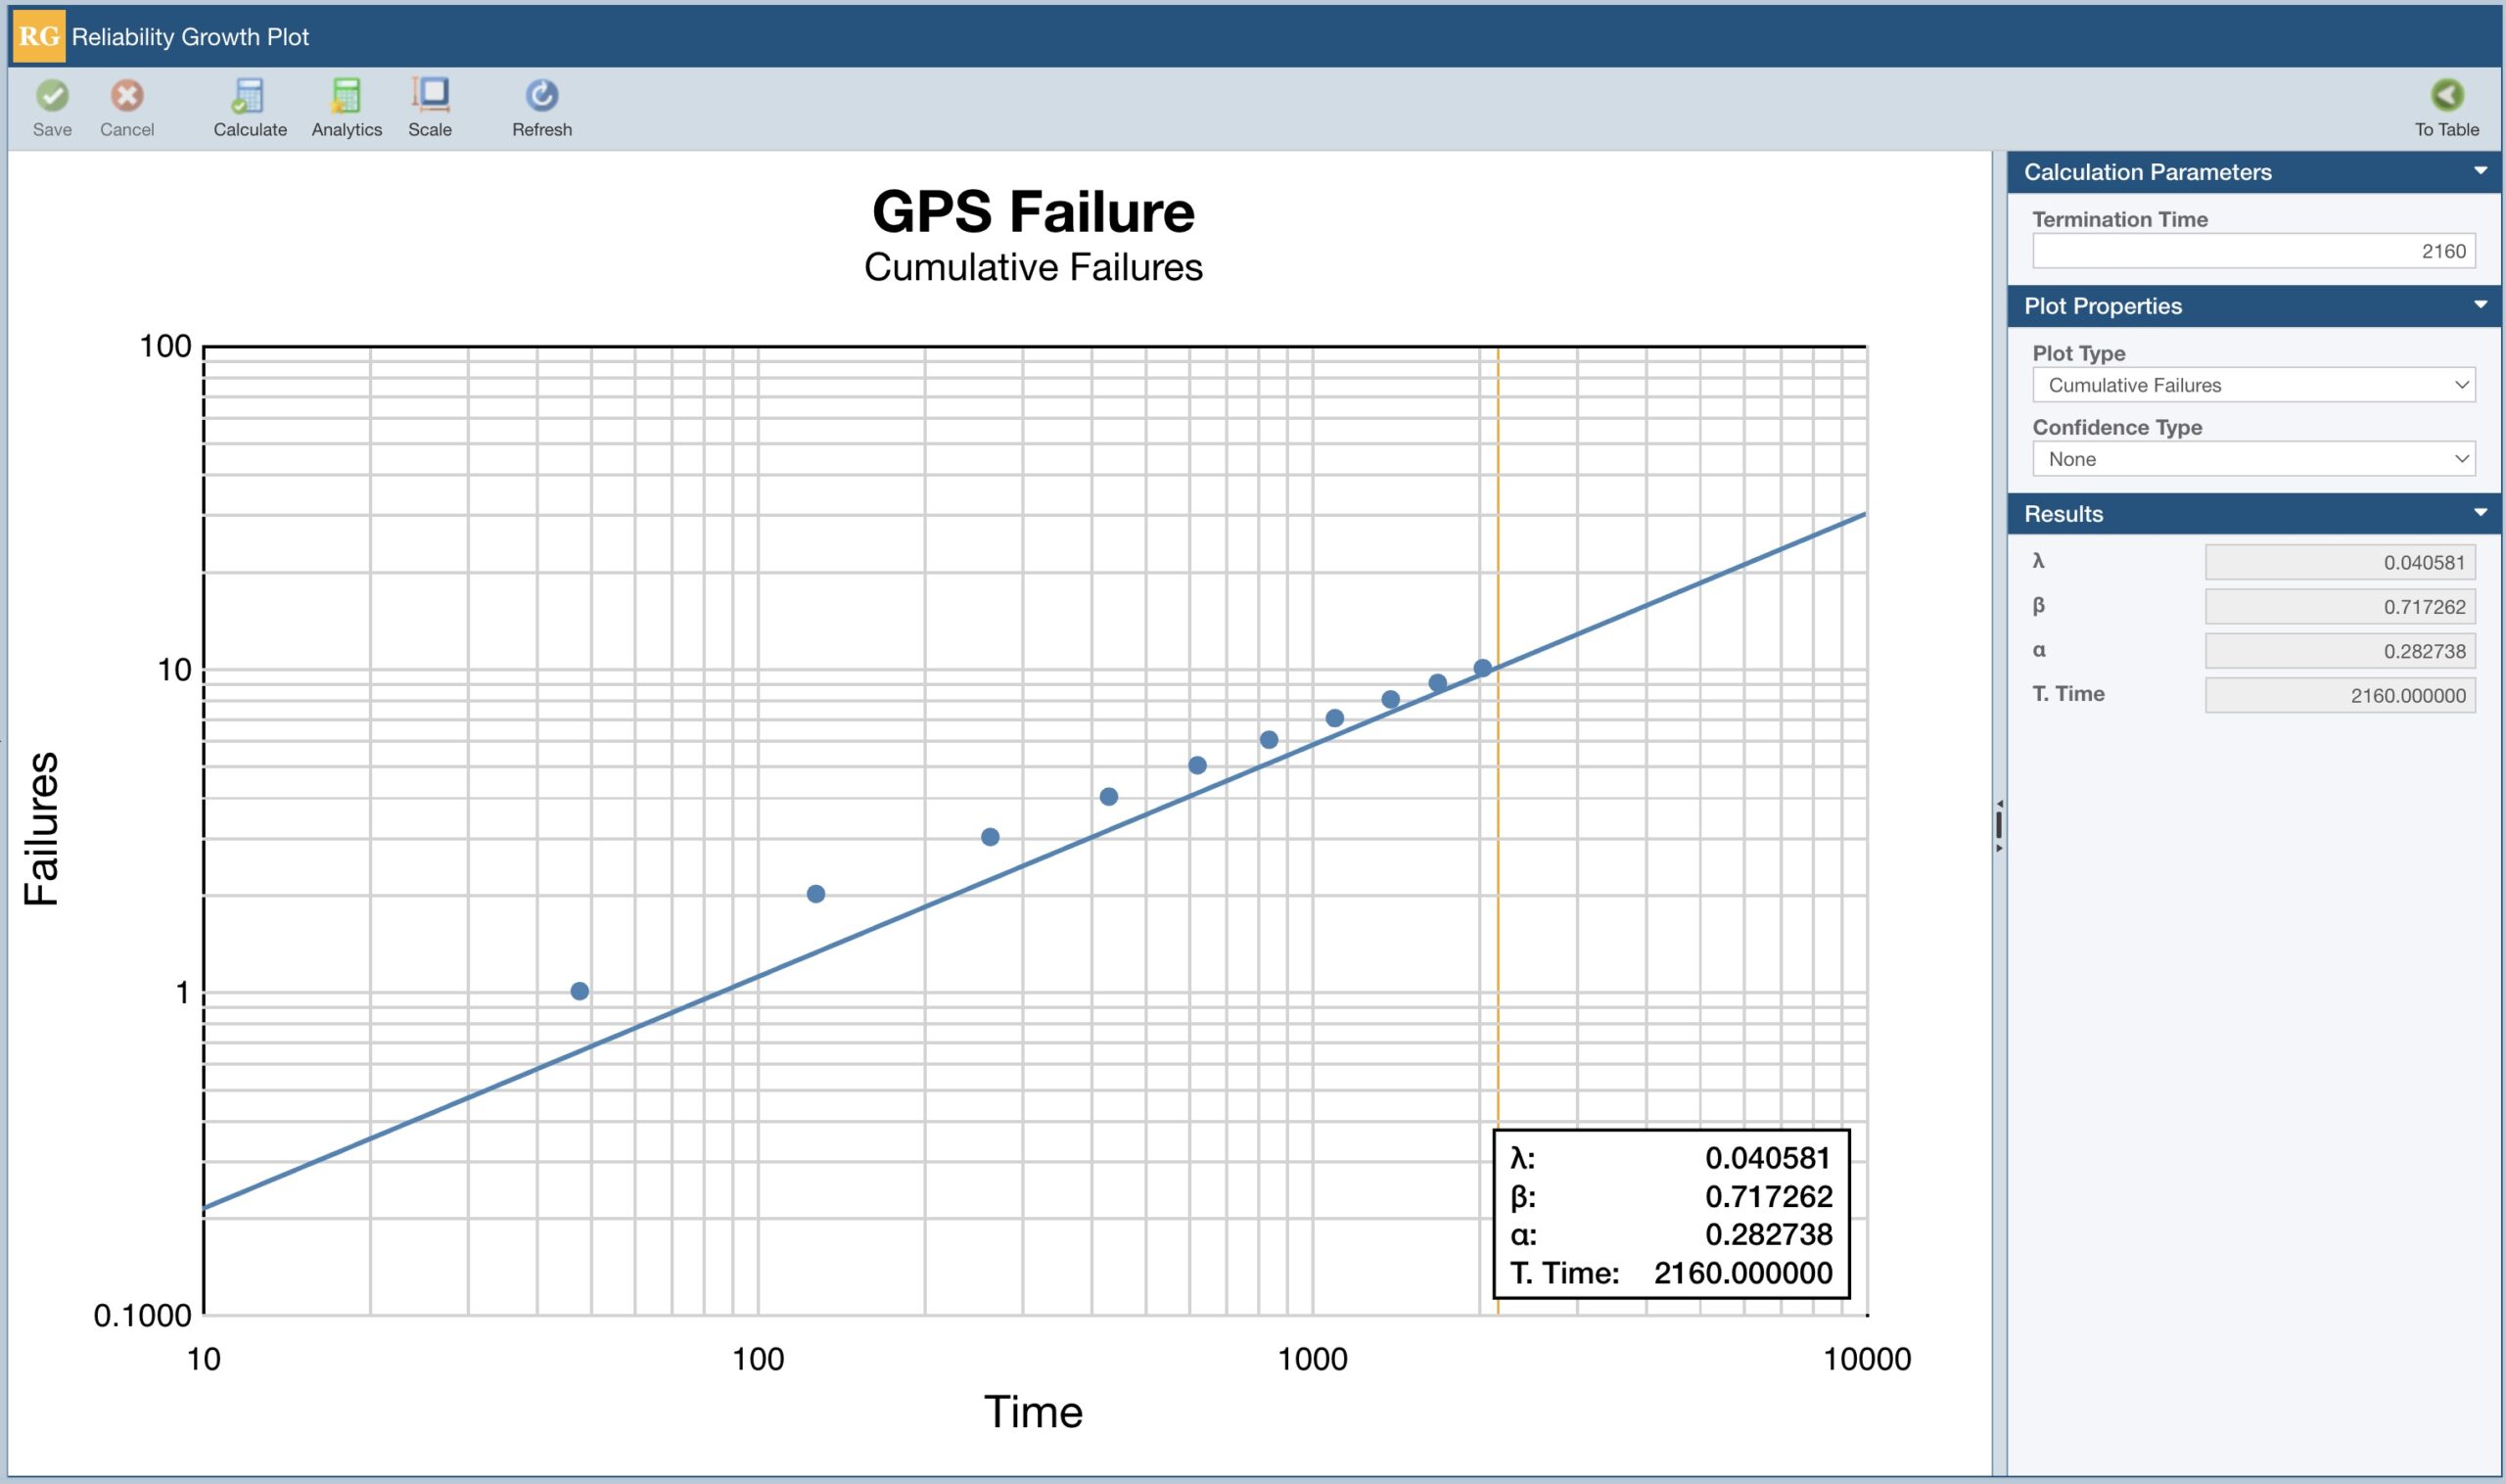
Relyence Weibull includes the ability to perform Reliability Growth Analysis (RGA). Reliability Growth Analysis provides a methodology to track the effectiveness of the improvements made over time on a product’s reliability performance.
You can input your life data set either as Exact Failure Times or, if the exact time to failure isn’t known, as time Intervals on the Data Points Table. Statistical analysis calculations are performed based on the Crow-AMSAA reliability growth model. Generated reliability growth plots include the data points along with a statistical fit line, and can optionally include confidence bounds. Reliability growth plots are an important aspect of RGA and allow you to easily see your reliability metric changes over time as design changes are implemented.
Best Fit Analysis
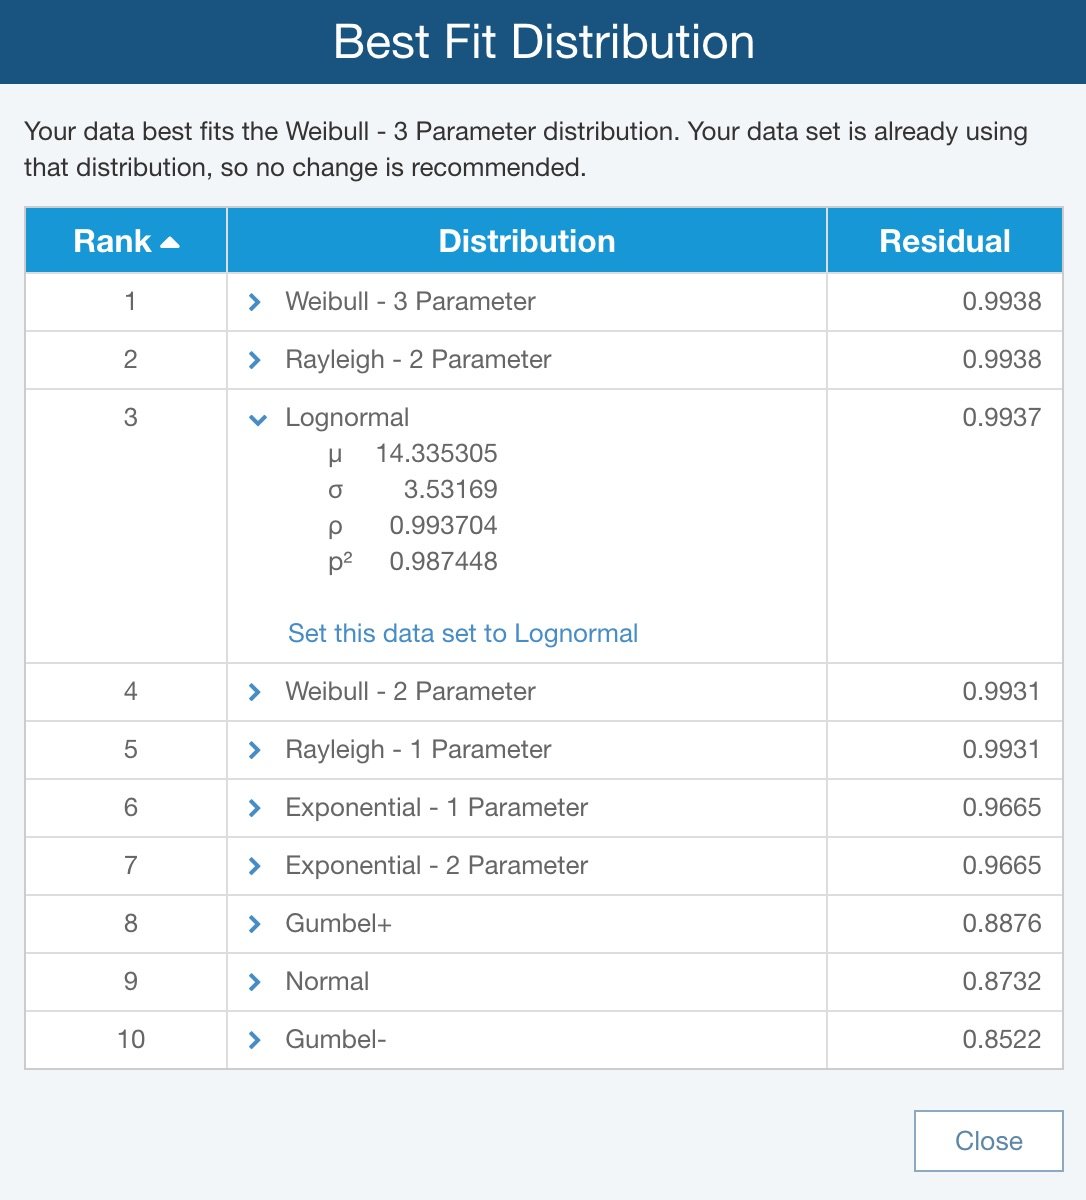
When performing your Weibull analysis, you may have a distribution you prefer to use. In this case, you can directly specify your selected distribution. In other situations, you may want to evaluate the distribution that best fits your data set. In this case, Relyence Weibull provides the statistically-based Best Fit analyzer that you can employ to determine your best fit distribution. Using the Best Fit analyzer, you can select any number, or all, distributions to use for the analysis. Relyence Weibull’s mathematical engine will run through a step-by-step assessment of all selected distributions and provide results, along with a recommended distribution. You can then choose to change the distribution to the recommended one, or select another if you prefer.
Analytics Calculator
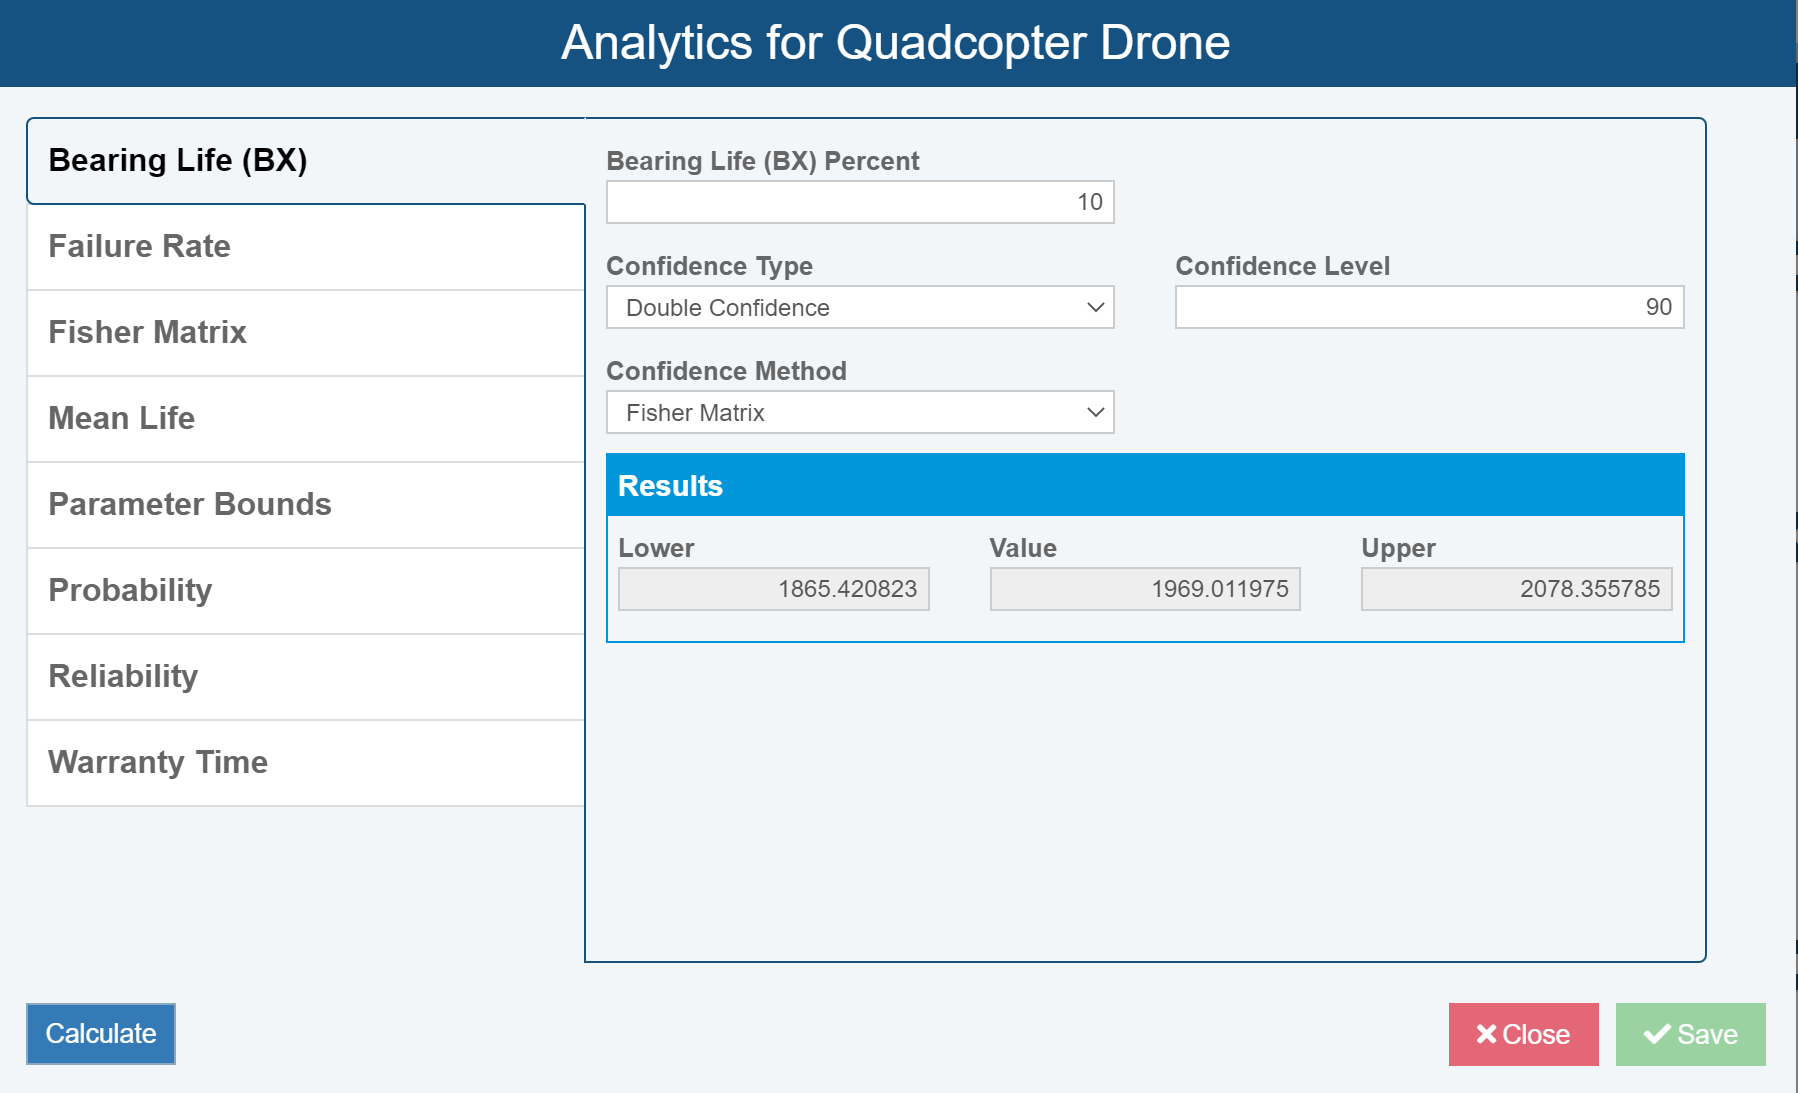
The built-in Analytics Calculator in Relyence Weibull allows you to compute a variety of additional important metrics based on the analysis results for any of your Weibull data sets. Use the Weibull Analytics Calculator to get results for the following metrics including confidence bounds if desired:
- Bearing Life (used to calculate B10 Life)
- Failure Rate
- Fisher Matrix
- Mean Life
- Parameter Bounds
- Probability of Failure and Conditional Probability of Failure
- Reliability and Conditional Reliability
- Warranty Time
Report Generation
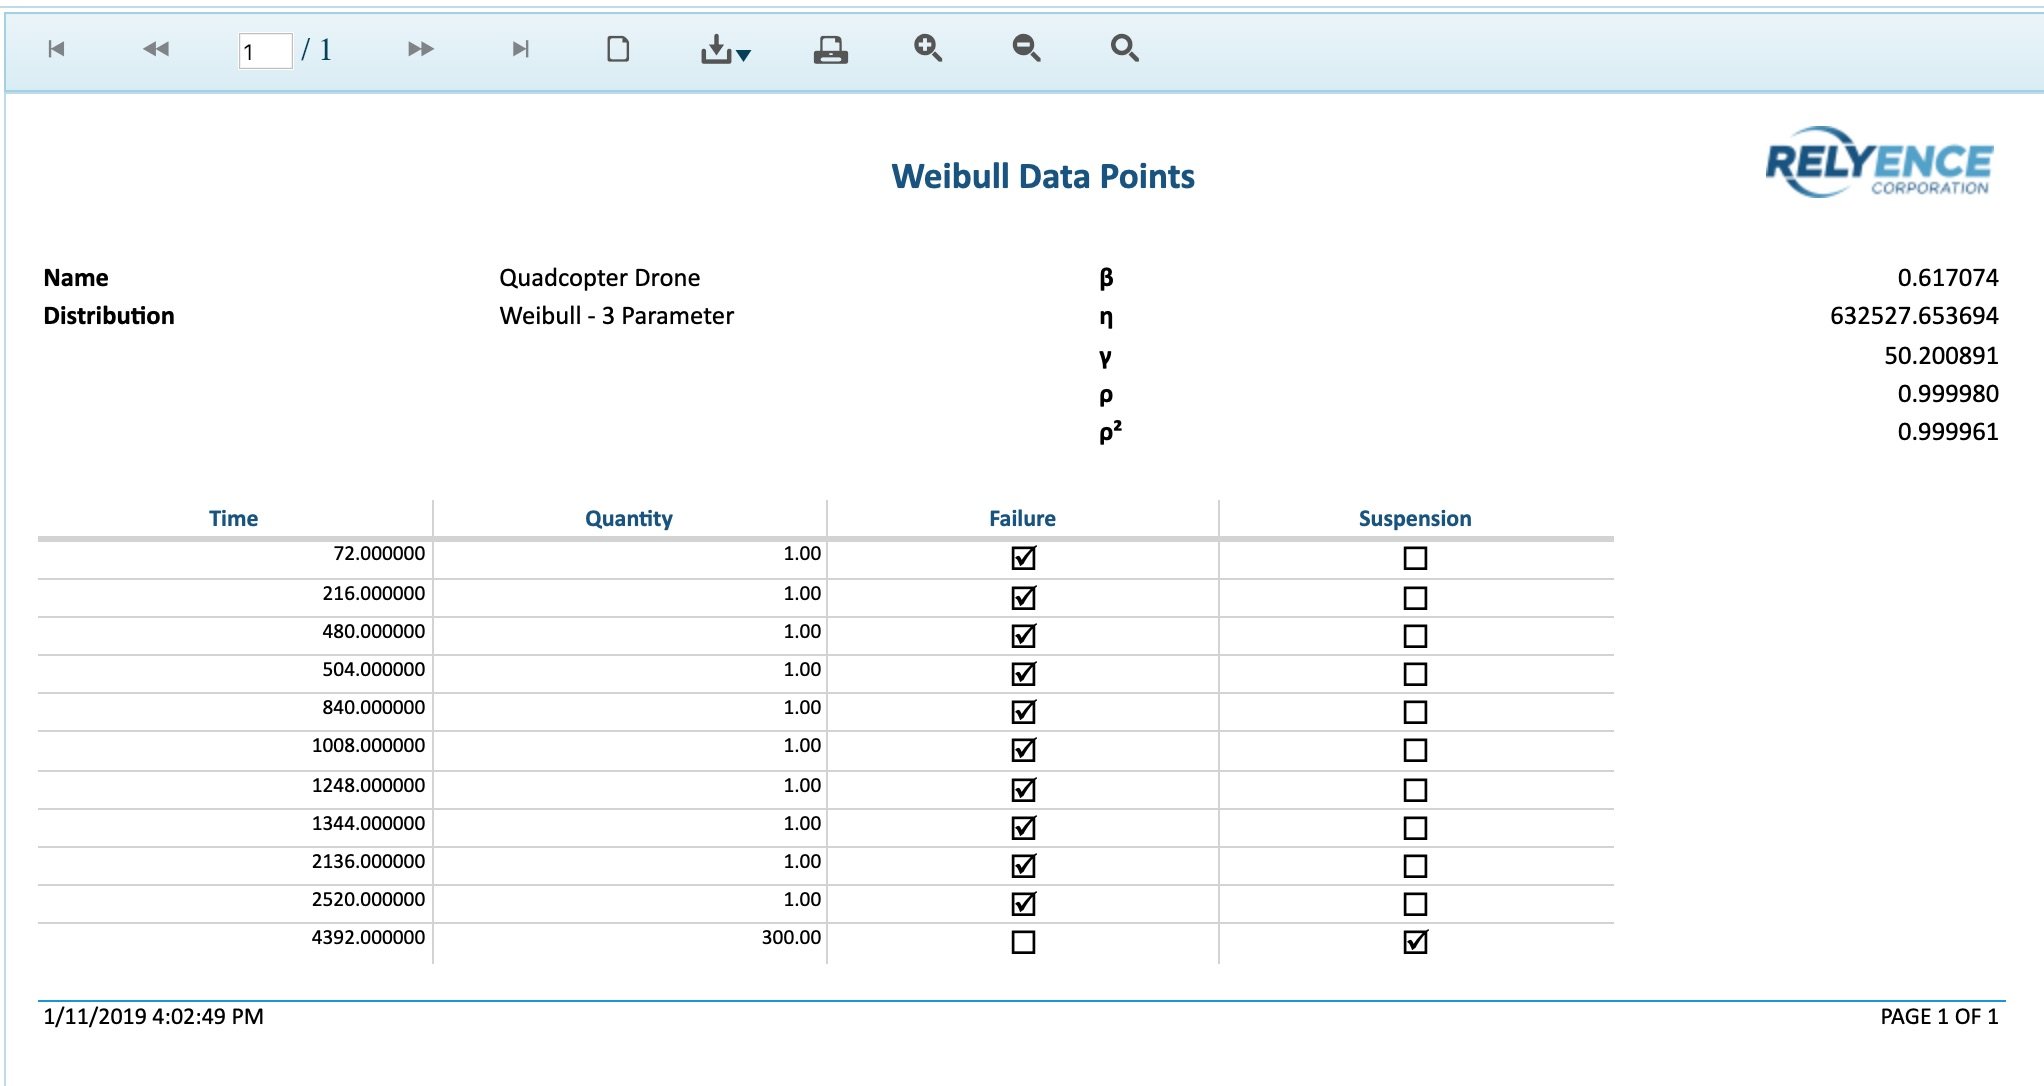
Relyence Weibull includes the ability to generate reports of your data as well as your Weibull plots. Your Weibull plot outputs can be printed and saved to variety of image-based formats including JPG, BMP, PNG, and SVG. You can also create complete reports of your Weibull data points and associated calculation parameters obtained from your Weibull calculations. These output reports can be customized to include a single data set or all data sets, and can be printed or exported to PDF, Excel, PowerPoint, TIFF, or Word formats.
Product Integration
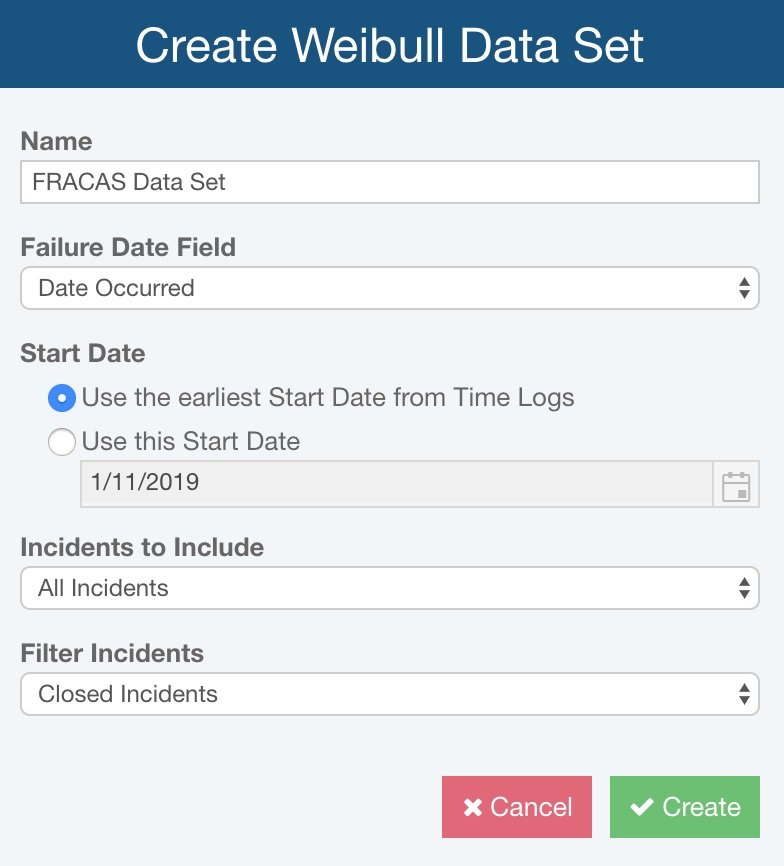
To maximize the power of your Weibull analysis, you can use the results of your analyses throughout your other Relyence modules. In Relyence Reliability Prediction, you can link a Part in your Analysis Tree to any of your Weibull Data Sets. Your Reliability Predictions can then use your real-world life data for more accurate analyses. You can use this same feature to link a Weibull Data Set to an item in your Analysis Tree in your Reliability Predictions. Additionally, you can link a block in your Relyence RBD (Reliability Block Diagram) to a Weibull Data Set for effective RBD analyses. If you are using Relyence FRACAS, you can use our unique Create Weibull Data Set feature to automatically generate a Weibull Data Set from your captured FRACAS Incident data for a powerful way to discover trends and uncover potential issues for proactive problem solving.

