• Products
    • Our Products
    • Relyence FMEA
    • Relyence FRACAS
    • Relyence Fault Tree
    • Relyence Reliability Prediction
    • Relyence RBD
    • Relyence Maintainability Prediction
    • Relyence Weibull
    • Relyence ALT
    • Relyence Studio
  • Industries
    • Industries Overview
    • Aerospace
    • Automotive
    • Commercial
    • Consumer Products
    • Defense
    • Healthcare
    • Medical
    • Oil & Gas
    • Telecom
  • Services
    • Our Services
    • Training
    • Implementation
    • Technical Support
    • Resources
  • Blog
  • About Us
    • Our Team
    • Join Us
    • Why Relyence
    • Contact Us
  • Sign In

Call us today! 724.832.1900

info@relyence.com
RelyenceRelyence
  • Products
    • Our Products
    • Relyence FMEA
    • Relyence FRACAS
    • Relyence Fault Tree
    • Relyence Reliability Prediction
    • Relyence RBD
    • Relyence Maintainability Prediction
    • Relyence Weibull
    • Relyence ALT
    • Relyence Studio
  • Industries
    • Industries Overview
    • Aerospace
    • Automotive
    • Commercial
    • Consumer Products
    • Defense
    • Healthcare
    • Medical
    • Oil & Gas
    • Telecom
  • Services
    • Our Services
    • Training
    • Implementation
    • Technical Support
    • Resources
  • Blog
  • About Us
    • Our Team
    • Join Us
    • Why Relyence
    • Contact Us
  • Sign In

Weibull Plots

Home » Products » Weibull » Weibull Plots

WEIBULL PLOTS

Relyence Weibull’s plotting features provide clarity and visually impactful presentations.

WEIBULL PLOTS

A central component of Weibull analysis is the generation of Weibull plots. Relyence Weibull offers visually impactful plotting capabilities. You can select from a variety of plot types, and include confidence bounds if you prefer. You can customize the plots to suit your needs and generate output reports in a variety of formats.
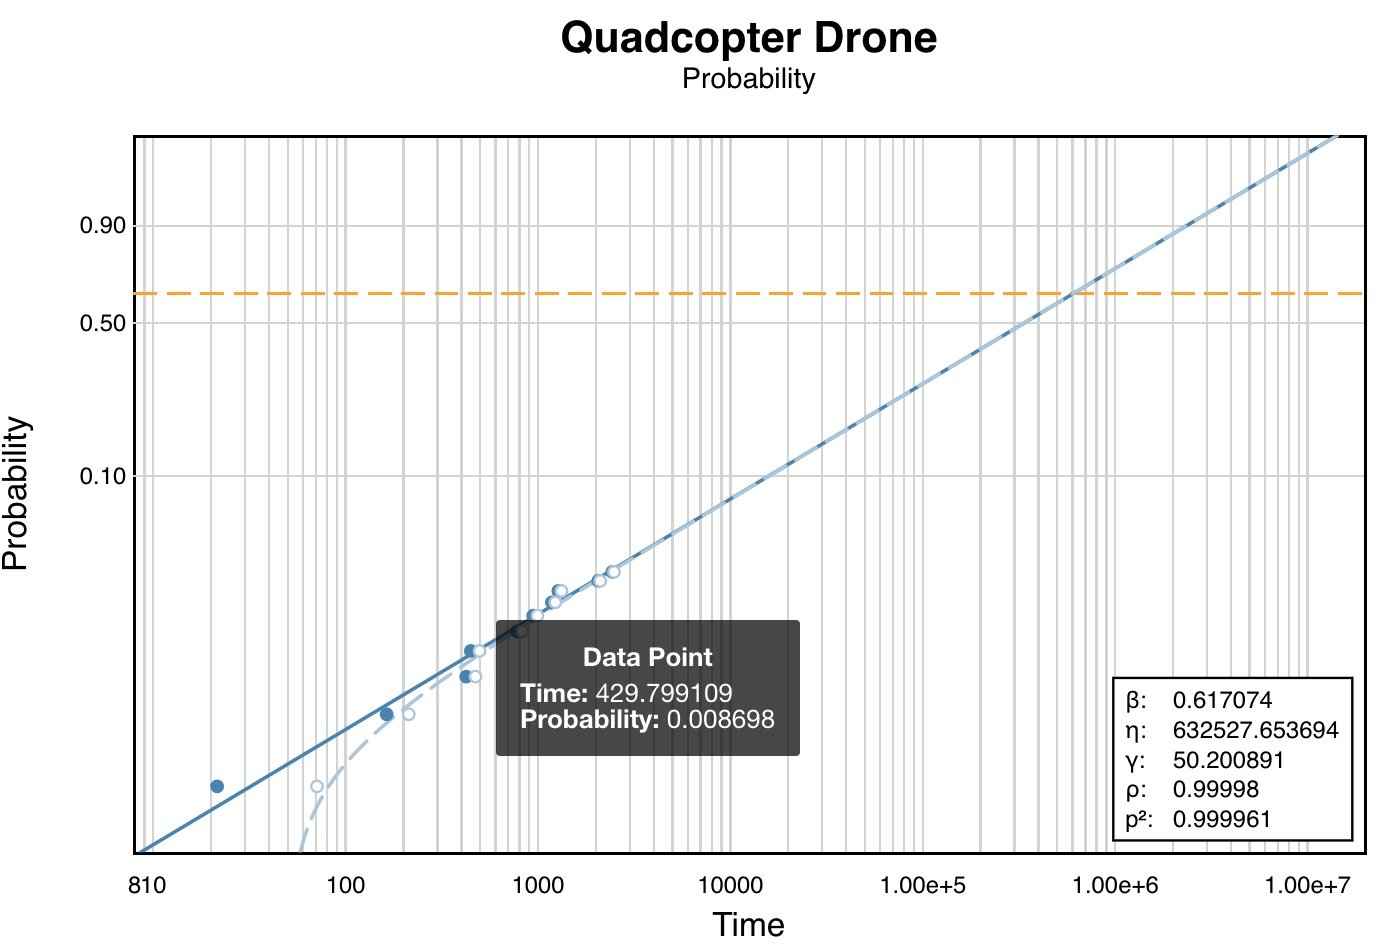
Relyence Weibull Hover feature
Relyence Weibull supports a variety of plot types and includes a handy hover feature to highlight information for easy viewing.
Plot Types

Relyence Weibull supports several plot types including: Probability, Reliability vs Time, Unreliability vs Time, Failure Rate vs Time, and PDF (Probability Density Function) Plots. Relyence Weibull automatically sizes and scales plots for optimal viewing. The Weibull plots generated with Relyence Weibull are uniquely visually striking and allow you to easily assess trends and capture failure characteristics.

Once generated, your data point and distribution curve will display on your Weibull Plot. Use the handy hover feature to highlight any point on your plot and view it’s information.

Confidence Bounds

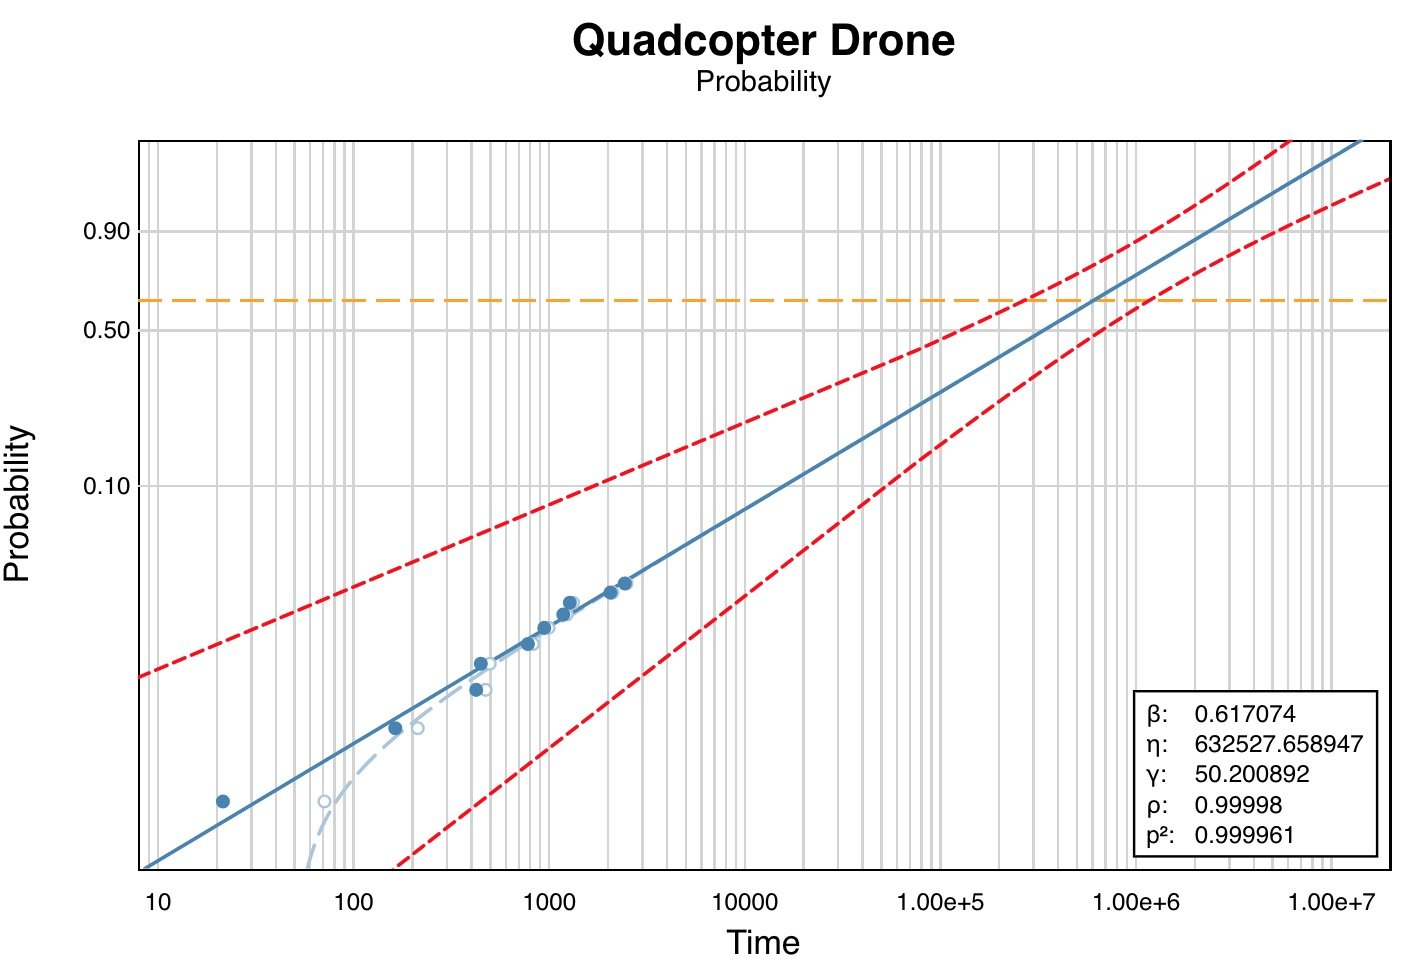
As in any statistical analysis, confidence bounds may be useful when evaluating your data analysis. Confidence intervals are an assessment that indicates how certain you can be regarding the results of your analysis. Confidence is based on a particular confidence level, or numerical probability. For example, a 90% confidence level represents a range that you can be 90% certain contains the mean of your data set. Relyence Weibull enables you to add Confidence Bounds to your Weibull plots. You can select to display Lower, Upper, or Both confidence bounds. You can choose the Confidence Level you wish to use for the confidence bounds lines. Lastly, you can select the Confidence Method you prefer to employ: Fisher Matrix, Likelihood Ratio, or Binomial.

Relyence Weibull Plot with Confidence Bounds
You can choose to display confidence bounds on your Weibull plots, and select the confidence level and confidence method.
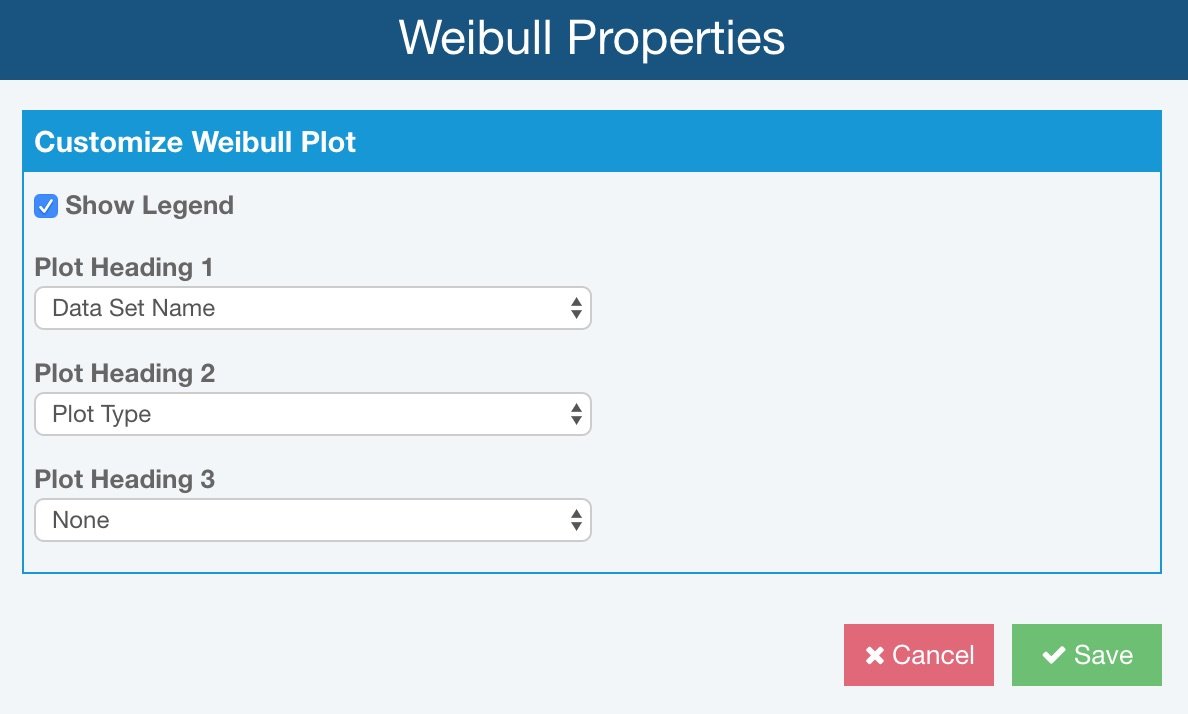
Weibull Properties
You can customize your Weibull plots to show or hide the results legend and add headings as you prefer.
Customizing

Your Relyence Weibull plots can be customized. First, you can choose whether to display a results legend on your plot. The results legend includes the distribution result parameters. You can also include up to 3 headings on your plots – a plot title (Heading 1), a plot subtitle (Heading 2), and a secondary subtitle (Heading 3). You can choose what information appears in each heading: Plot Type, Data Set Name, or Distribution. You can change your selections at any time and regenerate the plot to immediately see your new selections.

Reports

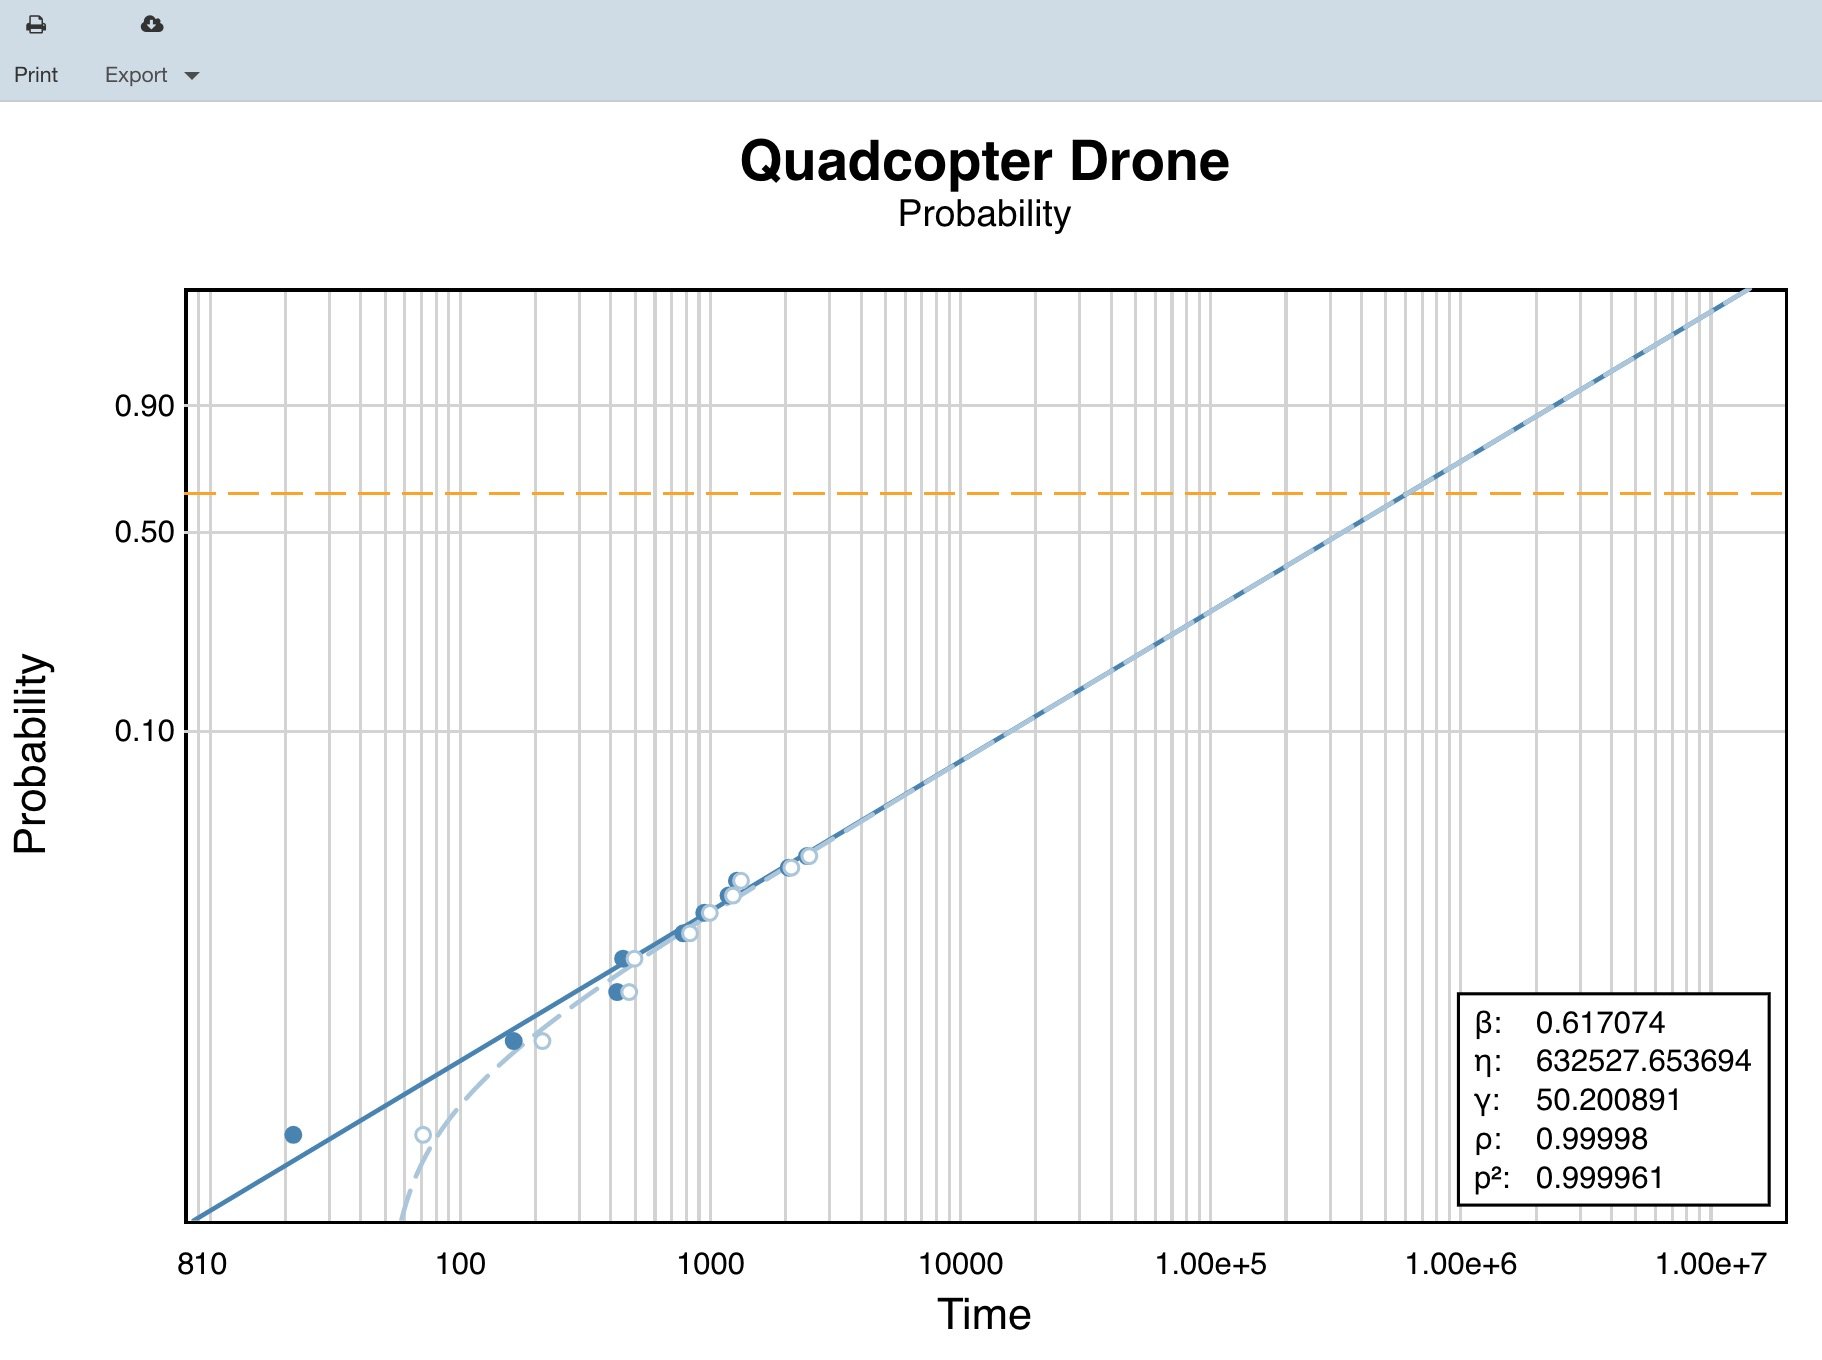
Once your Weibull plot has been customized and generated as you prefer, you may want to generate a report to capture your plot for presentations, papers, or for team sharing. Output reports of your Relyence Weibull plots are available for printing, inclusion in other reports or PowerPoint presentations, or for any other purpose. You can print, or save the output to various formats including JPG, BMP, PNG, or SVG.

Relyence Weibull Plot Report
You can generate reports of your Weibull plots and export them to a variety of formats.
Start your free trial today! Try for Free!
Relyence Corporation logo

At Relyence, we have a passion for always improving. We believe in always creating, always innovating, and always being the best. We believe that in the software world, and in the technology space, we must always be moving ahead. We need to keep pace with all the new technological innovations, as well as new methodologies in industries. We continually work on product development, new capabilities, feature enhancement, and ever improving our tools.

AIAG Member Logo

FIND US HERE

  • Relyence Corporation
  • 540 Pellis Road, Greensburg, PA 15601
  • 724.832.1900
  • wecare@relyence.com
  • https://relyence.com

Privacy Policy

Terms of Service

Sitemap

FRESH FROM OUR BLOG

  • Maintainability Prediction: A Comprehensive Overview
  • Welcome to Relyence 2023 Release 1!
  • An Overview of FRACAS Methodologies

© 2023 Relyence Corporation All Rights Reserved. Relyence® is a registered trademark of Relyence Corporation.

  • Try for Free!