
A cornerstone of reliable product design lies in understanding and estimating the product’s projected lifespan. For example, when Consumer Reports evaluated roof shingles rated to last 50 years, they relied on simulated lab conditions rather than waiting decades for real-world performance data. When products are designed for such long service lives, it becomes clear why it is essential to evaluate its reliability within a reasonable timeframe rather than waiting a half-century to see results. That is where Accelerated Life Testing steps in.
What is ALT?
Accelerated Life Testing (ALT) is a method used to evaluate reliability and lifespan by subjecting products to stresses that speed up failure mechanisms. It involves exposing products to harsher than normal operating conditions—such as higher temperatures, more vibration, or greater humidity—to induce failures more rapidly.
By causing components to fail faster, ALT enables engineers to collect failure data for analysis in a much shorter period. By analyzing the resulting failure data, engineers can estimate how long a product will remain operational under normal operating conditions.
In this article, we will review the following:
- What are the benefits of ALT?
- What industries use ALT?
- How do I perform ALT?
- A simple ALT example

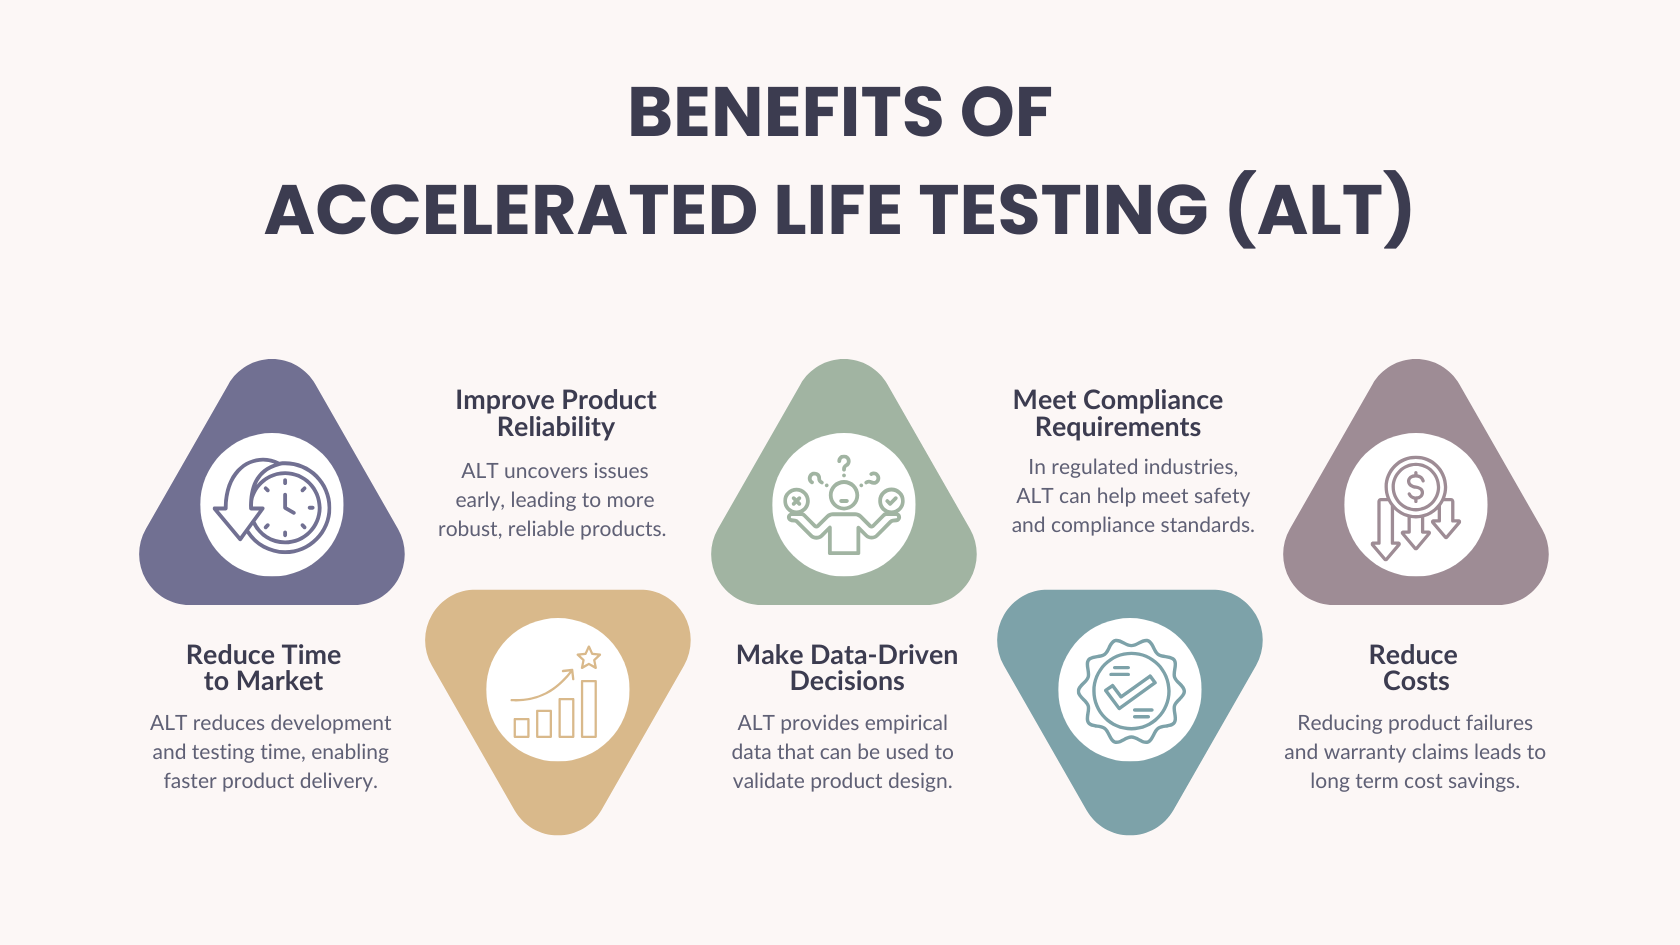
What Are the Benefits of ALT?
ALT offers a range of advantages to companies developing and manufacturing products. It enables organizations to deliver high-reliability products with confidence.
- Reduce Time to Market: One of the immediate advantages of ALT is the ability to simulate years of usage in a fraction of the time. This speeds up product validation and shortens the development cycle, enabling faster delivery of new products to market.
- Improve Product Reliability: ALT allows engineers to uncover design flaws and weak components that may fail prematurely under real-world conditions. Identifying and correcting these issues early leads to more robust, reliable products and reduces the likelihood of costly field failures or recalls.
- Make Data-Driven Design Decisions: ALT provides empirical data that can help teams make design improvements and validate design specifications. This allows for more confident engineering decisions and improved product design.
- Meet Compliance Requirements: In regulated industries, ALT can help satisfy safety standards and supports reliability and risk assessments thereby making it easier to meet compliance requirements.
- Reduce Costs: By enabling manufacturers to deliver reliable products from the start, ALT helps minimize product failures, reduce unexpected issues, mitigate warranty claims, and avoid costly recalls and design revisions. Together, these benefits contribute to lower overall product costs.
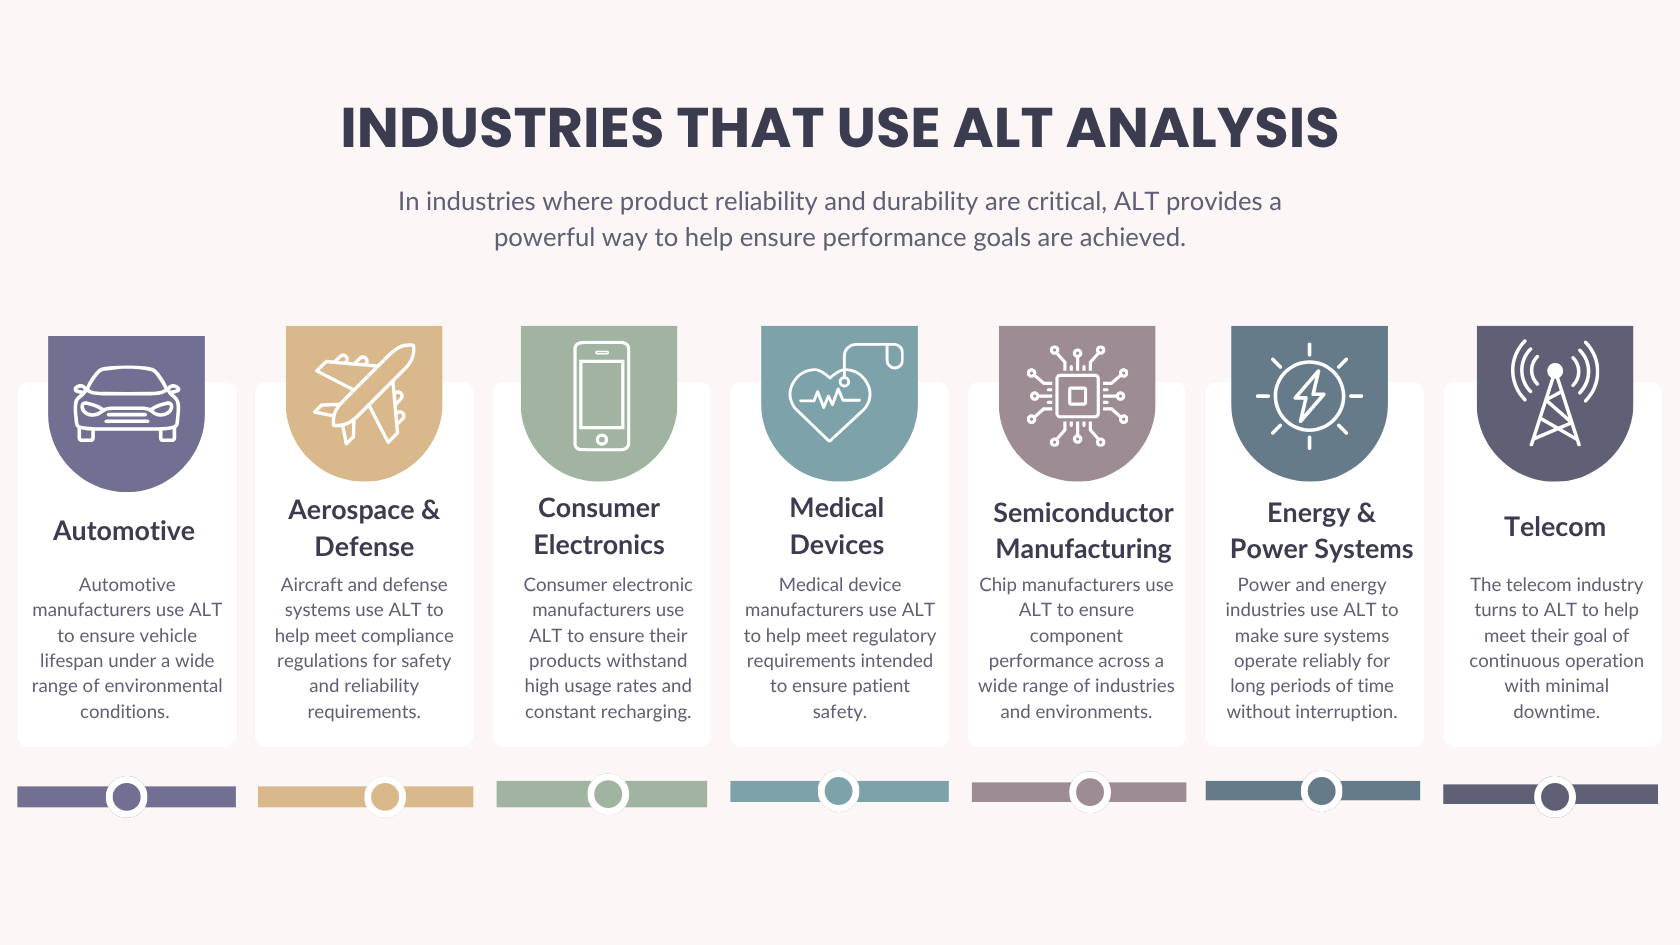
What Industries Use ALT?
In industries where product reliability and durability are critical, ALT provides a powerful way to help ensure performance goals are achieved.
Automotive
Automotive manufacturers need to assess vehicle lifespan under a wide range of environmental conditions. ALT analysis aids in predicting product reliability across a variety of stress conditions in a fraction of the time.
For example, EV manufacturers can use ALT to estimate battery life under high and low temperature conditions.
Aerospace & Defense
Aircraft and defense systems are subjected to extreme environments and must meet strict compliance regulations. Additionally, aircraft and defense related products remain in use for extended periods of time. ALT enables engineers to develop products that can meet the rigorous standards required in these highly regulated industries.
For example, ALT analysis can be used to evaluate the reliability of jet engine turbine blades— predicting long-term viability after thousands of flight hours.
Consumer Electronics
Consumer electronics manufacturers build products that are used around the world day after day. Devices need to be durable and withstand high usage rates, elevated temperatures, and constant recharging. When developing these devices, ALT can help manufacturers test the wide range of stresses their devices experience in a shortened timeframe to meet quick product upgrade cycles.
For example, smartphone manufacturers can use ALT analysis on batteries to simulate years of recharging.
Medical Devices
Medical device manufacturers—similar to the aerospace and defense sector—operate in a sector where reliability and safety are paramount. Medical devices must meet regulatory requirements intended to ensure patient safety.
For example, ALT analysis can help assess long-term use of pacemakers in a compressed time period.
Semiconductor Manufacturing
Given the widespread use of computer chips across all industry sectors, the performance of these components in a range of environments is vital for success. Chips in automobiles are subject to high and low temperatures, humidity, and more. Chips in data centers are subject to 24/7 usage. Semiconductor devices used in regulated sectors such as aerospace and defense and medical devices must be able to withstand the performance requirements of these mission critical products.
For example, ALT can evaluate microprocessors using high-temperature operating life (HTOL) testing to assess failures due to degradation in extreme environments.
Energy & Power Systems
In the energy and power sector, the need to operate reliably for long periods of time without interruption is critical to maintaining uptime objectives. In some cases, such as wind turbines, systems are subjected to environmental extremes.
For example, by exposing wind turbines and solar panels to various temperatures, humidity levels, and UV radiation, ALT analysis can help estimate how they will perform over decades of use.
Telecommunications
The telecom industry also needs to maintain continuous operation with minimal downtime. Disruptions to service must be minimized, so predicting reliability and isolating weak points is crucial for system success.
For example, ALT analysis can expose telecom components such as radio units to stressors such as humidity and salt-laden air to simulate operations in coastal environments to project lifespan in these harsh conditions.
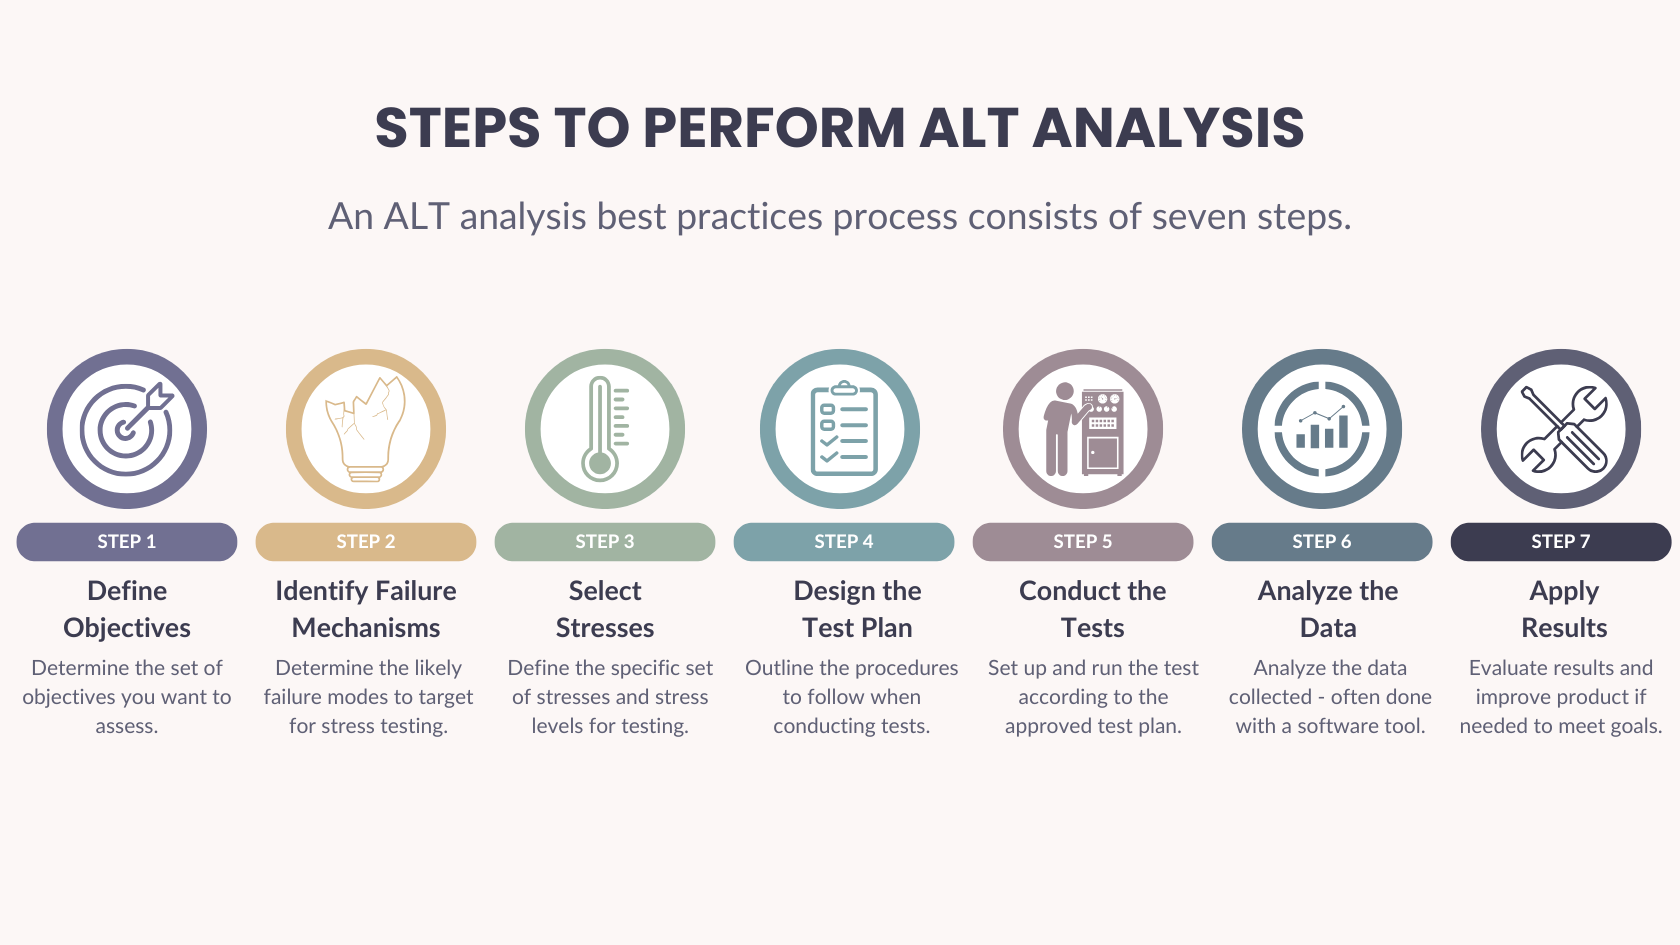
How Do I Perform ALT?
Implementing ALT requires a systematic approach to ensure accurate and meaningful results. It involves planning, selecting the appropriate stressors, designing experiments, collecting data, and analyzing the results with software tools. ALT analysis best practices can be broken down into seven steps:
- Define Objectives
- Identify Failure Mechanisms
- Select Stresses
- Design the Test Plan
- Conduct the Tests
- Analyze the Data
- Apply Results
Step 1: Define Objectives
Determining the set of objectives you want to assess with ALT is key. It is best to consider a team-based approach to defining objectives by involving key stakeholders to understand all aspects that are important across the product development spectrum. In this manner, all team members are aware of performance goals and understand their role in the design and development process.
For example, you may be interested in predicting product lifespan in normal use, estimating what effect a particular high stress condition (such as elevated temperature) has on reliability, comparing design alternatives, or providing metrics for compliance requirements.
Step 2: Identify Failure Mechanisms
During this stage, it is important to determine the likely failure modes. Oftentimes, a tool such as FMEA can aid in this part of the process. By reviewing the expected failure modes, you can identify the most critical ones to consider and design your ALT tests accordingly. By understanding potential failures, it is easier to define which stressors to apply to accelerate those failure modes.
Step 3: Select Stresses
The next step is to define the specific stressors to target and the levels to apply for testing. For example, you may determine temperature is a stress you want to target due to its propensity to cause product failure. Then, you need to define the temperatures to use in testing. This may be high temperatures if your devices are in enclosed environments without air flow or low temperatures if your components are used in cold climates. The goal is to accelerate failure—not to cause failures unrelated to actual real-world usage—so pick testing conditions carefully.
Step 4: Design the Test Plan
Your ALT test plan includes outlining the procedure for the tests. Information such as sample sizes, types of stress, stress levels, and duration of testing must be defined. Defining a detailed and effective test plan is key to ensuring that the data collected will produce reliable results. Software designed for ALT analysis—such as Relyence ALT—may include a test planning feature that can aid in this step of the process.
Step 5: Conduct the Tests
Once the test plan is completed, it is time to perform the tests. The tests must be correctly set up and monitored to verify that they are proceeding as intended. An organized data collection process is vital to ensure data is accurately recorded.
Step 6: Analyze the Data
Once collected, engineers can use the ALT data to evaluate the desired metrics using an analytical software tool like Relyence ALT. ALT software employs statistical techniques to analyze the data to determine the acceleration factor and to find the best fit distribution for the data. For a look into the methodology used to perform ALT analysis, see our An Introduction to ALT Analysis article.
Step 7: Apply Results
Armed with your ALT results, the final step is to evaluate the information and determine if your product is meeting your performance goals and objectives. If your ALT results indicate your requirements are satisfied, then you should have confidence to move forward with the knowledge that your design will perform as intended. Otherwise, you may need to review your design to create an improvement plan or modify the specified environmental parameters. The value of ALT analysis is that you can work to improve your product before field failures occur.
ALT Example
As an example, assume we want to assess the life of a USB charging cable: a standard insulated copper wire. We want to determine how long our cable is likely to last under standard use. Our goal is for our cable to have a mean life (the average time a product is expected to function before failure) of at least 5 years.
Step 1: Define Objectives
Our objective is to determine if we can expect our cable to last for 5 years with normal use.
Step 2: Identify Failure Mechanisms
After reviewing our DFMEA which identified potential failure modes, one failure mode in particular is considered most likely: breakdown of the insulation if the wire is subjected to high voltages, increasing the risk of short-circuit failure. Therefore, for our analysis, we’ll focus on insulation breakdown.
Step 3: Select Stresses
For this example, we’ll only consider voltage stress and keep all other stresses (temperature, humidity, etc.) constant.
Step 4: Design the Test Plan
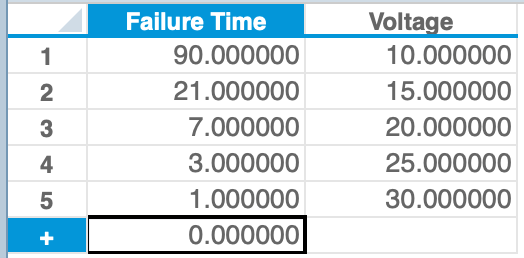
We’ll test at five elevated voltage levels until insulation failure occurs. We’ll test at 10, 15, 20, 25, and 30 volts. We will test one identical cable at each voltage level, measuring time (in hours) until insulation failure occurs. Other conditions (e.g., temperature, humidity) will remain constant.
Step 5: Conduct the Tests
We perform the tests as specified and log the failures. The following are the results obtained (the Failure Time is the number of hours until the cable failed):
Step 6: Analyze the Data
To analyze the collected test data, we’ll use Relyence ALT software. First, we’ll use Relyence’s Best Fit Analyzer to determine the best fit distribution for our data set.
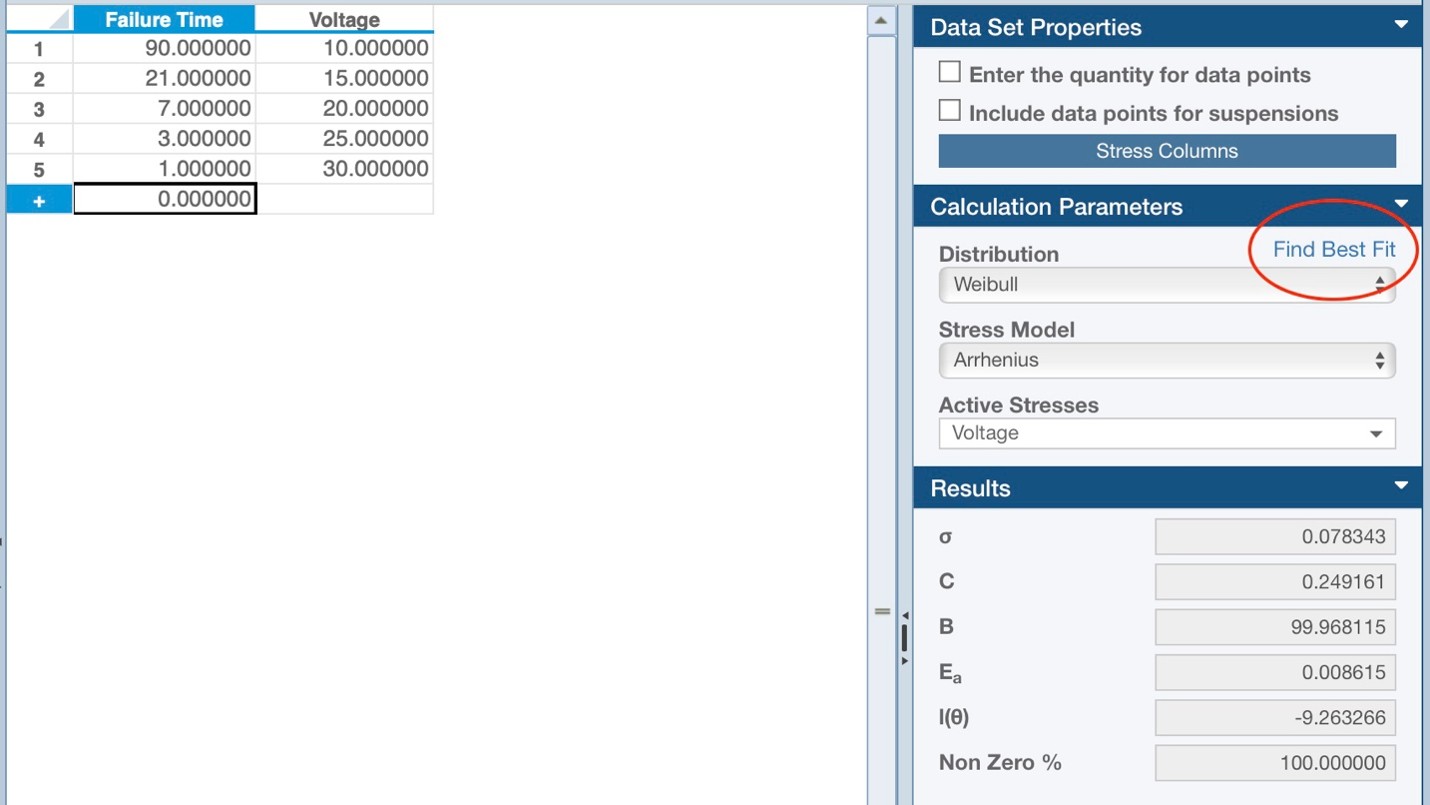
From this, Weibull is selected as the best distribution. Using this, we can view the resulting Reliability vs Time plot:
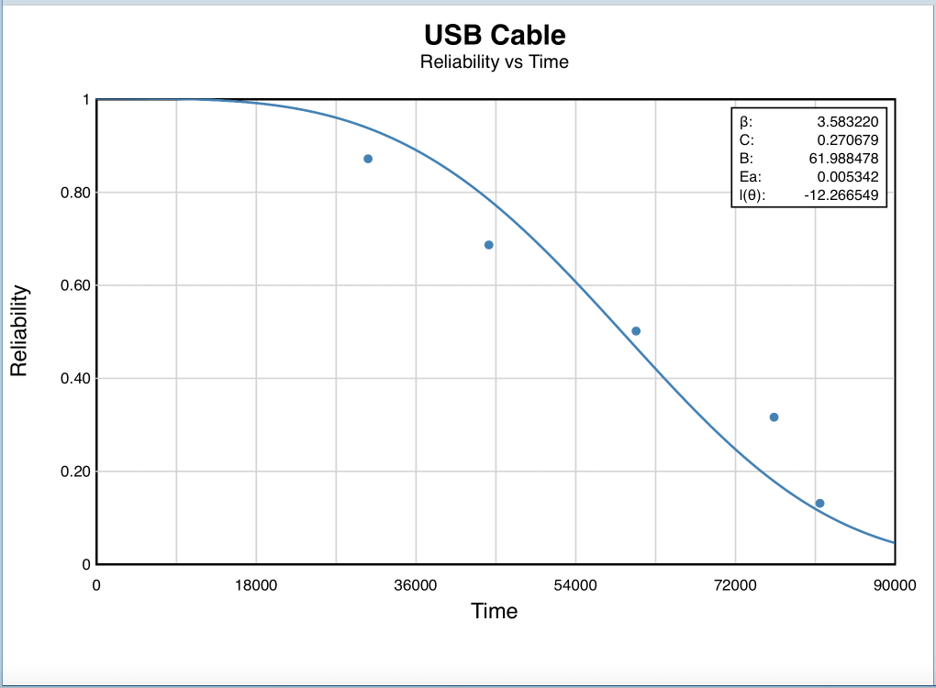
We can see from the plot that it is not until about 36,000 hours (over 4 years) that we see our reliability start to decline significantly.
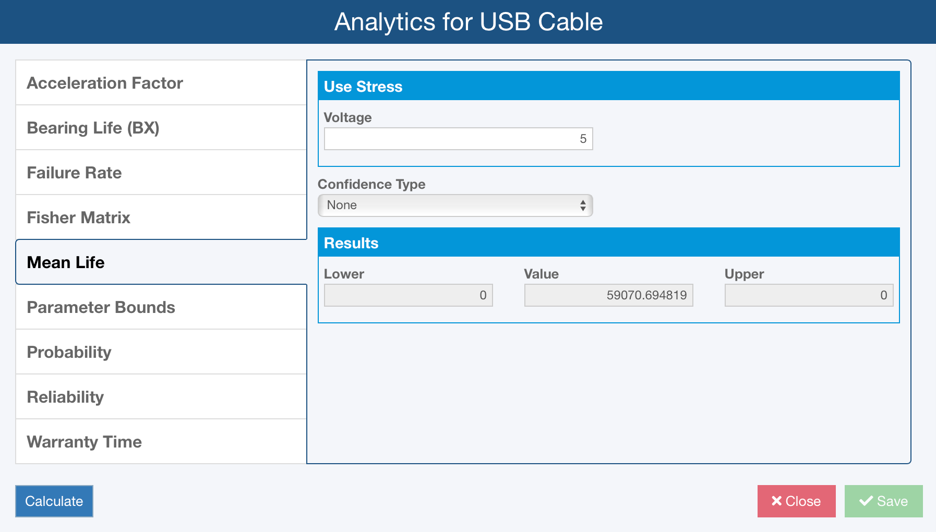
We can use the Analytics Calculator in Relyence to determine the mean life of our cable under normal 5V operating conditions. The results show that our expected mean life of our charging cable is 59,070 hours, or approximately 6.7 years:
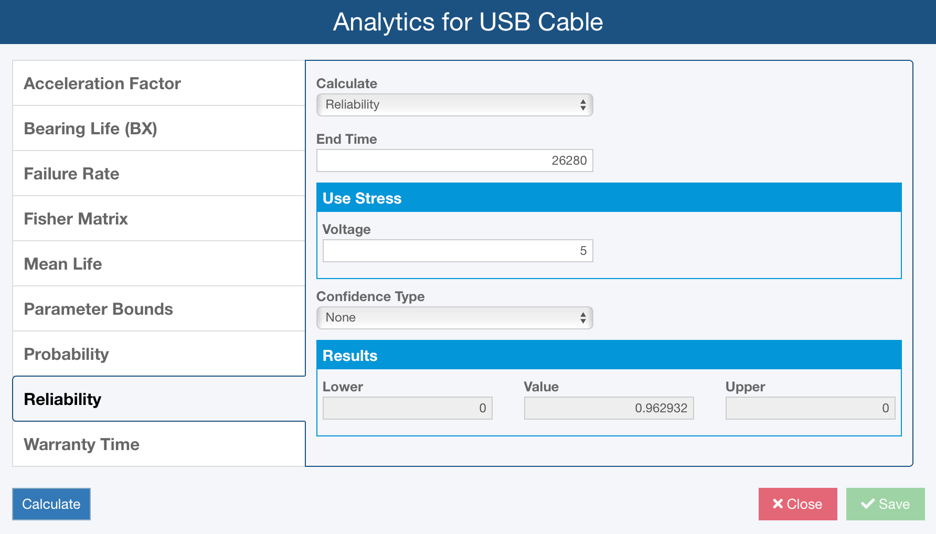
We can also estimate the reliability of our cable at various time points using the Analytics Calculator. For example, we can see that at 3 years, the reliability is 0.96:
Step 7: Apply Results
In this case, we are satisfied with our mean life projection of over 6 years. This ALT analysis gives us confidence in our design, and we can proceed with manufacturing and deploying our cable knowing that our product will likely meet its performance goals.
This example shows how ALT empowers companies to build resilient, field-ready products with confidence, reducing post-launch surprises and maximizing customer satisfaction.
In Conclusion: Relyence ALT
Accelerated Life Testing offers a reliable, data-driven way to understand how long a product will last in the field by subjecting products to elevated stress conditions. ALT empowers engineers to deliver durable, dependable products in a fraction of the time traditional life testing requires, saving cost and catching unforeseen reliability issues early.
Relyence ALT is a powerful tool to help you perform your ALT analyses with ease. As part of the Relyence reliability and quality tool suite, it delivers the best-in-class features that are central to the Relyence brand. Intuitive and elegant design, browser-based flexibility for anytime, anywhere access, support for cloud-hosted or on-premise installations, and a top-notch support team are just a few of the Relyence advantages you will experience. Read more about Relyence ALT, contact us today so we can talk about your ALT needs and how Relyence ALT can help, or sign up today for our free trial to see Relyence ALT in action.