Reliability engineering, and the related field of quality engineering, both have long historical roots. Adopted early on in the military and defense sectors, reliability engineering analysis spans a broad range of industries as reliability is now recognized as a critical element to product success. This includes aerospace, medical devices, telecom, and consumer products, to name just a few. In addition, the methodologies and tools for assessing and managing reliability goals have grown and advanced as well. This means that today’s reliability engineers have a wealth of analysis tools at their disposal, and often use more than one tool in their daily work.
Can these tools work together in a mutually beneficial way? What is the most effective way to integrate reliability tools? How can analysts benefit by using tools in an integrated approach? This article will answer these questions using some of the most recognized tools in the reliability engineer’s arsenal.
Reliability Analysis Tools and Techniques
First, what are some of the most commonly used analysis tools that reliability engineers employ? There are several, and we will start with a list that encompasses some of the most popular and widely accepted. Each reliability tool has its unique uses and advantages.
- FMEA (Failure Mode and Effects Analysis) identifies potential failures, provides a way to assess the criticality of those failures, and then tracks ways to eliminate or mitigate them.
- FRACAS (Failure, Reporting, Analysis and Corrective Action System) and its related CAPA (Corrective and Preventive Action) enable you to effectively track and manage your corrective action process.
- FTA (Fault Tree Analysis) assesses the risk of catastrophic events.
- Reliability Prediction computes MTBF metrics and provides a platform for “designing-in” reliability.
- RBD (Reliability Block Diagram) offers full scale system modeling and analysis of complex designs including those that use redundancy.
- Maintainability Prediction provides the ability to ensure repair and maintenance procedures are effective and efficient.
- Weibull analysis is a versatile tool for predictive analytics using life data.
- ALT (Accelerated Life Testing) allows you to take accelerated life data and extrapolate real world system performance.
Our set of introductory overviews provides a description of the basic concepts behind each of these analysis techniques.
Benefits of Reliability Analysis Tools
There are many and varied reasons for using reliability analysis tools, such as:
- Improving your product, system, or process
- Meeting compliance requirements
- Assessing the practicality of a possible design
- Comparing design alternatives
- Tracking reliability improvement over time
- Identifying potential problems early in the product lifecycle
- Designing-in reliability
- Changing design to mitigate areas that are failure, safety, or risk hazards
- Managing and tracking the handling of issues found in the field
- Assessing risk and risk metrics such as system availability
- Reducing the Cost of Poor Quality (COPQ)
For these reasons, you can see why using multiple tools offers the most advantages. Depending on your unique situation, some tools may be more beneficial for you.
Using More than one Reliability Analysis Tool
For example, you may work in the defense industry and your contract states that you must complete Reliability Prediction analysis, Maintainability Prediction analysis, and FMECA (Failure Mode, Effects, and Criticality Analysis) on your system.
What you are analyzing may also determine which tools are most useful for your needs. For example, you may need to use RBD because your system is complex and includes redundant components. In conjunction with RBD, you need a tool to assess the failure rates or MTBF values of your components. In that case you may decide to use Reliability Prediction or Weibull analysis.
Or, you may be a manufacturer interested in analyzing your processes. In this case, process-related tools such a FMEA and FRACAS may be most useful to you.
You may want to perform reliability analysis over the full product lifecycle. For example, Reliability Prediction analysis can be done in the design process of the product lifecycle in order to help make design improvements before production even begins. Once manufacturing has begun and life data is available, Weibull Analysis may be helpful to track trends and proactively address potential problems before they grow into larger issues.
These are just a few examples. The reasons analysts select and use multiple tools is widely varied. However, the overall objective remains the same: to ensure your reliability and quality goals are achieved. And importantly, as multiple tools are used and used effectively in an integrated manner, the more dramatic the return on investment will be.

Working Together: Three of the Most Commonly Used Tools in a Reliability Analyst’s Toolset – Reliability Prediction, FMECA, and Fault Tree
Three of the most commonly used tools in engineering for reliability, quality, and risk analysis are Reliability Prediction, FMECA, and Fault Tree. Oftentimes, these are applied as stand-alone tools. Even used in this manner, they provide impressive methodologies for attaining your performance goals. However, using the three in a coordinated way offers an unmatched platform for cohesive and effective analyses.
In the stand-alone approach, these three tools offer the following:
- Reliability Prediction analysis provides a way to analyze an electro-mechanical system to determine predicted failure rate and MTBF (Mean Time Between Failures). For details on the methods and standards used in Reliability Prediction, review our in-depth Guide to Reliability Prediction Methods.
- FMECA, or Failure Mode, Effects, and Criticality Analysis, is an organized, systematic approach for performing failure analysis. FMECAs consider all possible failure modes of a system, then offer a metrics-based approach to assessing the risks of each failure. This risk profile then enables you to target areas of high risk for elimination or mitigation. For a comprehensive explanation of FMEA and FMECA, see our detailed FMEA Overview article.
- Fault Tree Analysis (FTA) uses a top-down deductive approach to assess the likelihood of occurrence of an undesired, often catastrophic, event. FTA provides an important measured-based approach for risk analysis. For a deep-dive into FTA, check out our post answering the key questions about Fault Tree Analysis.
How do you take these seemingly unrelated analysis tools and use them in an integrated manner?
How Reliability Prediction, FMECA, and Fault Tree Analysis Work Together
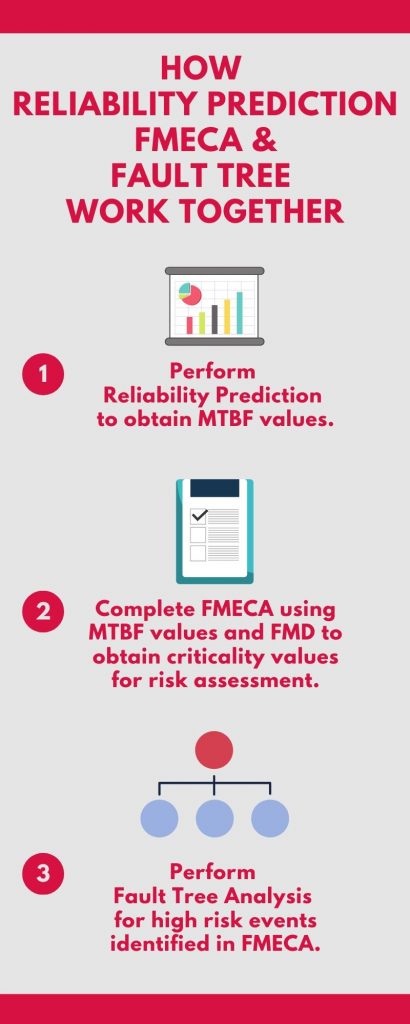
Step 1: Perform Reliability Prediction
To start, you can use Reliability Prediction to calculate the failure rate and MTBF of your system and its components down to the device, or part level. In most cases, you can import your BOM (Bill of Materials) list directly into a Reliability Prediction software tool. At this point, you can augment this information with data about your operating conditions (such as temperatures and environments), or even with test bed performance data and field-based failure data, to further refine the MTBF projections.
Step 2: Complete FMECA
The data and results of your Reliability Prediction analysis then provide a perfect starting pointing for your FMECA. The same BOM used in your prediction analysis can be used for your FMECA. Coupled with the FMD (Failure Mode Mechanism Distribution) database, the failure modes of the devices in your system can be determined. This data, in conjunction with the failure rate data from Reliability Prediction, enable the failure mode failure rates (the failure rate of each particular failure mode) to be assessed. This is then rolled into the criticality metrics – a defining factor in FMECA analysis – that provide a unique numerical basis for assessing the risk of each element in your FMECA.
The next steps are then to categorize your failure modes based on their criticality values and analyze the causes and effects of your failure modes. You can use this information to develop a recommended action plan to address the most severe items. Ultimately, your FMECA can help you track implementation of your recommended actions and the resulting risk reduction.
Step 3: Dive Deeper into High Risk Items with Fault Tree Analysis
Oftentimes, FMECA uncovers particular events that are high risk and may need further analysis for complete understanding. For example, perhaps a particular item identified in your FMECA has a high severity or is frequently occurring. In this case, you may decide that a dedicated and detailed Fault Tree Analysis is in order.
The development of your fault tree is greatly aided due to all the data already available from your prediction analysis and FMECA. The targeted high-risk item represents the top-level event of a fault tree and the failure modes represent the events contributing to this top-level event. Also, the probabilities of the contributing events are available from the failure mode failure rate values from your FMECA.
With all this information already in hand, the development of the initial fault tree is significantly streamlined. You can then complete a full Fault Tree Analysis, adding additional details as needed and further defining event models and probabilities.
You can repeat this approach and use Fault Tree Analysis for any additional items you would like to further analyze.

Case Study: Using Relyence to Effectively Integrate Reliability Prediction Analysis, FMECA, and Fault Tree Analysis
Using an easy-to-understand example of the GPS module of a personal drone, we’ll look at how Relyence Reliability Prediction, FMECA, and Fault Tree Analysis software tools provide an integrated approach for analysis.
Step 1: Performing Reliability Prediction Analysis with Relyence Reliability Prediction
We can either import the GPS BOM list or enter the parts of the GPS directly into Relyence Reliability Prediction. We then perform a calculation to obtain the failure rates of the component parts of the GPS module and the entire drone system.

Step 1: Use Reliability Prediction to compute failure rate values.
Step 2: Completing the FMECA with Relyence FMEA
Because we are using the Relyence Studio platform, our drone and included GPS are automatically available when we move to the FMECA module.
In this case, we have enabled the usage of the FMD database. Therefore, as our component parts were entered, the failure modes and associated data are automatically retrieved and available in the FMECA Worksheet.
Looking at the feedback capacitor, notice that 3 failure modes and their failure mode percentages are designated: Short (50%), Open (12.5%), and Other (37.5%). These values in combination with the failure rates computed from our reliability prediction analysis provide the failure mode failure rates for the capacitor.
Now, it’s time to complete the remainder of the FMECA Worksheet.

Step 2: Complete FMECA.
Step 3: Use Relyence Fault Tree for Analysis of High-Risk Events
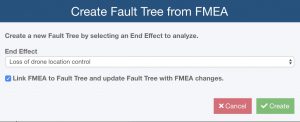
For this example, we decide that we want to delve deeper into the “Loss of drone location control” effect.
Because we are using the Relyence integrated Studio platform, we can easily create a fault tree from our FMECA. From the Relyence FMECA, click the Create FT button in the toolbar and select “Loss of drone location control” from the dropdown choice list in the Create Fault Tree from FMEA dialog that appears.

You can automatically generate fault trees from Relyence FMEA.
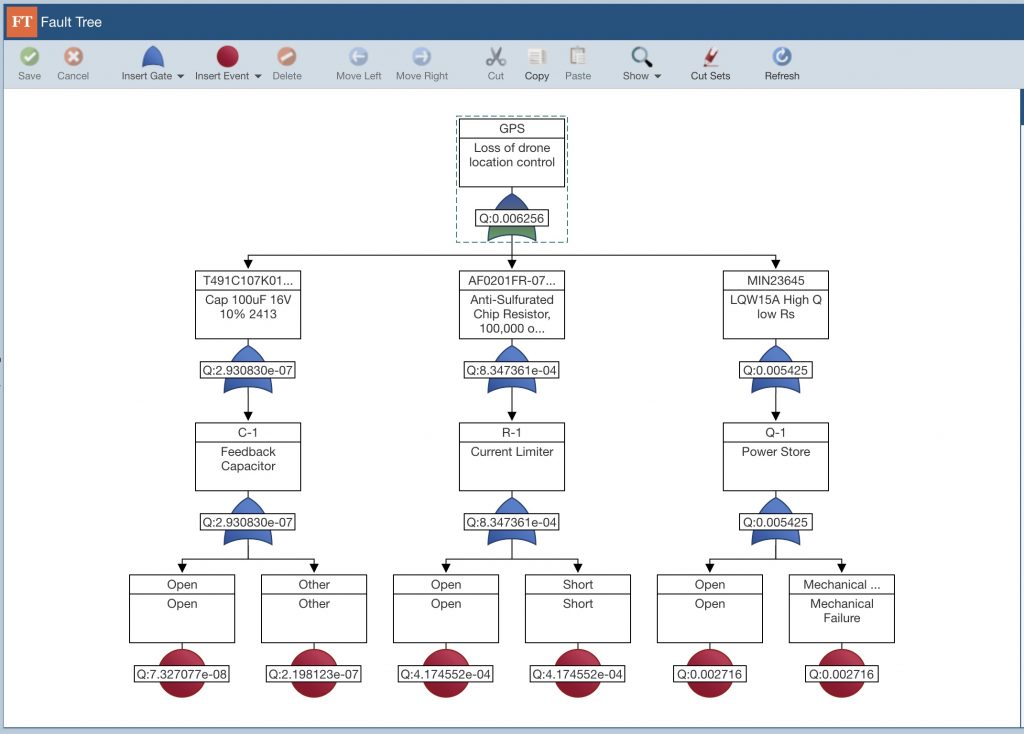
Relyence automatically generates a fault tree with all the data from the FMECA Worksheet. The fault tree includes all the data obtained from the Reliability Prediction analysis as well. With all this information already populated in the fault tree, you can calculate fault tree risk metrics.

Automatically generated fault tree from Relyence FMEA.
You can then use Relyence Fault Tree to extend your analysis as you prefer. You can add in more details, refine the event models, and modify the tree construction as needed.
Conclusion
As noted, there are a number of reliability engineering software tools available to help you predict, analyze, and improve your system reliability and quality. Each has its own unique benefits and advantages and can be used as a stand-alone tool. However, as can be seen in the example case study, data can often be shared across various analysis tools. By taking advantage of data integration capabilities, you gain multiple benefits – minimizing duplicate data entry, maximizing the efficiency of your analyses, and meeting your product improvement objectives. To learn about additional opportunities to integrate your RAMS tools, see our informative whitepaper.
By using a reliability tool platform that is designed with these integration points in mind, your analyses are not only efficient, but are uniquely linked for data integrity and organization.
As you can see from our case study, Relyence was designed and built around the concepts of an integrated approach to reliability analysis. In addition to the capabilities described in the example, Relyence Studio also offers a number of additional innovative integration features across our tool suite.
Learn more about Relyence Reliability Prediction, Relyence FMEA, and Relyence Fault Tree, or our integrated Relyence Studio suite – sign up today for your own no-hassle free trial. Or, feel free to contact us to discuss your needs or schedule a personal demo.


