
This article is an excerpt from our “A Deep Dive into System Modeling using Reliability Block Diagram (RBD) Analysis” white paper.
Reliability Block Diagram (RBD) analysis is a methodology for assessing and calculating the reliability and availability metrics of complex systems using a graphical depiction of the system. RBD techniques are most often employed to model complex systems, especially those that incorporate redundant components and repair data. Within RBD, there are several component models and calculation metrics available to ensure complete and accurate system analysis is obtained. Our article discusses these various options in technical detail.
Our blog post A Guide to System Modeling Using Reliability Block Diagram (RBD) Analysis is a helpful introductory overview of RBD concepts. In it, we explore the fundamentals of RBD analysis and how it can be used to calculate a variety of system reliability and availability metrics. We discuss the benefits of RBD, how it can be used in certain fields, and detail the steps involved in performing RBD analysis. For further information on the basics of system modeling using RBD analysis, be sure to check out the blog post or the Relyence RBD product webpages.
Component Modeling & Organization
There are several important elements to consider when performing RBD analysis. We will take a look at some of the most useful features available to make your analyses most effective. They include redundant configurations, switching characteristics, failure and repair distributions, and subdiagram organization.
Redundant Configurations
One of the main benefits of RBD analysis is that it allows you to perform reliability and availability calculations for systems that include redundant components. Redundancy in terms of RBD analysis means that when a component or path fails, a secondary component or path can take over to keep the system up and running. This is a key difference compared to Reliability Prediction analysis where a component or system’s failure characteristics are calculated independent of any redundancies.
When redundant relationships need to be modeled in RBD, redundancy type and switching behavior are taken into account. Redundancy type is specified by the component configurations that are defined in the graphical diagram.
Switching Characteristics
In systems involving redundant components, switches can be implemented to change to backup components upon primary unit failure. Ideally, switches would always successfully connect to the backup units and make the change over immediately. However, depending on the switching mechanism there may be some chance of switch failure or switch delay. For the most accurate component modeling, these variables must be taken into account in RBD analysis if appropriate.
Failure and Repair Distributions
When modeling systems using RBD techniques, common statistical profiles are used to describe the failure and repair behavior of individual components. Fitting failure and repair times to statistical distributions can be done in several ways:
- If using predictive tools, such as Reliability Prediction or Maintainability Prediction analysis, the calculated Failure Rate, MTBF, and MTTR can be used in RBD.
- If using statistical fitting tools, such as Weibull or ALT analysis, the calculated distribution coefficients can be used to model failure and repair characteristics in RBD .
- If using a corrective action tracking system, such as FRACAS, field-based MTBF and MTTR data can be used in RBD.
- If not using other reliability tools, other estimation methods such as known similar product performance, maintenance expertise, or manufacturer specifications can be used in RBD.
By supporting a range of distributions, RBD allows you to most accurately model the characteristics of your components for precise analysis.
Subdiagram Organization
RBD analysis allows components to be grouped into subdiagrams for organized diagram management. A subdiagram is most often a group of components that comprise an individual subsystem under the main system. For example, if you are analyzing a car, you may set up subdiagrams to model the engine, steering assembly, braking system, etc. Subdiagrams can be given their own RBD and are represented in their parent diagram by a single block. In this way, subdiagrams help to manage, organize, and maintain your RBD by offering a more compact visual view of your overall system. Subdiagrams can be especially useful to more efficiently represent complex diagrams.
An additional benefit to subdiagrams is to support reusability in cases where a subsystem is used in more than one place. Subdiagrams allow you to build one subsystem RBD that will be shared in all places that subdiagram is referenced.
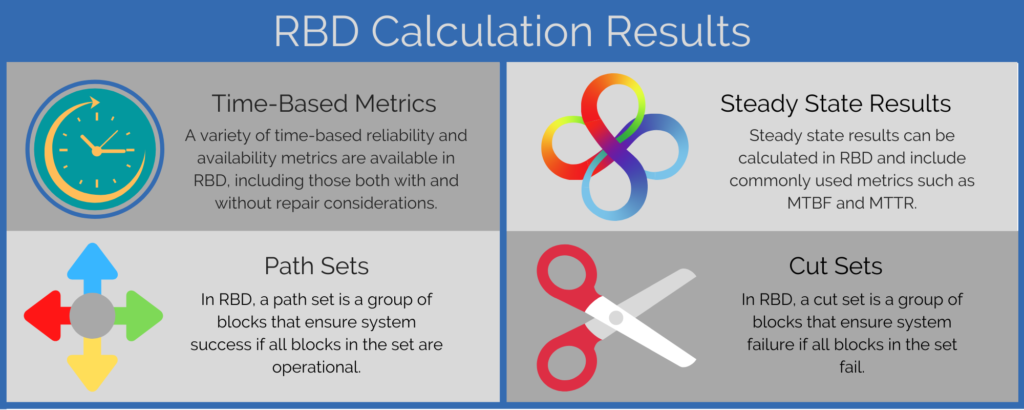
RBD Calculation Results
To perform its calculations, RBD analysis relies on a powerful calculation engine that takes into account the component arrangement and all defined failure and repair models. Depending upon the complexity of the diagram, RBDs may be evaluated using analytical techniques, Monte Carlo simulation, or a combination of the two. RBD calculation engines support a host of both time-based and steady state reliability and availability related metrics. Calculated metrics can be selected depending on the specific needs or requirements of the system under consideration.
In addition to system reliability and availability metrics, RBD analysis can include computations that help identify key components or groups of components in a given system. Results from these calculations can be used to denote paths of successful system operation or to discover critical components or groups of components that can lead to system failure.
For an in-depth look at the system modeling procedures and calculation options that are available in RBD, download the white paper.
Learn More about System Modeling with RBD
“A Deep Dive into System Modeling using Reliability Block Diagram (RBD) Analysis” covers the following topics:
- System Modeling with RBD Analysis
- Component Modeling & Organization
- Redundant Configurations
- Switching Characteristics
- Failure and Repair Distributions
- Subdiagram Organization
- RBD Calculation Results
- Time-Based Metrics
- Steady State Results
- Calculation Inputs
- Path Sets
- Cut Sets
- RBD as Part of your Reliability Analysis Platform
- Leveraging Failure Data in RBD
- Reliability Prediction and RBD
- Weibull and RBD
- Leveraging Repair Data in RBD
- Maintainability Prediction and RBD
- FRACAS and RBD
- Leveraging Failure Data in RBD
- Using RBD Dashboards for High-Level Overviews
- Relyence RBD Dashboard Widgets
- Example RBD Analysis
- Conclusion
Download the full white paper here. If you are interested in learning more about Relyence software, contact us or start your free trial today!