This article is an excerpt from our “Reliability Prediction Analysis: More Than MTBF” white paper.
Reliability Prediction analysis is one of the most common techniques used by engineers for reliability assessment. Reliability Prediction provides a methodology for predicting the failure rate or MTBF (Mean Time Between Failures) of a product or system. Typically, Reliability Predictions are performed early in the design cycle to evaluate predicted product reliability. The results of the analysis can then be used to target potential areas for improvement. This can be critical in cases where MTBF goals are contractually mandated or required for compliance. However, even without contractual requirements, many organizations use Reliability Predictions to design-in reliability in order to ensure their products meet performance objectives.
The core objective of Reliability Prediction analysis is to provide an estimate of your product failure rate. This is an important element for reliability assessment and continuing improvement efforts. However, the investment in Reliability Prediction analysis can go beyond failure rate and MTBF assessments. Our white paper looks at various ways you can extend your Reliability Prediction analyses to gain even more benefit from this useful technique.
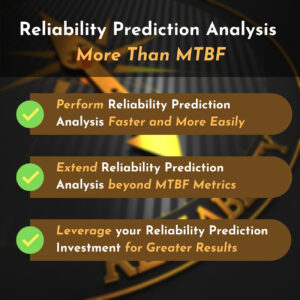
Our white paper describes three key ways Reliability Prediction analyses can be augmented for greater efficiency and effectiveness by:
- Reviewing techniques that enable you to perform your Reliability Prediction analyses faster and more easily.
- Explaining the most common ways Reliability Prediction analyses can be extended to include other types of analyses.
- Detailing the ways you can leverage the benefits of Reliability Prediction analyses into your overall reliability and quality program.
Analyze Overstressed Conditions with Derating Analysis
As described in the white paper, one of the ways you can extend your Reliability Prediction analysis is by incorporating derating analysis.
Derating is a means to prolong a component’s life by ensuring it operates below its recommended maximum rated capacities. On component data sheets, electronic device manufacturers include maximum ratings for common stresses such as power, current, or voltage. By operating at less than the maximum stresses, devices last longer. This means that failures occur less frequently, and therefore, product reliability is improved.
Part of the information required to perform Reliability Prediction analysis is the operating stresses of the system’s components. Combining this available information with the components’ derating profiles enables you to perform derating analysis alongside your Reliability Prediction analysis. Derating analysis evaluates the operating stresses components are subjected to and then identifies those that are above acceptable levels.
There are derating standards which are commonly used to perform derating analysis – these include:
- MIL-STD-1547
- MIL-STD-975M
- TE000-AB-GTP-010
These standards include derating profiles for a wide range of devices. A derating profile defines the stress ranges within which a device should operate. Operating outside the ranges defined in the derating profile results in an overstressed device. The characteristics of a derating profile vary. For example, a derating profile may be a simple value: a specific type of resistor operating over 75% of maximum power is considered overstressed. Or it may be more complicated, as shown in the derating curve profile below. Using the nominal derating curve, the device is overstressed if operating above 80% stress when below 25 degrees. At 25 degrees, the overstress level varies linearly depending on temperature. At 50% stress the device is not overstressed until the temperature is over 50 degrees. It is also common to consider both nominal and worst-case scenarios when performing derating analysis.
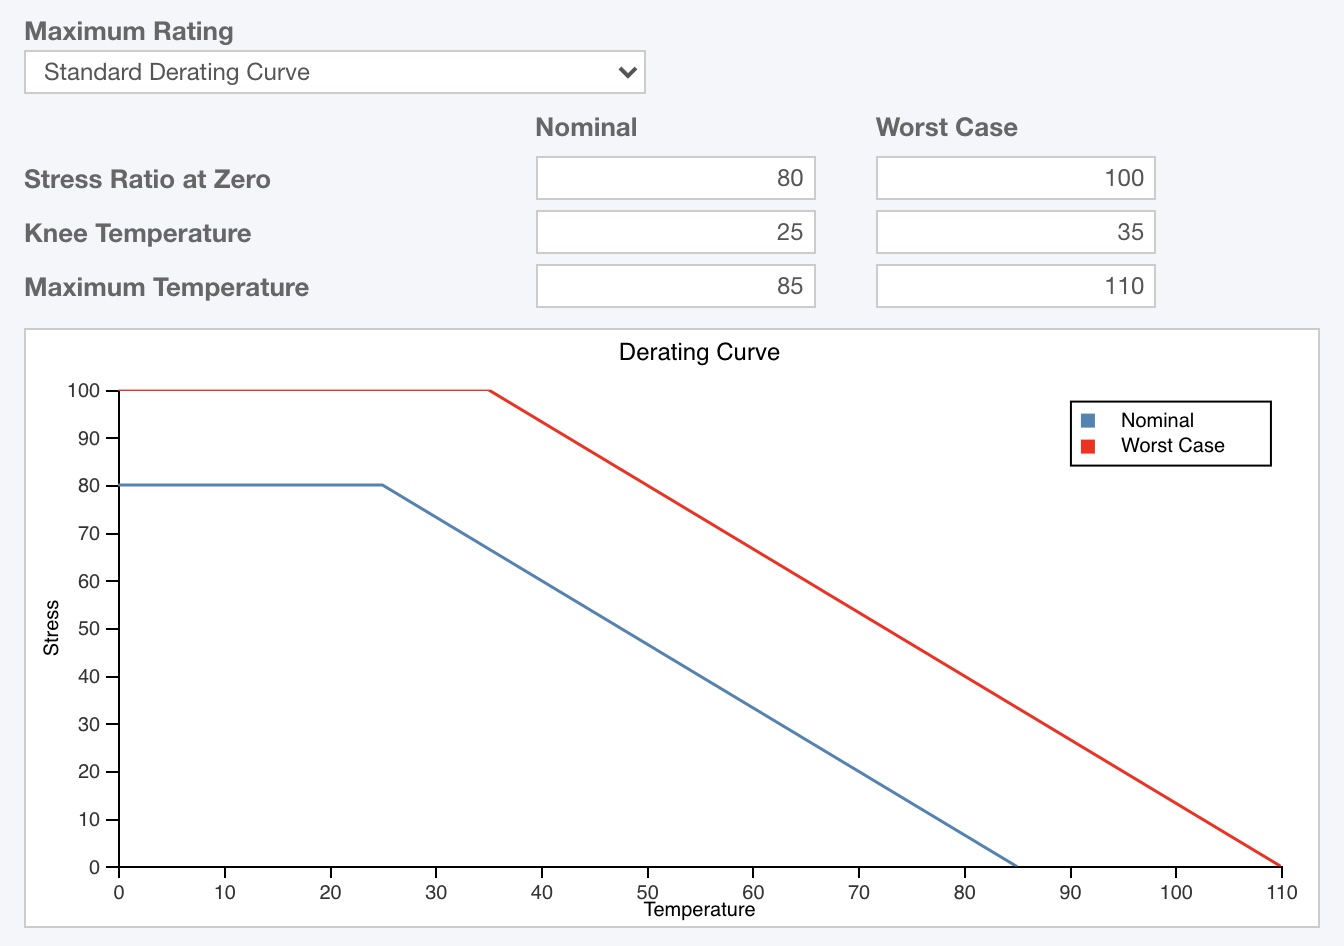
Example derating curves for nominal and worst-case overstress conditions for a capacitor.
Relyence Reliability Prediction automatically performs derating analysis during failure rate calculations. Any components exceeding their stress limitations are flagged and appear in red on your tables and reports. Using the Relyence Pi Factors feature, you can view the specific overstress condition for any component in your analysis.
In addition to supporting the commonly used derating standards, you can define your own completely custom derating profiles in Relyence Reliability Prediction.
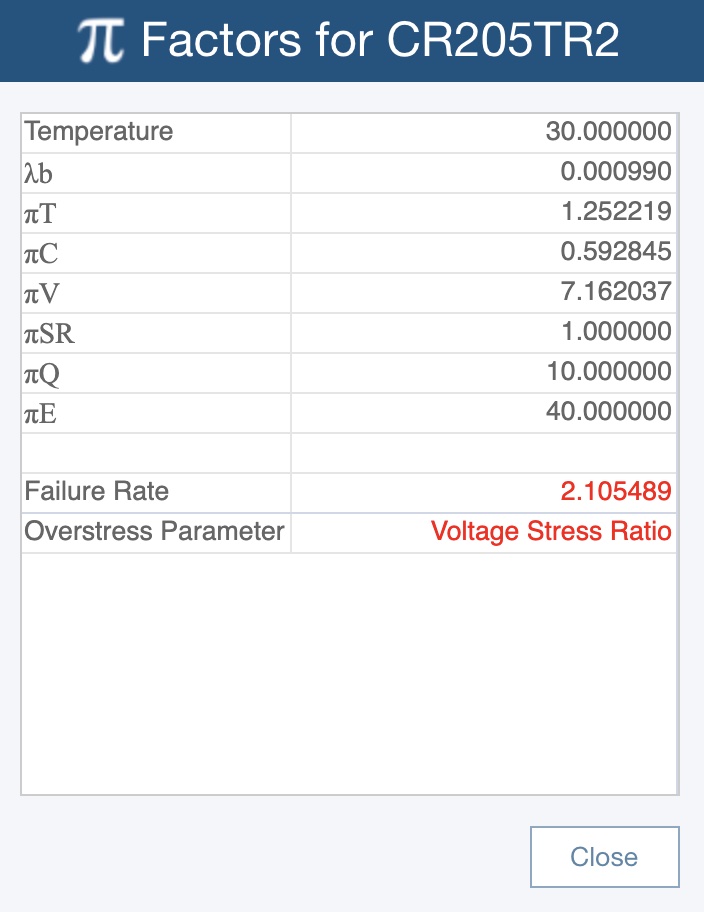
Specific overstress conditions are noted on the Pi Factors dialog in Relyence Reliability Prediction.
To learn more about other ways to extend your Reliability Prediction analyses, download the white paper.
Discover More
Reliability Prediction Analysis: More Than MTBF covers the following topics:
- What are Reliability Prediction Standards?
- Reliability Predictions: Beyond the Standards
- Performing Reliability Prediction Analyses Faster and More Easily
- Employ Parts Count Analysis
- Using Reliability Prediction Parts Count Analysis in Early Design
- Use Default Data Values
- Take Advantage of Component Libraries
- Databases of Component Failure Rates
- Parts Libraries for Off-the-Shelf Components
- Customized Parts Libraries
- Utilize Intelligent Part Mapping
- Develop Knowledge Banks
- Employ Parts Count Analysis
- Extending Your Reliability Prediction Analyses
- Analyze Overstressed Conditions with Derating Analysis
- Determine Allocations
- Evaluate Mission Success
- Create and Use Formulas
- Perform What-If? Trade-off Studies
- Leveraging Reliability Prediction Data
- Integrate with Other Reliability Tools
- Reliability Prediction and RBD
- Reliability Prediction and FMECA
- Weibull Analysis and Reliability Prediction
- FRACAS and Reliability Prediction
- Create Dashboards for Overview and Insight
- Integrate with Other Reliability Tools
Download the full white paper here. To learn more about Relyence Reliability Prediction and all our additional reliability and quality tools in our Relyence Studio platform, feel free to contact us or schedule a personalized demonstration webinar. Or give us a free trial run today!