This article is an excerpt from our “Fault Tree Analysis as a Means to Promote Safety” white paper.
Safety is a key element in product design and is a vital aspect of design engineering. It is one of the core elements of RAMS programs, or the study of reliability, availability, maintainability and safety in product design and manufacturing. In particular, safety analysis seeks to eliminate or mitigate overall risk by evaluating ways to prevent harm to people and the environment by a product, system or process.
There are various risk assessment techniques used for safety analysis. They include Fault Tree Analysis (FTA), Failure Mode and Effects Analysis (FMEA) or Failure Mode, Effects and Criticality Analysis (FMECA), Event Tree Analysis (ETA), What-If analysis, Hazard and Operability analysis (HAZOP), Incident BowTie, and others. FTA is a deductive procedure used to determine the various combinations of hardware failures, software failures, human errors, and other events that could cause undesired events (referred to as top events) at the system level.
This article focuses on providing an introductory look at FTA and its role in promoting safety. We review basics about FTA, including what it is, its history, its uses, and advantages. A thorough review of qualitative and quantitative FTA results, including minimal cut sets (MCS), quantitative metrics such as unavailability, and importance measures, is included. The article concludes with general guidance on how FTA qualitative and quantitative results can be used to design inherently safer products and systems.
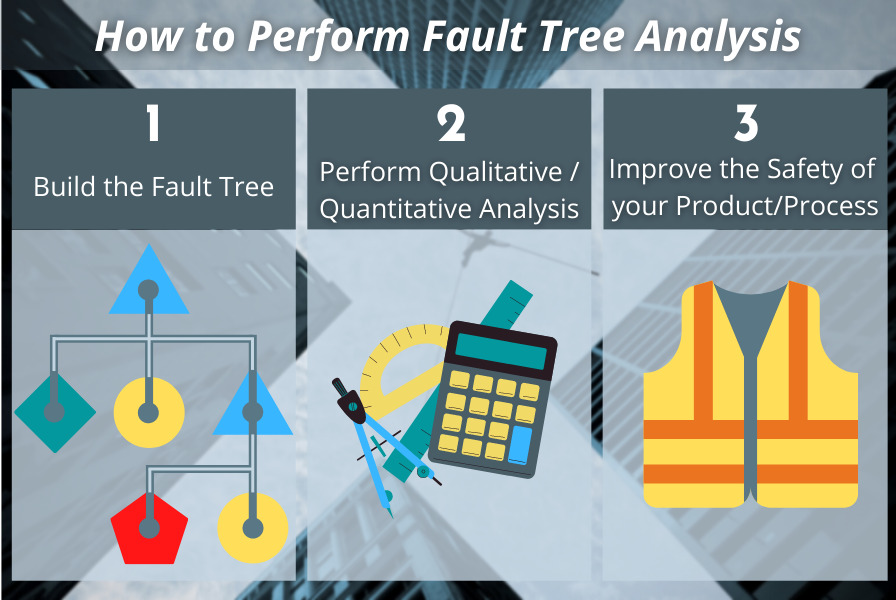
Included in our white paper is an example of the usage of FTA as part of the safety analysis for a potential safety hazard of a vehicle engine compartment fire. We proceed in a step-by-step manner through the FTA process to mitigate the risk of this hazard:
- Building the Fault Tree by defining the top-level event then proceeding to define and develop contributing factors to that top event
- Performing qualitative and quantitative analysis including cut sets, calculation metrics, and importance measures
- Taking the steps required to improve the safety of the product or process
Understanding Logic and Event Symbols
To effectively use FTA, you need to understand the basics of the Logic and Event symbols used in fault tree analysis. You will need to use both Logic symbols and Event symbols.
Logic symbols, like Boolean AND and OR gates, can help you to link branches of the fault tree together.
- The AND gate is used to indicate that the output, or the event represented by the AND gate, occurs if and only if all input events occur.
- In a simple 2-input example, a text message fails to send (the undesired event) if one cannot connect to Wi-Fi (one input event) AND there is no cellular signal (a second input event). So, we’d have two Event symbols connected by the AND Logic symbol.
- The OR gate is used to indicate that the output, or the event represented by the OR gate, occurs if and only if at least one of the input events occur.
- For example, you might lose control of a drone if you fly too far out of range (one input event) OR a strong wind gust occurs (a second input event). Either of those events or both can cause the event represented by the OR gate (loss of control of the drone) to be true.
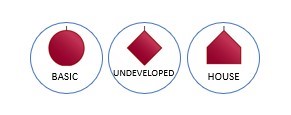
Event symbols are used to represent primary or simpler events. They are terminal events in any fault tree branch. Commonly used types are Basic and Undeveloped events.
- Basic events are most commonly used to model hardware failures (i.e., capacitor C12 fails short), software failures, human errors, and other terminal events.
- Undeveloped events are much like Basic events, but often are used to represent events that could be further developed (if time and resources allow and the need arises).
- Examples of basic and/or undeveloped events include:
- Cannot connect to Wi-Fi
- No cellular signal
- Fly too far out of range
- Strong wind gust occurs
In the generic fault tree pictured here, we have both Logic symbols and Event symbols as well as text to help define the Top, Intermediate and Terminal events.
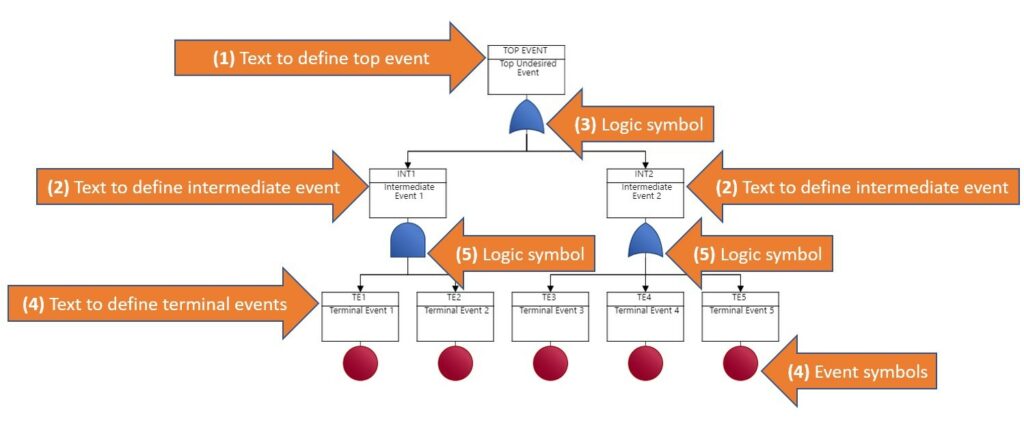
- The text that defines the undesired top event.
- The text that defines the contributors to that top event, some intermediate events.
- Logic Symbols define how those events, alone or in some combination, impact the next higher event.
- Terminal events for each branch (text-based descriptions included) are all defined with their Event symbols.
- Logic symbols that define how the terminal events contribute to the intermediate events.
This is just a simple fault tree used for explanation purposes. Fault trees can grow quite large and contain many levels and branches.
And while AND and OR gates are the most commonly used Logic symbols and Basic and Undeveloped events are the most commonly used Event symbols, there are others you can incorporate where needed. Many of the most common examples of Logic symbols and Event symbols are pictured below.
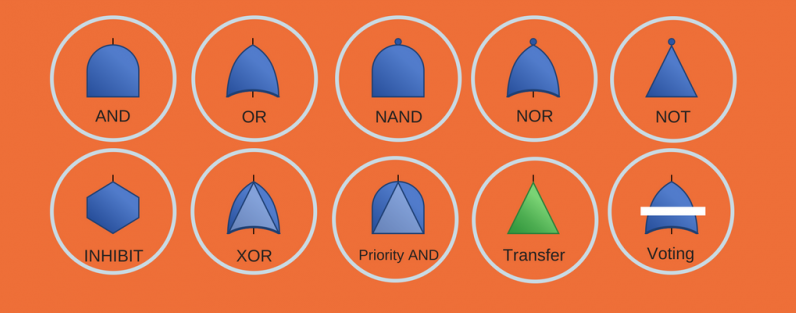
Learn more about Logic gates and Event symbols in our in-depth overview.
To learn more about the construction of Fault Trees and their uses as part of your safety analysis processes, download the white paper.
Discover More
Fault Tree Analysis as a Means to Promote Safety covers the following topics:
- What is Safety Analysis?
- Historical Roots of Safety Analysis
- The Need for Safety Analysis
- Risk Assessment Techniques Used for Safety Analysis
- What is Fault Tree Analysis?
- Are you New to Fault Tree Analysis?
- History of Fault Tree Analysis
- Uses of Fault Tree Analysis
- Benefits of Fault Tree Analysis
- Challenges of Fault Tree Analysis
- Fault Tree Analysis Basics
- Understanding Logic and Event Symbols
- Preparing for Fault Tree Construction
- Understanding Rule and Conventions for Fault Tree Construction
- How to Perform FTA: A Step-by-Step Example
- Step 1: Build the Fault Tree
- Define the Top-Level Failure or Event
- Define Contributing Factors to the Top-Level Failure
- Develop the Contributing Factors
- Step 2: Perform Qualitative and/or Quantitative Fault Tree Analysis
- Evaluate Cut Sets
- Calculate Metrics
- Analyze Importance Measures
- Step 3: Take Steps to Improve the Safety of your Product or Process
- Using Minimal Cut Set Analysis to Improve Safety
- Using Fault Tree Analysis Metrics to Improve Safety
- Using Reliability Importance Measures to Improve Safety
- Step 1: Build the Fault Tree
- Conclusion
Download the full white paper here. To learn more about Relyence Fault Tree and all our additional reliability and quality tools in our Relyence Studio platform, feel free to contact us or schedule a personalized demonstration webinar. Or give us a free trial run today!