We’re starting off 2024 with an exciting new edition of our industry-leading web-based tool suite! Relyence 2024 Release 1 adds powerful new features for several of our products that will allow you to take your RAMS analyses up another notch! Relyence Reliability Prediction and Relyence Fault Tree now support additional calculation standards and we’ve introduced powerful new enhancements in Relyence RBD, Relyence FMEA, and Relyence FRACAS. Read on to learn more about this exciting new release or watch our highlights video for a high-level overview.
New! Relyence RBD Plots
Relyence RBD provides a powerful system modeling and calculation tool to perform your reliability block diagram (RBD) analyses. It includes various statistical failure and repair distributions that can be used to describe component behavior, the ability to model various types of redundancies, and optionally, the ability to integrate with Relyence Reliability Prediction and Relyence Weibull to seamlessly pull component data into your RBD analyses. Its powerful calculation engine can be used to compute a variety of time-based and steady state reliability and availability metrics using analytical methods or with its built-in Monte Carlo simulation capabilities. Additionally, the smart layout capability allows you to create visually impressive system diagrams with accuracy and efficiency.
Now included in Relyence RBD with Relyence 2024 Release 1 is the ability to create plots of your calculated RBD data and metrics. RBD plots allow you to easily visualize your system performance over time by providing a visual representation of various time-based metrics. Also included are supplemental plot types, PDF Plot and Simulation Convergence, that allow you to gain insight into Relyence RBD’s calculations. To view RBD plots, simply select the RBD Plots tab at the top of Relyence RBD, choose your desired Plot Type, define any appropriate calculation parameters, and click Calculate.
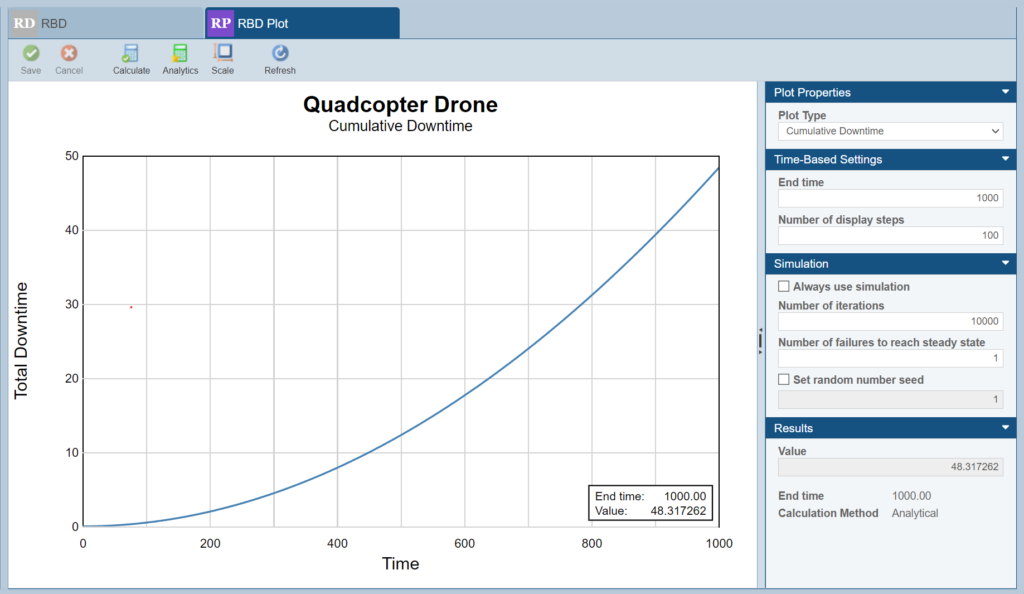
RBD plots allow you to easily visualize your system performance over time.
Supported Plot Types
Multiple time-based metric results can be visualized with plot types such as Availability vs Time, Reliability vs Time, Failure Rate vs Time, Total Downtime and more. RBD Plots can be helpful in various system improvement efforts, such as:
- Taking action to analyze and then mitigate or prevent upticks in downtime using the Total Downtime Time plot.
- Ensuring that your repairable system never drops below a given Availability target using the Availability vs. Time plot.
- Targeting system improvement efforts to address early-life failures or wear-out revealed on the Failure Rate vs. Time plot.
Relyence RBD also offers a Simulation Convergence plot, which represents the precision of your simulated results at a given iteration count. This plot can be used to estimate how many iterations should be used in order to achieve accurate results for an RBD simulation calculation. As the Simulation Convergence plot line approaches the zero axis, the given number of iterations at that point indicates results stability. A high simulation iteration count ensures result stability, but can lead to lengthy calculation time, especially for complex RBD models. Therefore, this plot is useful to enable you to determine an optimal iteration count for your RBD calculations.
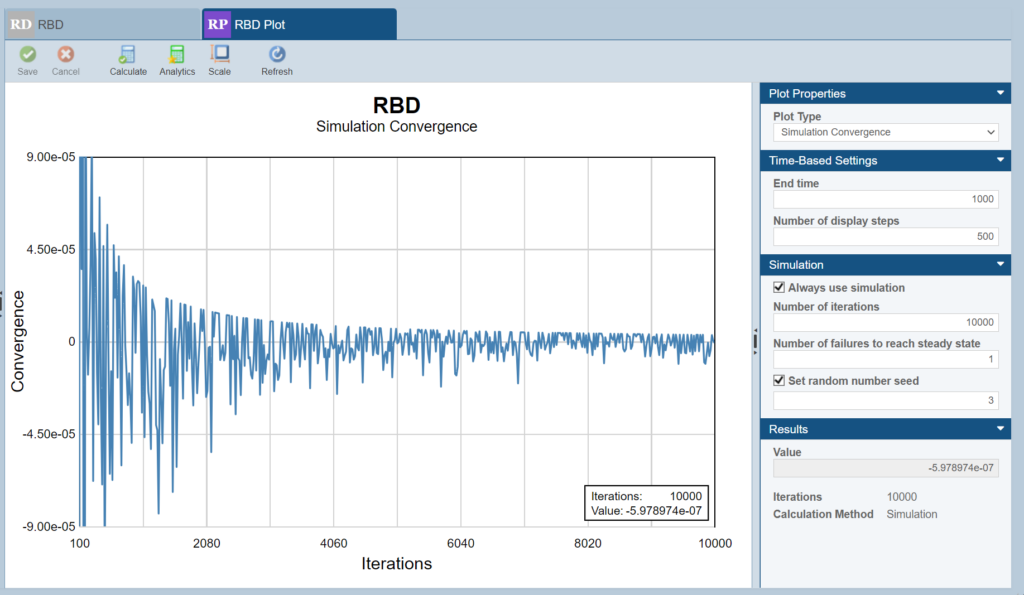
The Simulation Convergence plot now included in Relyence RBD represents the precision of your simulated results at a given iteration count.
New! SAE ARP4754A / ARP4761 Support in Relyence Fault Tree
The SAE documents ARP4754A, entitled “Guidelines for Development of Civil Aircraft and Systems”, and ARP4761, entitled “Guidelines and Methods for Conducting the Safety Assessment Process on Civil Airborne Systems and Equipment”, provide recommendations and techniques for performing safety analysis on civil aircraft and systems to assess their safety performance throughout their lifecycle. The documents differ in their intended scope, with ARP4754A providing broader information on the development of aircraft systems, from design to operation, while ARP4761 focuses its efforts on the safety assessment process. When used together, ARP4754A and ARP4761 provide guidelines that aid in establishing a systematic and comprehensive approach to safety assessment, helping to identify and address potential safety issues in the design, development, and operation of aircraft systems.
SAE ARP4754A and ARP4761 provide information on various techniques that are used as part of the aircraft safety assessment process, including using Fault Tree Analysis (FTA) to perform techniques such as the Preliminary System Safety Assessment (PSSA) and System Safety Assessment (SSA) defined in the standards. When performing FTA based on the ARP4754A and ARP4761 guidelines, the top event is often an undesired event that occurs within a flight, such as an equipment malfunction or faulty reading. As such, FTA calculations are often given as the probability of the top-level event occurrence per flight or per flight hour.
Relyence Fault Tree now can perform FTA based on the ARP4754A and ARP4761 guidelines. For new FTAs, simply select the “Perform SAE ARP4754A/ARP4761 FTA” checkbox. The option is also available on existing Relyence FTAs if your analysis meets the acceptable criteria.
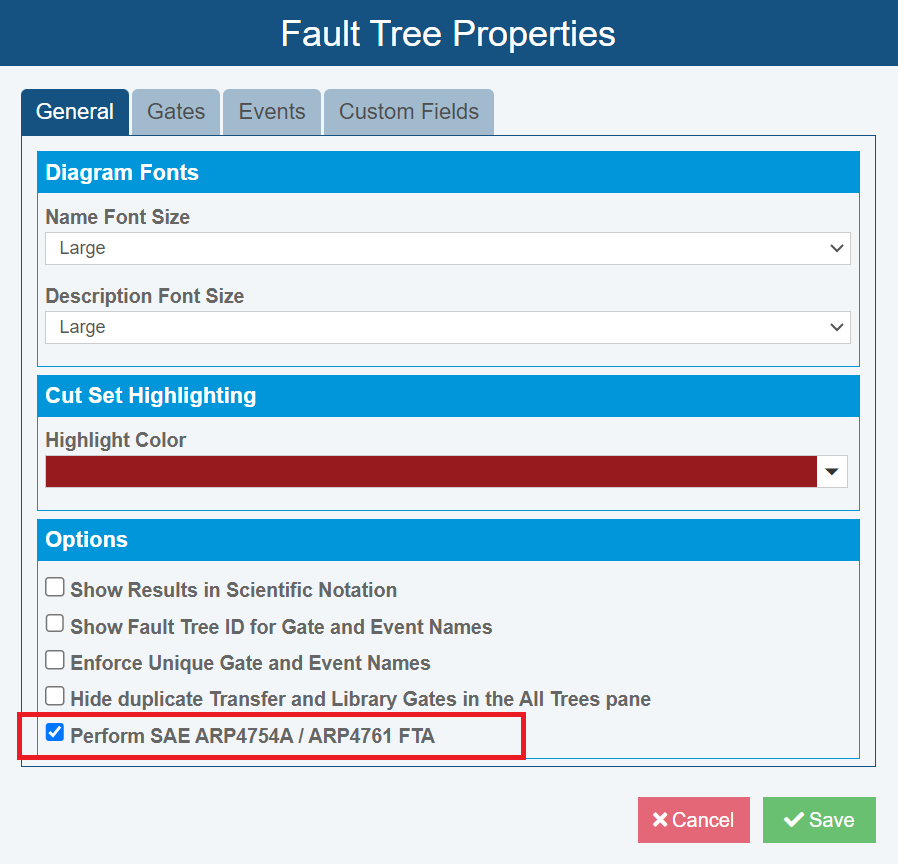
Relyence Fault Tree now can perform FTA based on the ARP4754A and ARP4761 guidelines.
When performing FTA based on the ARP4754A/ARP4761 guidelines, the calculated results include Average and Worst Case Probability per Flight, Average and Worst Case Probability per Hour, and Mission Probability.
Exposure Time
As defined in ARP4761, Exposure Time, also known as “at risk time,” is “the period of time between when an item was known to be operating properly and when it will be known to be operating properly again.” Exposure Times can vary widely depending on the Event in question and can depend on aspects such as inspection intervals, maintenance activities, etc.
To define an Exposure Time on a Basic Event in an ARP4754A/ARP4761 Fault Tree in Relyence Fault Tree, check the Set Exposure Time checkbox and then define the Exposure Time, in hours, in the Calculation Parameters pane.
Latent Failures
A latent failure is one that is not detected upon its occurrence. By themselves, latent failures do not constitute a safety hazard and their effects are not noticeable if they occur. However, latent failures often affect functions that are fail-safe or protective in nature and thereby, their occurrence increases the risk of a safety hazard. Latent failures may be detected by means of running a self-test or by performing a maintenance inspection.
To set an Event to be a Latent Failure in an ARP4754A/ARP4761 Fault Tree in Relyence Fault Tree, check the Latent Failures checkbox in the Calculation Parameters pane.
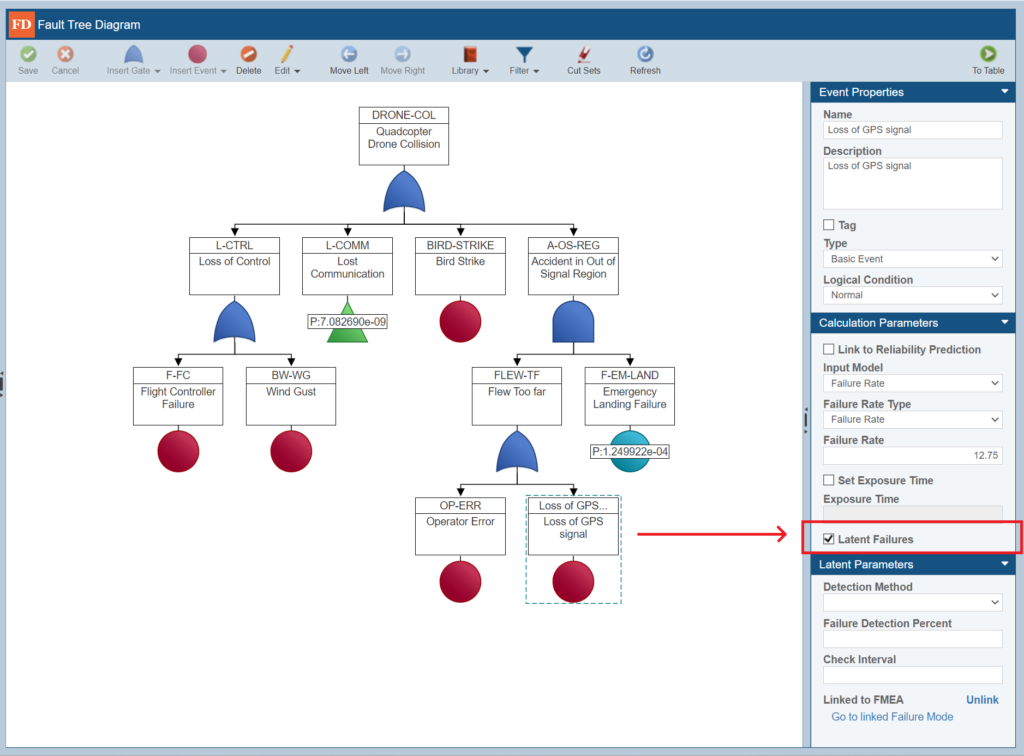
Check the Latent Failures checkbox in the Calculation Parameters pane to set an Event to be a Latent Failure.
If latent data is applicable, the following details can be added in the Latent Parameters pane:
- Detection Method: Defines the procedure used to detect the latent failure. The options are:
- Self Test: A procedure that is performed, often during power-up or pre-flight, to uncover the occurrence of a latent failure.
- Monitored: A method to detect the latent failure is in place, such as software, hardware, or other test methods. Use the Monitors Pane to enter information about the type of monitor in use.
- Unmonitored: No method to uncover a latent failure due to the failure of the monitor. In this case, the consequences of the latent failure are often the most severe.
- Failure Detection Percent: Defines the probability as a percentage that the check will uncover the latent failure once it has occurred.
- Check Interval: Defines the period of time, in hours, between inspections of the latent failure.
Monitor Parameters
In the Monitor Parameters pane, Relyence allows you to define the Failure Rate, Scrub Time and Scrub Verification Percent, and Check Interval of the monitor. Additionally, Relyence offers a Monitor Library that allows you to save a monitor with its associated parameters for later use. The Monitor Library can be accessed by selecting Libraries > Monitors in the sidebar of Relyence Fault Tree or by selecting the Monitor field in the Monitor Parameters pane.
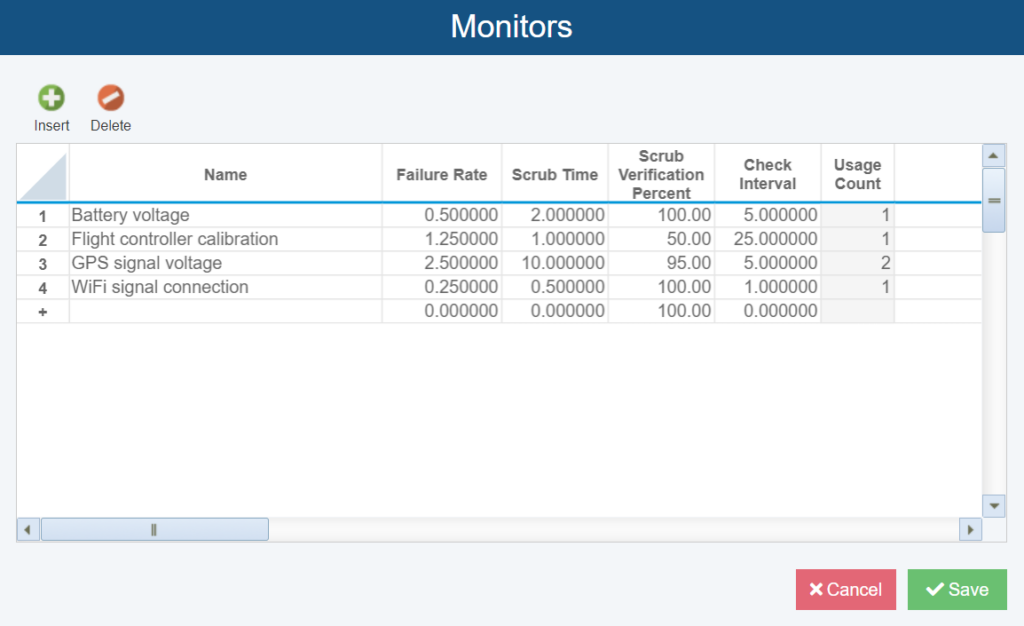
The Monitor Library allows you to save a monitor with its associated parameters for later use.
Note that, if using the same monitor in multiple locations in your Fault Tree, Relyence Fault Tree assumes those monitors are Repeats. That is, they will be treated as the same monitor in calculations. If that is not the case, the Non-Repeat Monitor option allows you to calculate the selected monitor as a separate item. This option allows you to efficiently share Monitor Parameters while calculating monitors as their own unique copy.
Sequencing Gate
When using the AND gate in FTA, the logic used in calculations is that the order of occurrence of the underlying events does not matter. However, this may not always be the case. For example, if I (1) fly my drone over water and then (2) the battery runs out of power in that sequence, my drone will be unrecoverable. For these situations, ARP4761 specifies that a Required Order Factor (ROF), also known as a Sequencing Factor, can be used to handle failure order dependent events.
When performing FTA based on ARP4754A/ARP4761 in Relyence Fault Tree, failure order dependent events can be implemented by using the Priority AND gate. When a Priority AND gate type is chosen, you can then specify the required order parameters including Required Order Factor and Number of Valid Sequences in the Calculation Parameters pane.
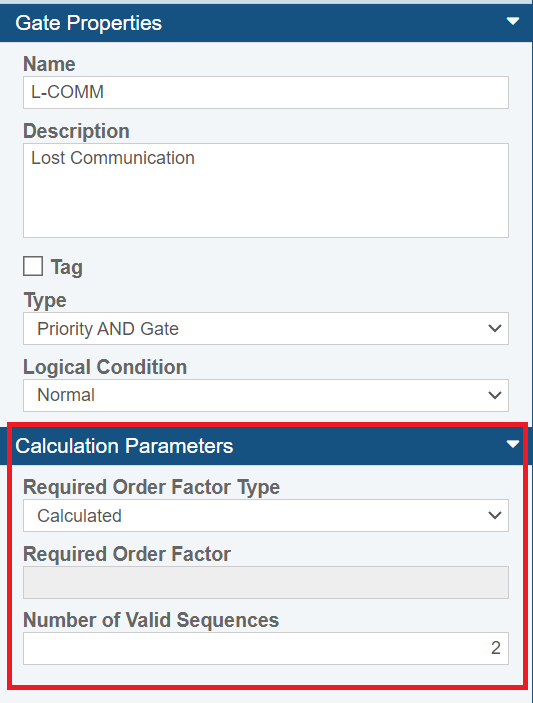
When a Priority AND gate type is chosen, you can then specify the appropriate sequencing information in the Calculation Parameters pane.
New in Relyence Reliability Prediction
Relyence Reliability Prediction supports the most widely accepted standards for your MTBF (Mean Time Between Failure) analyses, including MIL-HDBK-217, Telcordia Issue 4, and NSWC-11 Mechanical. Relyence 2024 Release 1 expands on these options by offering support for the newest NPRD database and IEC 61709 failure rate calculations in Relyence Reliability Prediction.
Support for NPRD 2023
Relyence 2024 Release 1 now includes the option to add support for the most up-to-date version of the Nonelectronic Parts Reliability Data database – NPRD 2023. The NPRD database includes statistical information about failure rates and life expectancy for various nonelectronic components such as mechanical components, connectors, fasteners, seals, and other parts used across industries. The list of included parts is extensive and represents a wide variety of components and sources.
NPRD can be used by analysts to determine the failure rates of nonelectronic elements that may not be modeled in a calculation model such as MIL-HDBK-217, thus helping to calculate the failure rate of an overall system that incorporates such nonelectronic elements. By offering component data that may not be modeled in other calculation standards, NPRD can help ensure accuracy in your reliability predictions by including all elements in the system failure rate calculations.
For example, you may be using MIL-HDBK-217 as a foundation for your failure rate calculations. However, your system under analysis includes a type of rotor that is not modeled in MIL-HDBK-217. With the Search Parts dialog, you review the NPRD 2023 database and see that NPRD 2023 includes failure rate models for Rotors. Relyence Reliability Prediction then allows you to review all appropriate NPRD Details, including information on where the data is sourced from, to make your decision on the appropriate rotor part to add to your analysis. You can then easily add the Rotor into your analysis to ensure an accurate assessment of your product reliability.
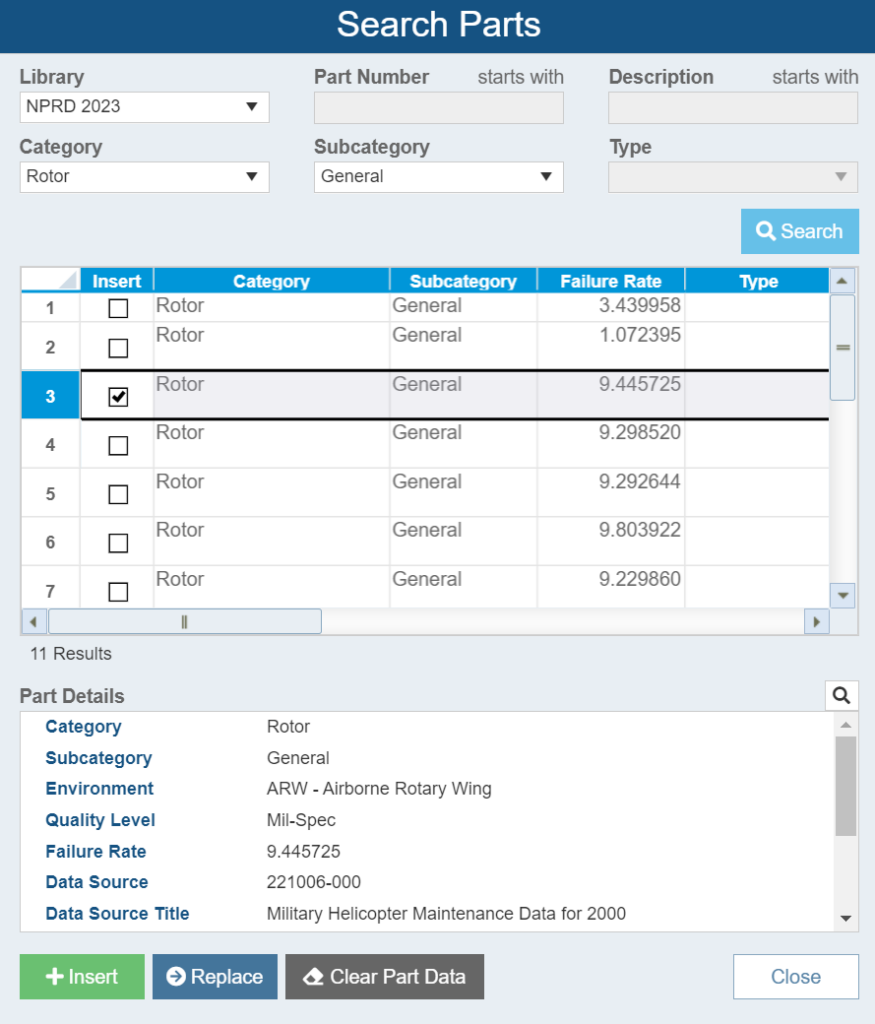
Relyence 2024 Release 1 now includes add-on support for NPRD 2023.
Once added to your Parts Table, failure rate data from NPRD 2023 will then be used to compute your overall system MTBF. Including NPRD data in your reliability predictions can be helpful to make educated decisions about overall system design, including component selection and potential maintenance strategies, that contribute to meeting system reliability metric goals.
NPRD Details Lookup
Included with NPRD 2023 in Relyence 2024 Release 1 is a helpful feature that provides insight into the underlying data that NPRD uses to determine its Failure Rate data. Found in the NPRD Details file, this data includes precise information on the components tested to determine the Failure Rates supplied by NPRD 2023. It can include helpful reference information such as Part/MIL Number, component Failure Rates, Manufacturer, and test Population.
To view the NPRD Details information, simply click the NPRD Details lookup icon from the Part Search dialog with any NPRD 2023 part selected. You will then be presented with the NPRD Details dialog to view the associated information from the NPRD 2023 Details file.
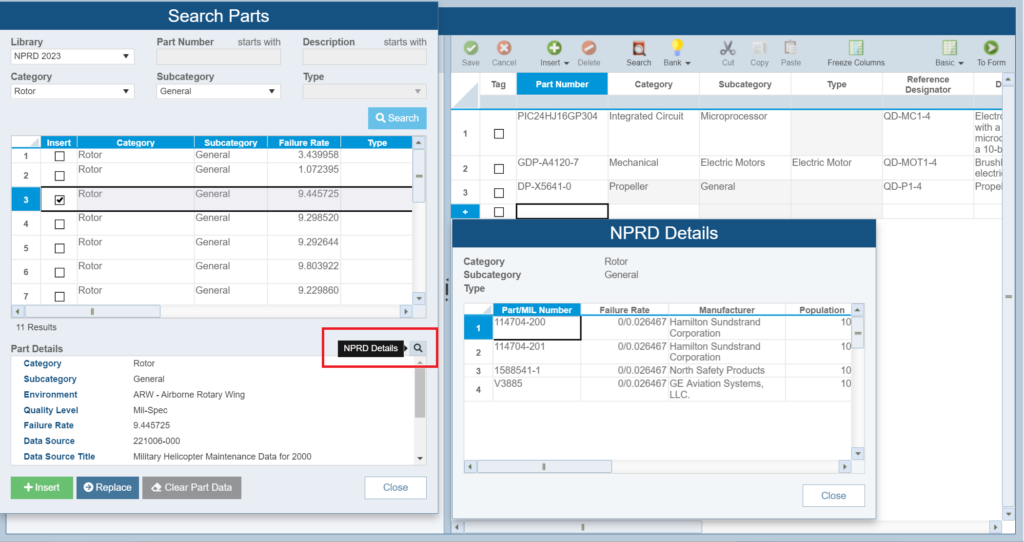
To view the NPRD Details information, simply click the NPRD Details lookup icon from the Part Search dialog with any NPRD 2023 part selected.
Support for IEC 61709
The IEC 61709 standard, entitled “Electric components – Reliability – Reference conditions for failure rates and stress models for conversion” was developed by the International Electrotechnical Commission (IEC). It provides a method to convert failure rates from reference conditions to different operating conditions for a variety of electromechanical components, including semiconductors, capacitors, resistors, relays, switches, and more.
The models in the IEC 61709 standard require a “base” or “reference” failure rate to be defined in order to perform analysis. The standard does not provide these base failure rates, and is therefore intended to be utilized by organizations that either have their own base failure rate data or use another Reliability Prediction standard for failure rate analysis. IEC 61709 provides stress models to compute component failure rates by adjusting the reference failure rates to account for different operating conditions.
The IEC 61709 failure rate conversion methods are based on reference conditions for each component. Reference conditions are the typical stresses that a component can be expected to endure across most applications. By providing a conversion model between differing conditions, the methods presented in IEC 61709 provide modified failure rate values based on the effects of variations in the design or environment.
Now with Relyence 2024 Release 1, IEC 61709 failure rate conversions are available in conjunction with other supported reliability prediction standards, including MIL-HDBK-217, Telcordia SR-332, 217Plus, NSWC-11, and more in Relyence Reliability Prediction.
Example IEC 61709 Calculation
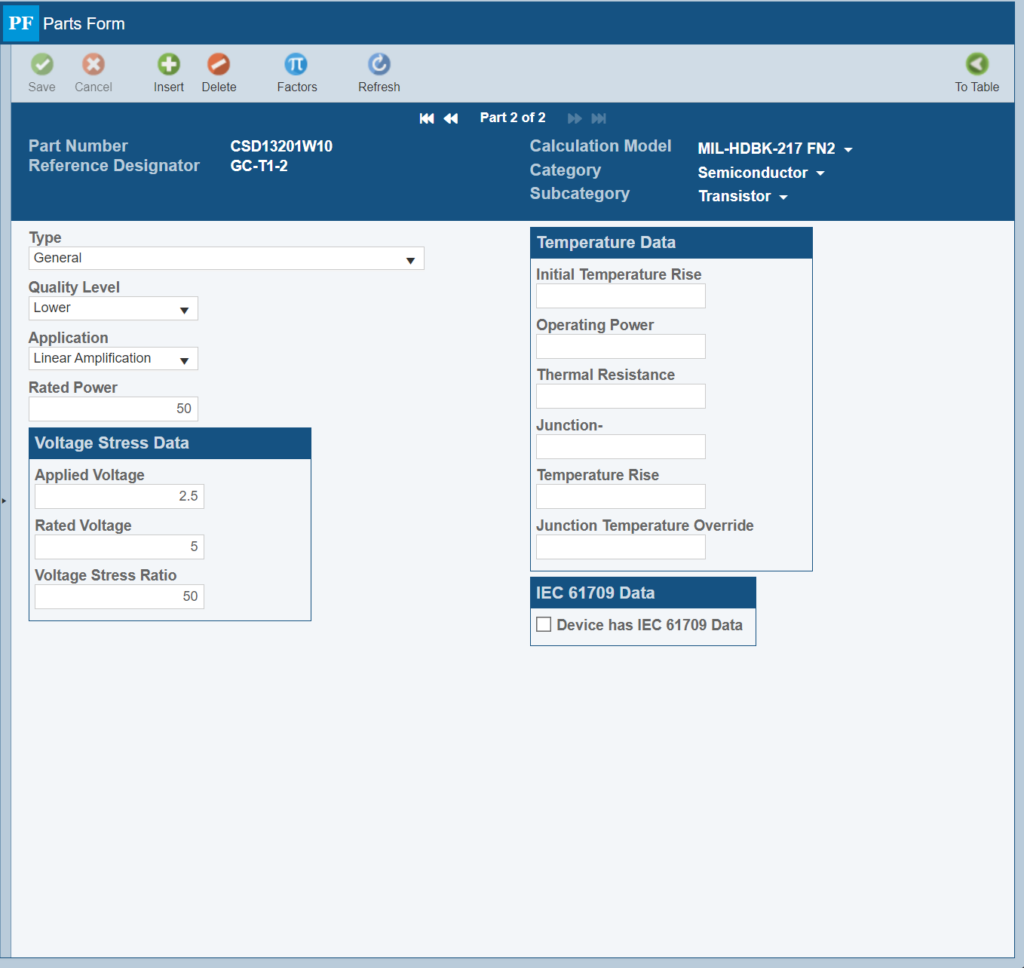
As an example of IEC 61709 implementation in Relyence Reliability Prediction, we will examine applying the IEC 61709 failure rate conversion to a transistor for an automotive application that has its reference failure rate calculated from MIL-HDBK-217.
To perform IEC 61709 calculations, we must enable it for our Analysis. To do this, select the Use IEC 61709 Failure Rate Conversion checkbox in Properties from the Reliability Prediction Sidebar menu.
Here is our example transistor:
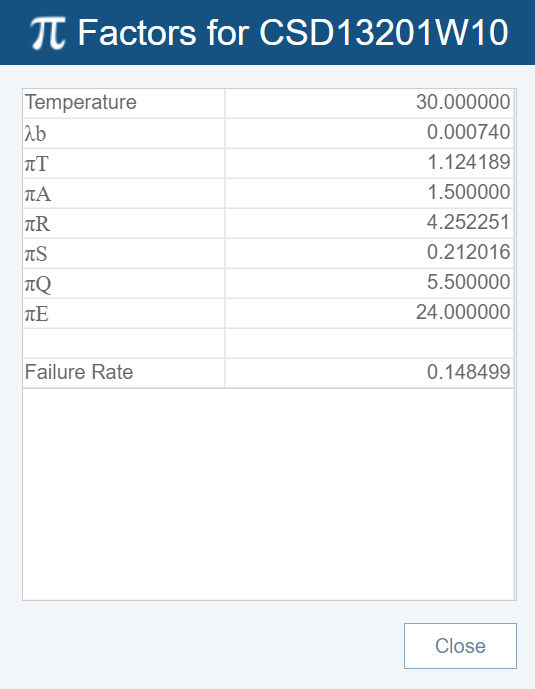
Before we add in our IEC 61709 data, we can check our MIL-HDBK-217 based Pi Factors and Failure Rate:
Now, select the Device has IEC 61709 Data checkbox to enter the data needed for conversion. Enter the Voltage Stress and/or Temperature Data of our application’s expected operating conditions:
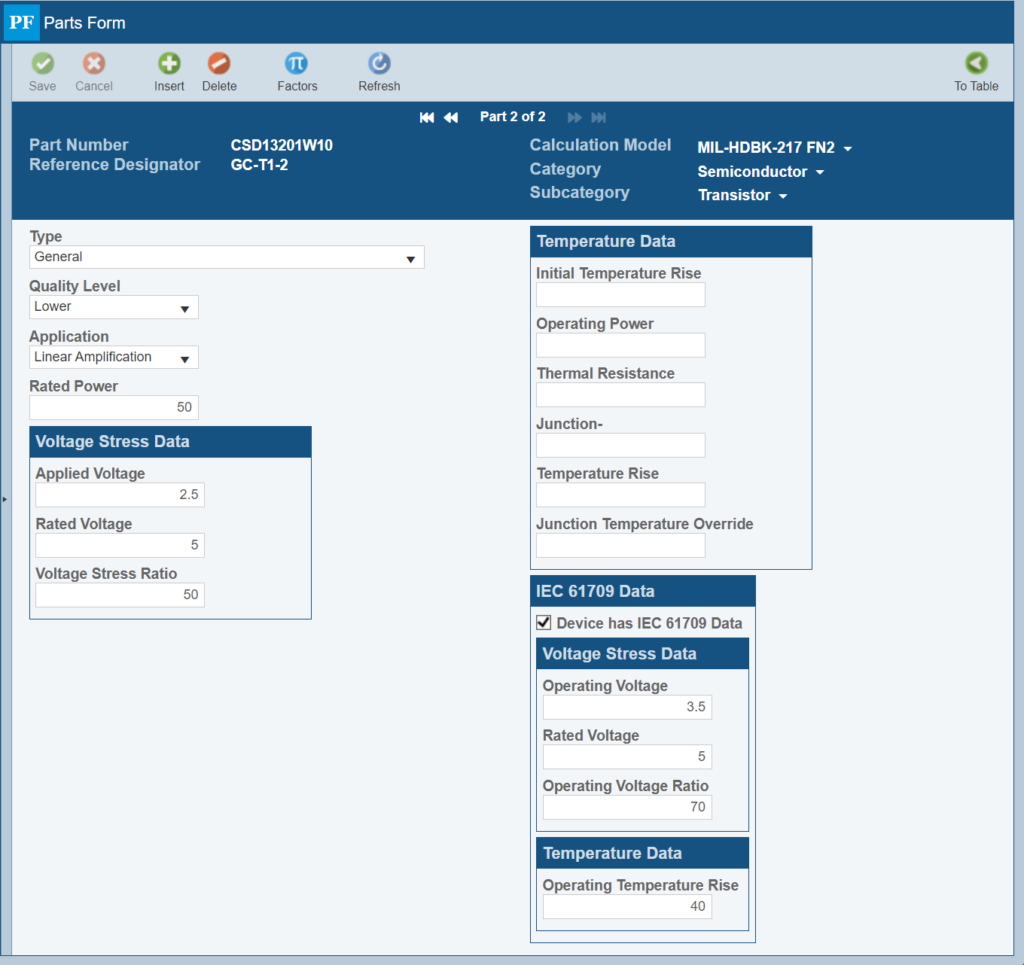
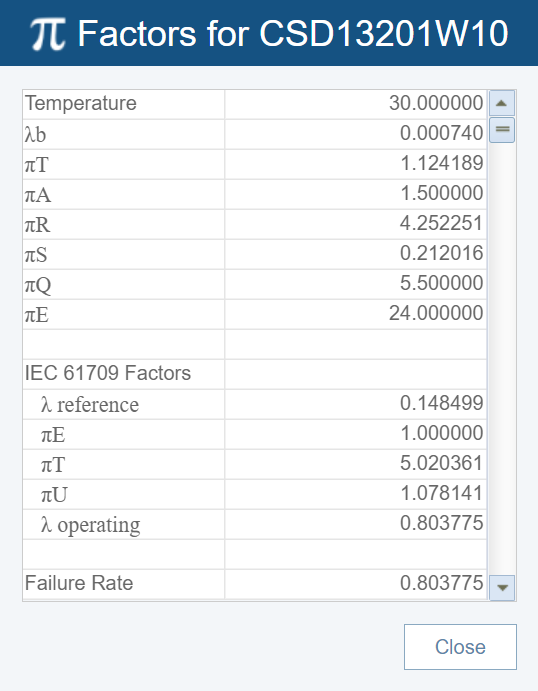
We can now view the new IEC 61709 calculated Pi Factors and Failure Rate. When performing IEC 61709 Failure Rate conversion, Relyence shows the reference Pi Factors and IEC 61709 Pi Factors to ensure that you can easily see the underlying data used in the failure rate conversion calculation and the adjustment factors.
New in Relyence FMEA
Relyence FMEA offers a best-in-class tool for your Failure Mode & Effects Analysis needs with out-of-the-box support for DFMEA, PFMEA, FMEA-MSR, and MIL-STD-1629A FMECA including various FMEA elements, such as Boundary Diagrams, P-Diagrams, DVP&R, and Control Plans. Additionally, powerful features like the Knowledge Bank, SmartSuggest, and AutoFlow enable you to manage your FMEA process with ease and efficiency and are an important reason why spreadsheet tools are no match for Relyence FMEA. With Relyence 2024 Release 1, we continue to build on Relyence FMEA’s robust feature set.
Additions to SmartSuggestTM
The unique-to-Relyence innovation, FMEA SmartSuggestTM, provides a powerful data management tool for your FMEAs. By analyzing the data across your various FMEA documents, FMEA SmartSuggest develops a list of data recommendations for usage on your current Worksheet that you can choose to include in your analysis. Relyence FMEA SmartSuggest provides an effective way to make sure your FMEA data is consistent and is one of the multitude of benefits Relyence FMEA offers over spreadsheet based tools such as Excel.
With Relyence 2024 Release 1, SmartSuggest’s capabilities have been expanded to the DVP&R document in your DFMEAs. SmartSuggest now allows you to create Test Plans from the Detection Controls, Prevention Controls, or Recommended Actions from your DFMEA Worksheet. Simply select SmartSuggest > Show Suggestions from the toolbar in Relyence FMEA when on your DVP&R Test Plan fields, then choose the appropriate data to include on your DVP&R.
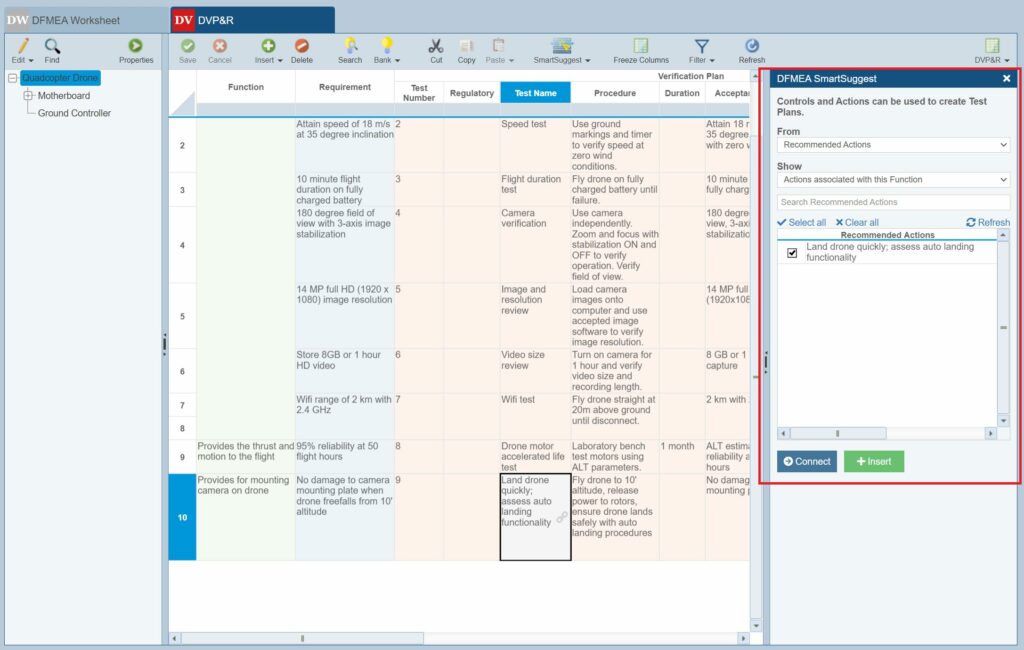
Use the SmartSuggest > Show Suggestions feature to add Controls and Actions from your DFMEA Worksheet to your DVP&R.
Enhanced Synchronization of Controls and Characteristics
Characteristics and Controls are two important elements that are commonly used when performing Failure Mode and Effects Analysis (FMEA). There are two commonly-used types of Characteristics – Product and Process – and two common types of Controls – Prevention and Detection.
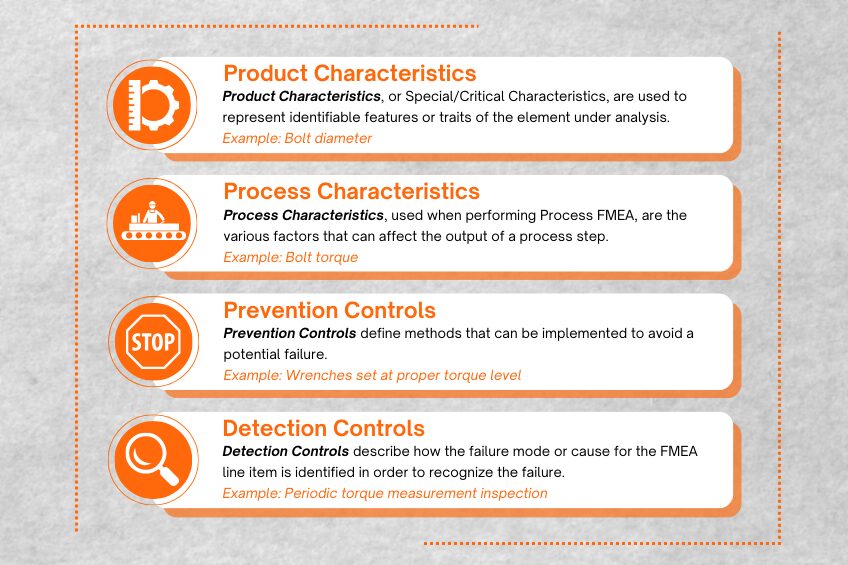
With Relyence 2024 Release 1, Characteristic and Control synchronization through the Relyence Knowledge Bank has been enhanced. This helps to ensure that your FMEA documents are kept up-to-date and accurate as you build up your FMEA and Knowledge Bank data.
And more!
In addition to the new features highlighted above, Relyence 2024 Release 1 also adds several exciting enhancements to the Relyence Studio reliability and quality software tool suite such as:
- View Manager provides a centralized location to organize your Table Views
- Support for custom Formulas on Subtables in Relyence FRACAS
- New Fault Tree Tabular Report provides diagram layout along with data parameters
Free Trial of Relyence Reliability Software
If you are a customer of the Relyence Cloud-Hosted solution, you will see all these exciting new capabilities now! Or, if you are a customer of the Relyence On-Premise solution, you will have access to these new features as soon as your installation is updated.
If you are current Relyence customer, a soon-to-be customer, or a future customer, please feel free to reach out with your comments. We always appreciate hearing from you! Your valuable feedback helps us to continually strive towards our goal of creating the best overall reliability software package.
To check out these new features, or any of the capabilities of the Relyence software tool suite, you can sign up for our completely free trial. No hassle, no strings, just register here and put us to the test! Or call today to speak to us about your requirements. Or schedule a personal demo at your convenience.


