
Relyence is excited to introduce Relyence 2025 Release 2, the latest update to our integrated suite of reliability and quality tools. This release features a newly supported Reliability Prediction standard, along with an array of new power-packed capabilities to help engineers, quality professionals, and reliability teams work efficiently, analyze more effectively, and deliver results with confidence.
Major new additions that are included in this release are:
- Support for SN 29500 in Reliability Prediction, allowing you to meet European and global reporting requirements with ease.
- Group Plots and Competing Failure Modes Analysis in Relyence Weibull, providing deeper insight into life data.
- Subtable capability for Analysis Tree data, offering greater flexibility for data management and organization.
- A new ALT Test Planning utility, streamlining accelerated life test planning and setup.
In addition to these major new features, we focused on implementing numerous quality-of-life improvements as part of Relyence 2025 Release 2. These new capabilities span across our product line and offer a range of enhancements such as new dashboard options, workflow improvements, and new report features that make your day-to-day work in Relyence smoother than ever.
Let’s take a closer look at exciting new features and functions in Relyence 2025 Release 2.
Introducing Support for SN 29500 in Relyence Reliability Prediction
Relyence Reliability Prediction enables fast, accurate failure rate analyses using a comprehensive suite of industry standards. With Parts Libraries, additional tools such as What If? and Allocation, and integration across the Relyence Studio platform, Relyence Reliability Prediction streamlines the analysis process to help engineers deliver precise, standards-compliant results with ease. It supports methods including MIL‑HDBK‑217, Telcordia SR‑332, IEC 61709, NSWC-11, and 217Plus, giving teams the flexibility to meet global and customer-specific requirements.
With Relyence 2025 Release 2, we’ve continued expanding the reliability prediction standards available within Relyence by now fully supporting SN 29500, one of the most widely used prediction standards in European industrial and commercial markets.
What is SN 29500?
SN 29500, originally developed by Siemens, provides a structured approach for calculating failure rates of electronic components. It covers a broad range of devices including resistors, capacitors, integrated circuits, and connectors, and accounts for the effects of operating temperature, applied stress, and environmental conditions on device performance metrics.
While MIL‑HDBK‑217 and Telcordia SR‑332 remain common worldwide, they tend to be utilized in aerospace, defense, and telecom sectors. For companies serving the industrial automation, power generation, transportation, or commercial electronics sectors, especially those in Europe, SN 29500 is often the preferred, and in some cases, required, method for reliability predictions.
For reliability prediction practitioners, SN 29500 offers many benefits, including:
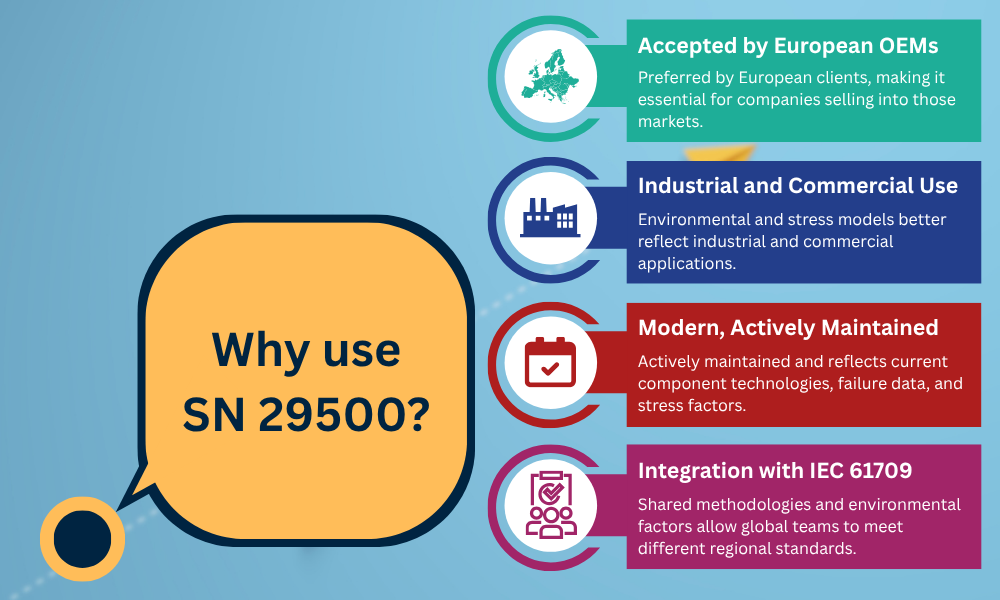
- Accepted by European OEMs and Regulatory Agencies: Many European customers and regulatory bodies prefer SN 29500, making it essential for companies selling into industrial and energy markets in Europe. In some cases, SN 29500 is required for reliability prediction analyses.
- Advantageous for Industrial and Commercial Industries: SN 29500 was developed with industrial automation, energy, transportation, and commercial electronics in mind. Its environmental and stress models are ideal for many commercial products outside of telecom and military applications.
- Modern, Actively Maintained Standard: SN 29500 is actively maintained and used across Europe, reflecting current component technologies and failure data. Given its more recent release and active maintenance, it incorporates more up-to-date stress factors and parts data, leading to more realistic failure rate estimates for modern devices.
- Seamless Integration with IEC 61709: SN 29500 shares methodologies and environmental factors with IEC 61709, allowing teams to work across global product lines needing to meet multiple regional standards.
Using SN 29500 in Relyence Reliability Prediction
To start using SN 29500 in Relyence, simply select SN 29500 from the Calculation Model dropdown menu from the Analysis Tree or on the Parts Table. Note that access to SN 29500 requires a license purchase, which can be added to your Relyence subscription at any time. SN 29500 uses different calculation formulas and input parameters depending on the component type being evaluated. Many of its models factor in multiple variables such as operating conditions and stress levels to determine a final predicted failure rate.
For example, below is the equation from SN 29500 for a low-duty hermetically sealed relay with single contact (ex. a reed relay).
λ = λref * πL * πE * πT * πK * πW
where:
- λ is the failure rate in failures per billion hours (FITs)
- λref is the failure rate under reference conditions provided by SN 29500
- πL is the load dependence factor
- πE is the environmental dependence factor
- πT is the temperature dependence factor
- πK is the failure criterion factor
- πW is the stress profile factor
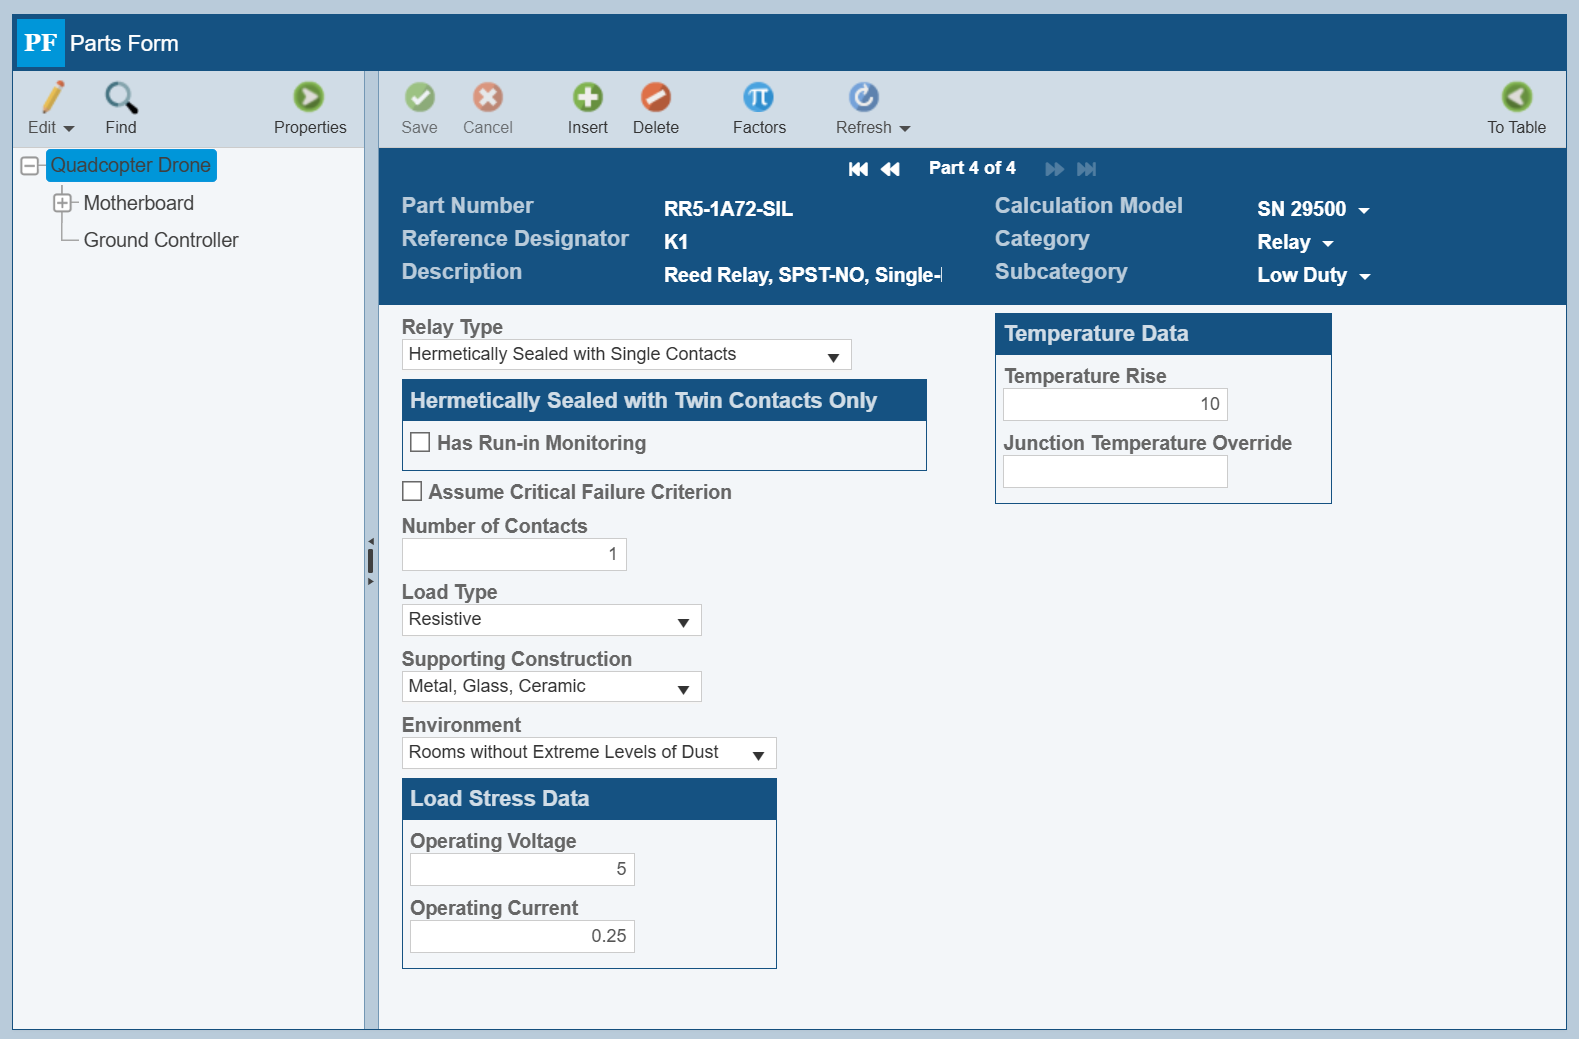
Relyence 2025 Release 2 adds on support for the Siemens SN 29500 calculation model to Relyence Reliability Prediction.
You can enter all the necessary factors in the Parts Form and Analysis Tree Properties (for πW) in Relyence. Note that data for the stress profile factor (πW) Or, with Relyence Reliability Prediction, you can use Relyence preloaded default values or your own custom default values. Then, as you gather more specific component information, you can add that data in to better refine your reliability estimates.
With our ever-expanding list of supported standards— now including SN 29500—it is easier than ever to deliver accurate, standards-compliant analyses to a global audience. With Relyence Reliability Prediction, you can also utilize multiple standards in a single prediction analysis, enabling you to model components effectively and produce a thorough, precise reliability assessment. Additionally, with supplemental tools such as What If? analysis, you can easily generate calculation results for customers with different standard requirements. For example, a supplier of industrial control systems can calculate failure rates for a European customer using SN 29500 and generate a MIL‑HDBK‑217 report for a U.S. defense contractor for the same Analysis in seconds.
New in Relyence Weibull
Relyence Weibull provides powerful tools for analyzing life data to understand product reliability and performance. With support for multiple distribution types, advanced statistical fitting techniques, and clear visualizations, it helps teams identify trends, forecast lifetimes, and make informed design and maintenance decisions. Seamlessly integrated with the rest of the Relyence Studio suite, it streamlines life data analysis from data collection through reporting.
With 2025 Release 2, we’ve added two powerful new tools to Relyence Weibull: Group Plots and Competing Failure Modes Analysis.
Group Plots for Data Set Comparison
Analyzing reliability often requires looking at multiple sets of data, whether it’s different production lots, design revisions, or stress levels. With Group Plots in Relyence Weibull, you can overlay up to five life data sets onto one chart for direct comparison.
Using Group Plots in your Weibull analysis process can offer benefits in a wide range of scenarios. Some examples include:
- Evaluate the impact of design or process changes by comparing before-and-after data.
- Compare different suppliers to assess better suitability.
- Review material variations to determine which performs better.
- Assess field return data from different production batches to identify issues.
- Compare the effects of different in-field environmental stresses to understand best-use scenarios.
- Combine life data from multiple components to determine where improvement efforts will be most effective.
For example, consider a team validating three alternate bearing suppliers for a new motor. By comparing the three life test data sets in a Group Plot in Relyence Weibull, engineers can instantly see which supplier’s bearings exhibit the highest reliability.
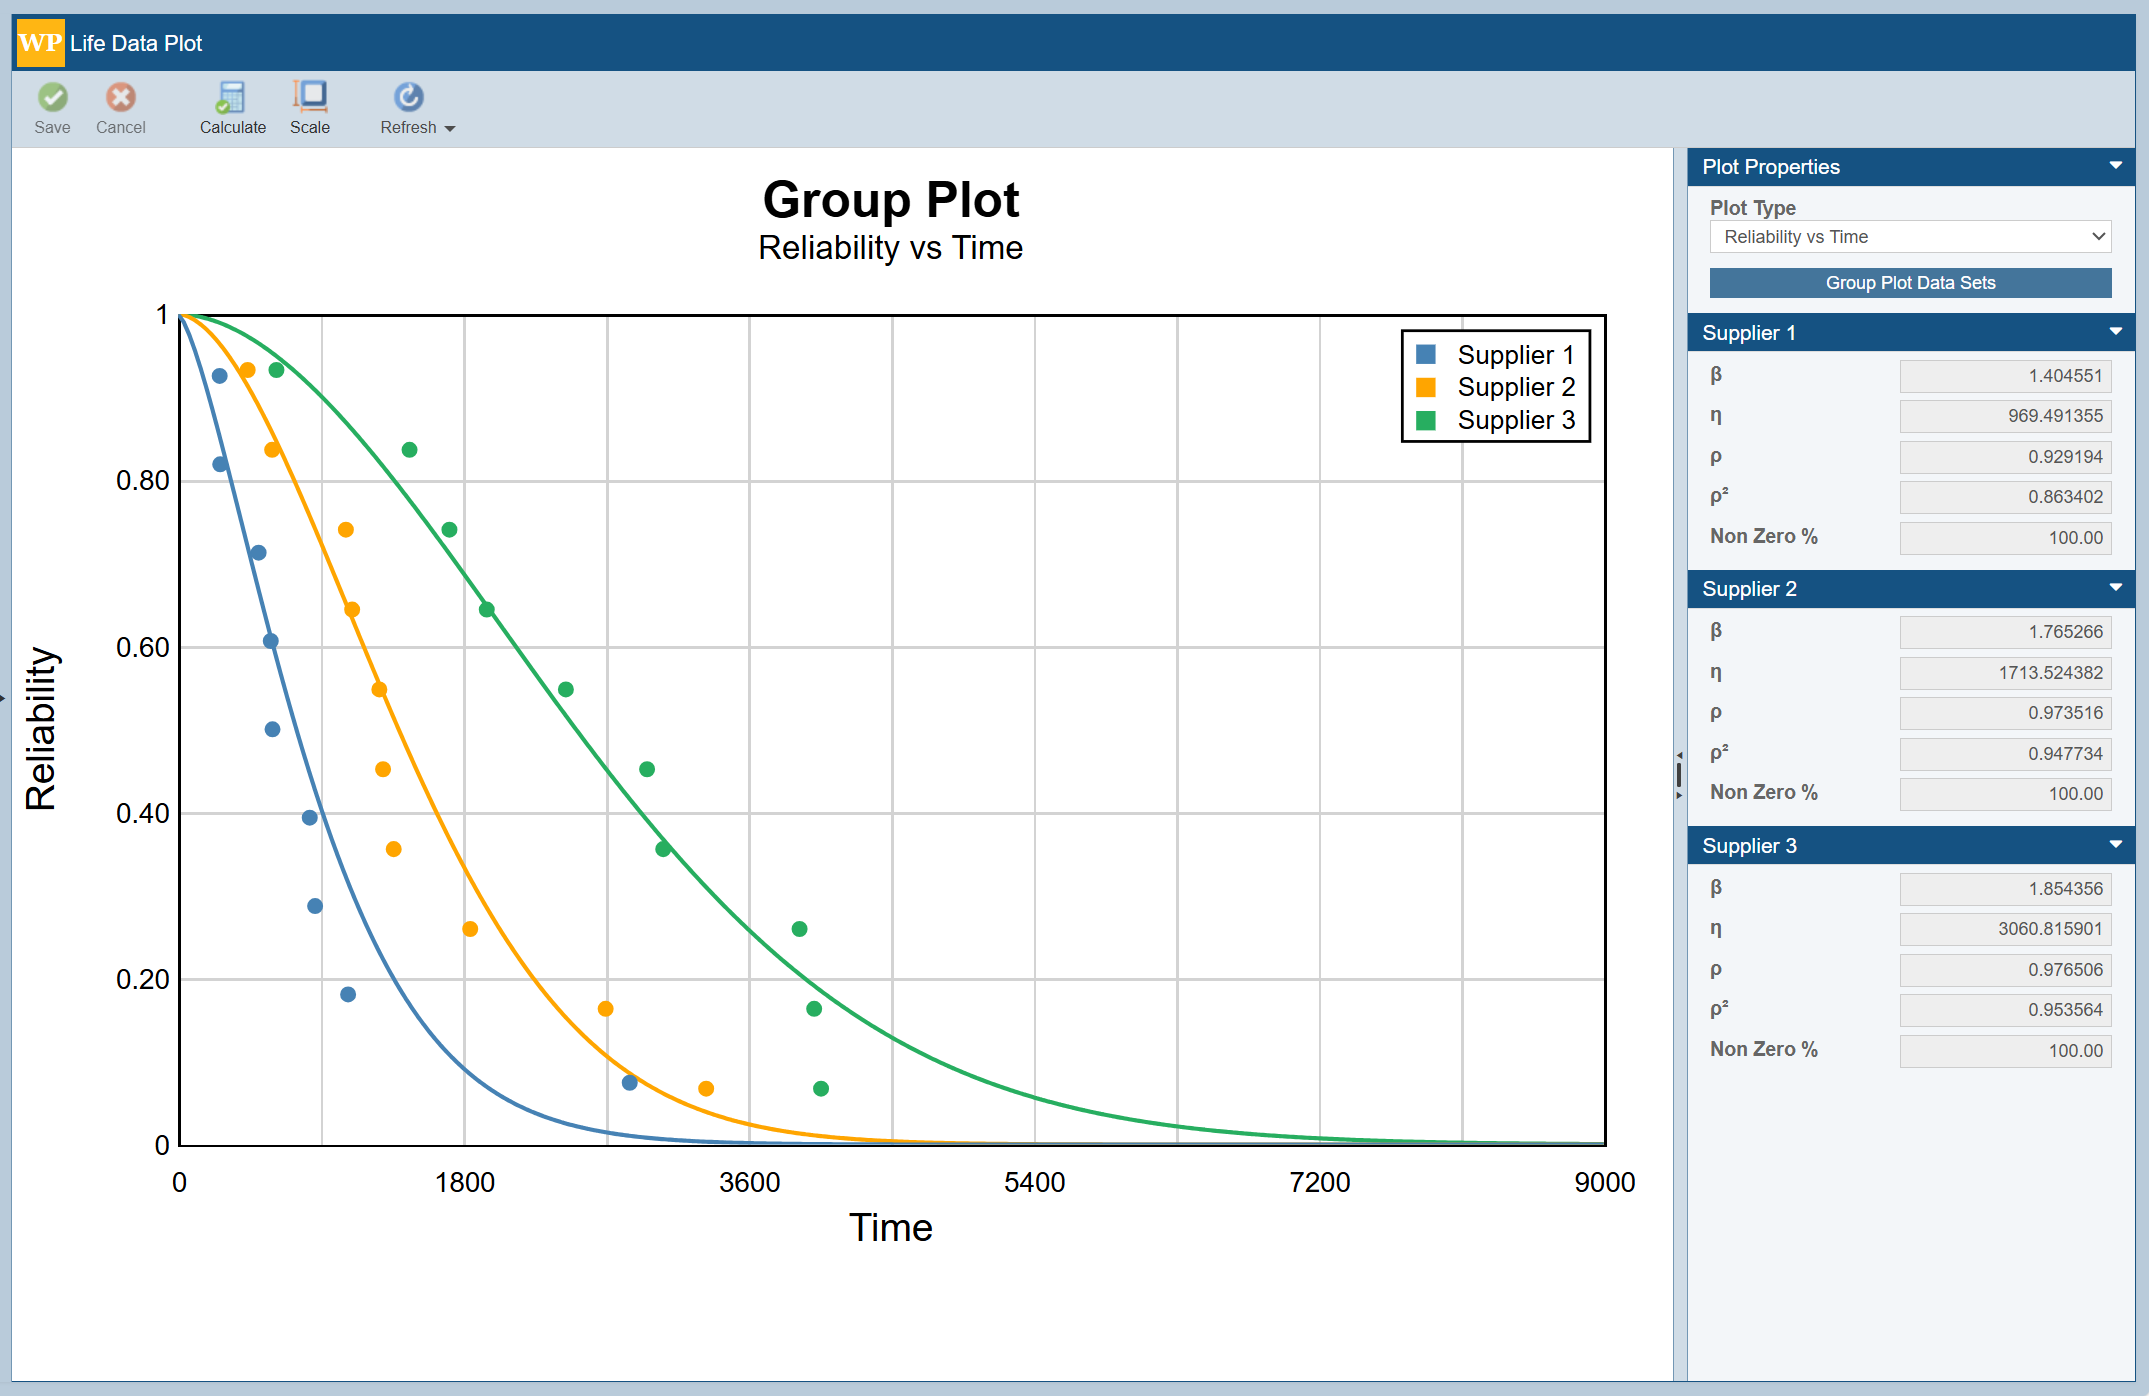
With Group Plots in Relyence Weibull, you can overlay up to five life data sets onto one chart for direct comparison.
To create a Group Plot in Relyence Weibull, select the Insert > Group Plot option, select the appropriate Data Sets from those in your Analysis, choose your Plot Type from Probability, Reliability vs Time, Unreliability vs Time, Failure Rate vs Time, or PDF Plot and click to Calculate.
Competing Failure Modes Analysis for Mechanism-Specific Modeling
Real-world products rarely have a single mode of failure. For example, an electromechanical relay might suffer mechanical spring fatigue, electrical contact wear, and thermal degradation—with each having its own life distribution. Combining all failures into one data set can potentially hide which mechanism is most critical. This is where Competing Failure Mode (CFM) analysis comes in.
With CFM, you can separate failures by mechanism, modeling each with its own statistical distribution, allowing you to visualize each failure mode and the aggregate curve to see which mechanisms dominate. This level of detail helps reliability engineers make data-driven decisions for developing efficiently focused improvement plans. For example, if mechanical wear dominates the relay’s early-life failures, design teams can reinforce the mechanical subsystem, or, if electrical wear drives late-life failures, maintenance intervals can be adjusted accordingly.
With Relyence 2025 Release 2, you can now perform Competing Failure Modes analysis in Relyence Weibull for up to five distinct Failure Modes. To perform CFM, select the appropriate Weibull Life Data Set and choose the Calculate Competing Failure Modes checkbox option in Data Set Properties. Then, define the appropriate Group Name for each entry on the Data Points Table. Once Group Names are assigned, click the Failure Modes button and define the Group Name-to-Failure Mode relationship.
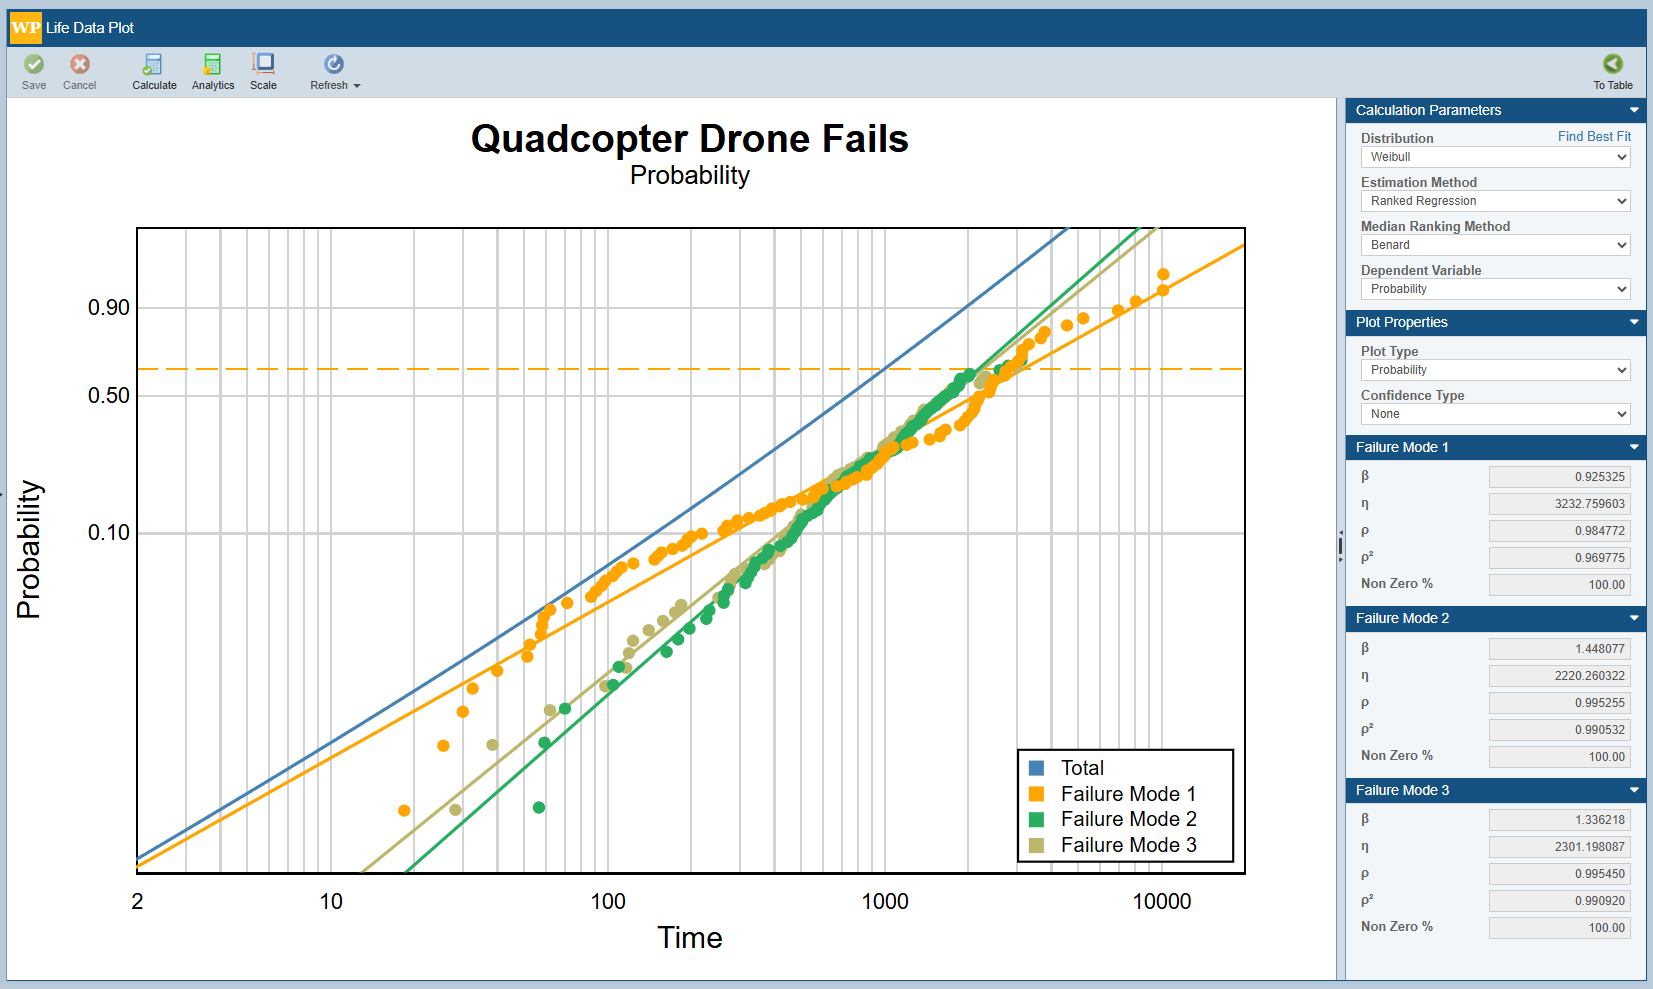
With Relyence 2025 Release 2, you can now perform Competing Failure Modes analysis in Relyence Weibull for up to five distinct Failure Modes.
With CFM in Relyence Weibull, you can assign one or many Groups to each individual Failure Mode. This structure allows the ability to accurately model systems that contain identical components. For example, if you are analyzing a quadcopter drone, each of the four rotors is composed of identical components and subjected to identical stresses. In your Weibull Data Set, you can assign the failure of each rotor to its own Group (ex. “Rotor 1 Failure”, “Rotor 2 Failure”, etc.) and then associate all four Groups to the same Failure Mode to group them together for CFM analysis.
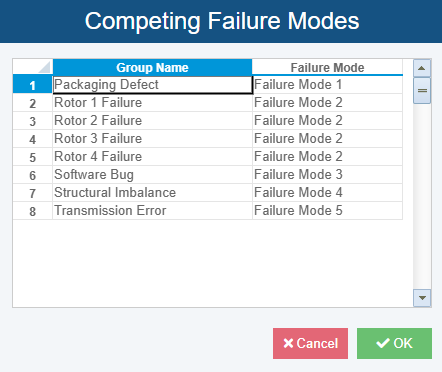
You can assign one or many Groups to each individual Failure Mode, allowing you to accurately model systems that contain identical components.
New Analysis Tree Subtables for Flexible Data Organization
The Analysis Tree in Relyence provides a hierarchical structure used to organize and manage all elements of your project. It provides a clear, visual framework for structuring systems, subsystems, and components and allows you to navigate and analyze your data efficiently.
Relyence Subtables are small, customizable tables you can add to capture a list of information. Previously available on Relyence FRACAS Incident and Problem Forms, Relyence 2025 Release 2 expands the usage of Subtables by introducing the ability to create Subtables within the Analysis Tree, making it easy to organize supporting details for your system’s components. They can be used for a variety of purposes, with some examples including:
- Documenting meeting attendees, minutes, and other relevant information.
- Recording the results of regularly scheduled audits.
- Providing a record of drawings with their revisions and changes associated with each system component.
- Tracking supplementary attributes like supplier information, costs, or test results.
- Maintaining a record of Analysis or Analysis Tree Revisions, capturing the date, revision number, and process details
To create an Analysis Tree Subtable, select Configure > Subtables in Relyence FMEA, FRACAS, Reliability Prediction, RCM, or Maintainability Prediction. Click the + button to add a new Subtable and define the fields needed. Subtables are fully customizable, and you can create as many as required for your usage. Once configured, Subtables can also be included on reports, enabling you to present a complete picture of your system’s data.
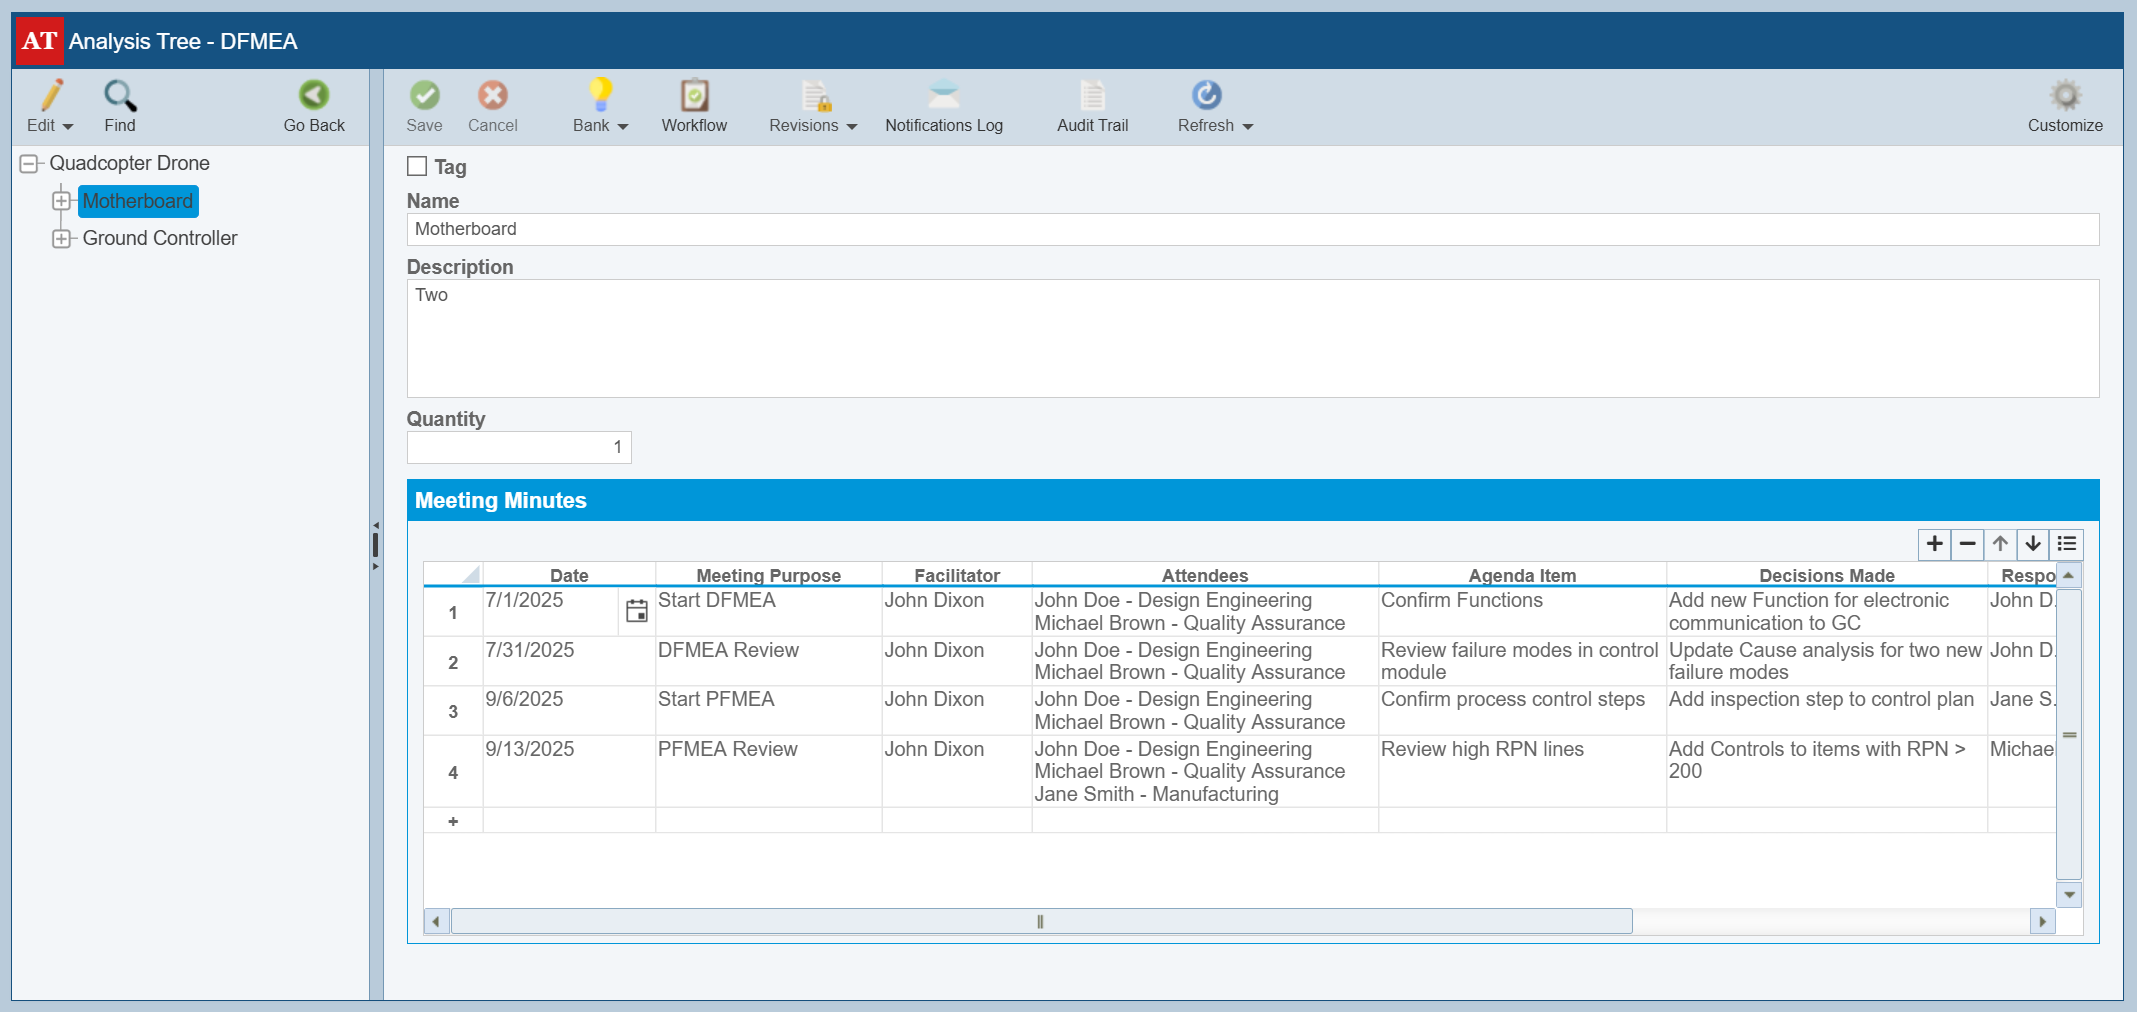
With Relyence 2025 Release 2, you can now create and use Subtables on your Analysis Tree.
New Test Planning Tool in Relyence ALT
Accelerated Life Testing (ALT) is a trusted technique for estimating long-term product reliability when field data is limited or when products are built to endure for extended lifetimes without failure. By applying elevated stresses to accelerate aging, ALT helps predict how products will perform under normal operating conditions. Relyence ALT offers an intuitive solution for modeling product reliability under accelerated conditions to predict long-term performance. With tools to define stress profiles, analyze accelerated aging behavior, and more, it helps teams gain faster, more accurate insights into product lifecycles.
Because accelerated life tests can be complex and expensive, it’s essential to design a test strategy that strikes the right balance between efficiency and accuracy, ensuring you capture meaningful data to estimate reliability under normal operating conditions. A well-designed test plan identifies which stress levels to apply for each factor and how to allocate test units across those conditions, enabling teams to gather actionable insights while minimizing time and cost. Now with Relyence 2025 Release 2, we’ve introduced a Test Plan utility to Relyence ALT to help you determine the appropriate design for your accelerated test.
To generate a test plan, select Tools > Test Plan from the sidebar in Relyence ALT. Then, choose the Test Plan type, set key metrics like Test Duration, Number of Units, and Bearing Life (BX) Percent result with Confidence Bounds if desired, and either define your test plan factors manually or pull in existing values using the Use Stress Data from Current Data Set option.
ALT Test Plan Example
As an example, we will consider the case where a reliability engineer is using Relyence ALT to design an accelerated life study for an electromechanical assembly. The design of the experiment is as follows:
- The goal is to estimate the B10 life, or the time by which 10% of units are expected to fail.
- Stress factors of temperature and humidity will be used.
- There are 50 units available for testing.
- The test will be run for a test duration of 1000 hours.
The following decisions are made for the remaining test plan factors:
- The component is assumed to follow a Weibull distribution with β = 2.5.
- Cumulative Failure Probabilities after 1000 hours are:
- 5% at both Use Stress values of Temperature = 40 and Humidity = 80
- 90% at the Maximum Stress of Temperature = 130 and the Use Stress of Humidity = 80
- 30% at the Use Stress of Temperature = 40 and the Maximum Stress of Humidity = 100
- 90% Double Confidence results for the B10 value is desired.
- A Three-Level Optimum Plan was selected instead of a Five-Level Best Compromise Plan to minimize testing time and resource usage. By using only three distinct stress levels rather than five, the test becomes more efficient while still maintaining statistical effectiveness.
- Because the test is examining temperature-related stresses, Reciprocal Stress Transformation is used.
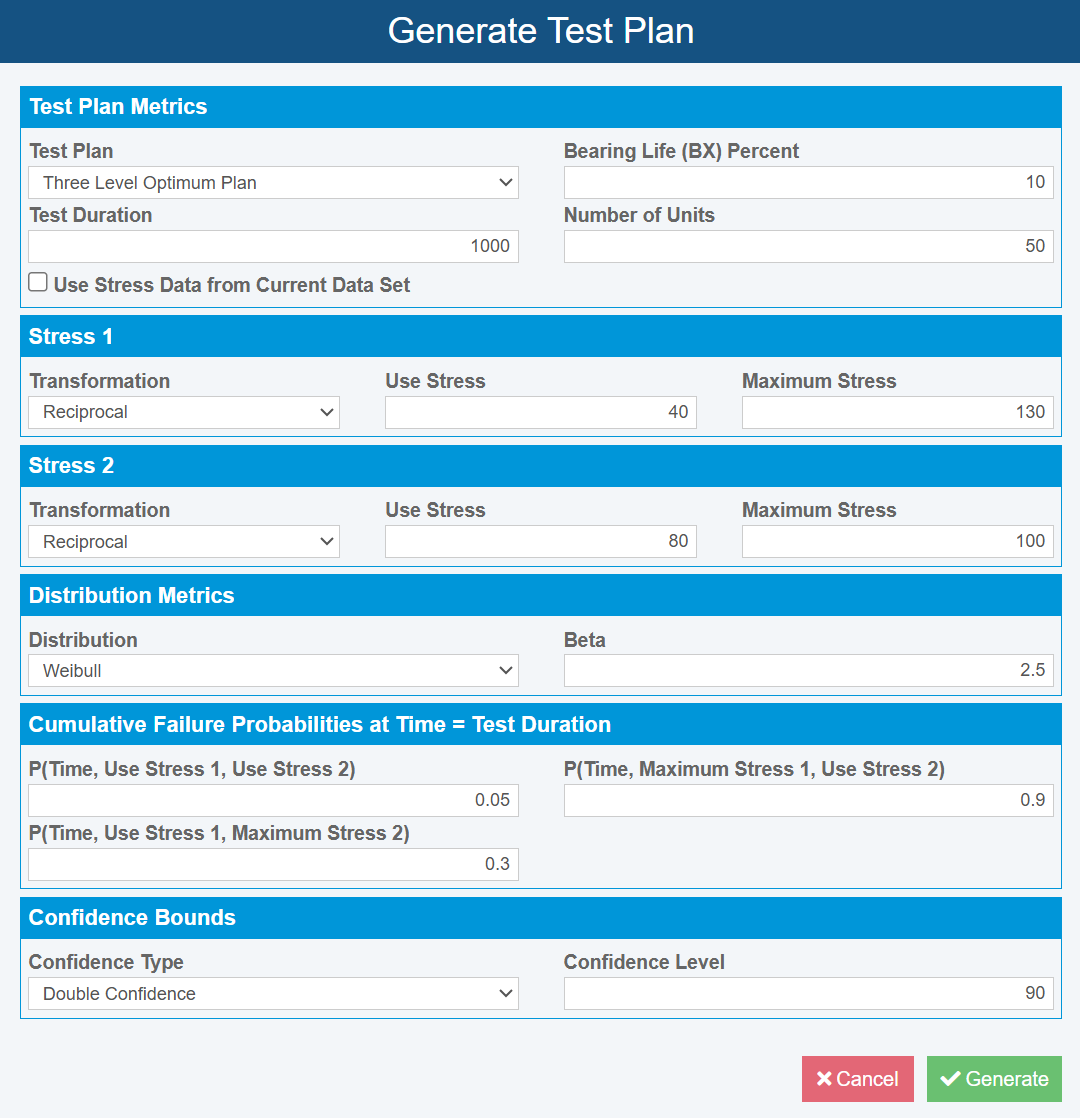
The Test Plan utility in Relyence ALT helps you determine the appropriate design for your accelerated test.
Using these inputs, Relyence ALT’s Test Plan utility generates the estimated B10 results, stress levels, and unit allocations needed to meet the study’s objectives, enabling the engineer to efficiently plan the experiment and ensure accurate reliability estimates.
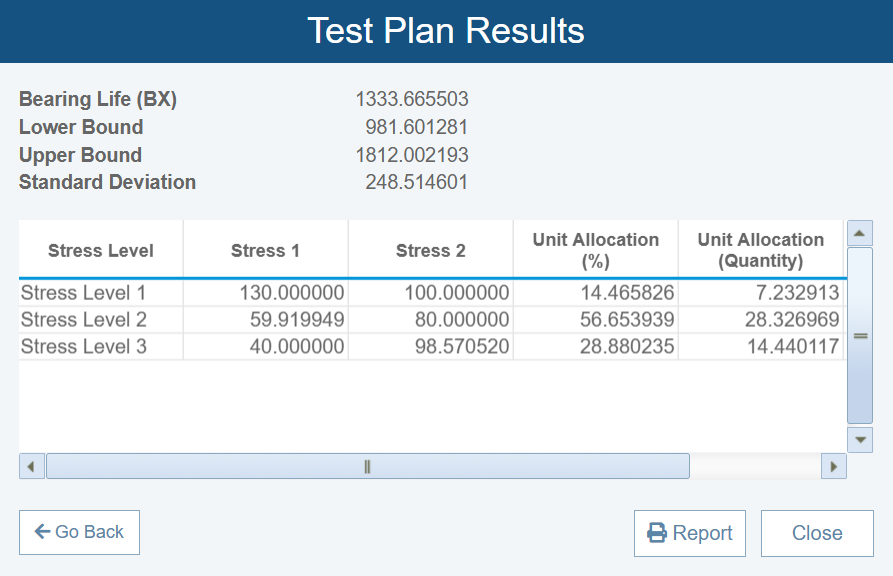
Relyence ALT’s Test Plan utility generates the estimated BX results, stress levels, and unit allocations needed to meet the study’s objectives.
These results show us that:
- The estimated B10 life of our assembly is approximately 1,334 hours with 90% confidence bounds ranging from approximately 982 to 1,812 hours.
- Our test setup is:
- Stress Level 1: Approximately 7 units tested at a Temperature of 130oC and Humidity of 100%
- Stress Level 2: Approximately 28 units tested at a Temperature of 60oC and Humidity of 80%
- Stress Level 3: Approximately 14 units tested at a Temperature of 40oC and Humidity of 98.6%
Additional Enhancements in Relyence Studio
Alongside these major features, Relyence 2025 Release 2 includes numerous additional improvements designed to make your daily work more efficient and effective.
Reliability Prediction Enhancements
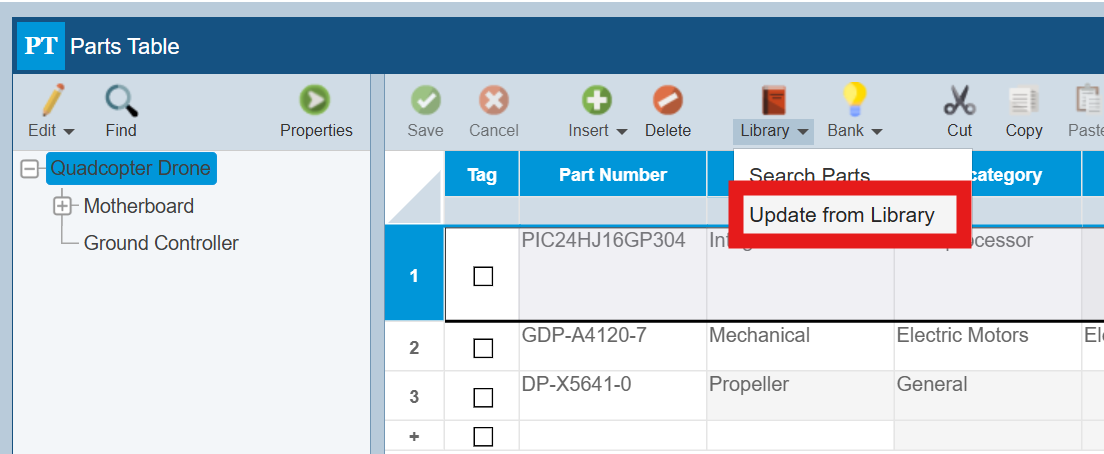
- Sync your Analysis data with the most current Parts Library information in a single click using the new Update from Library feature.
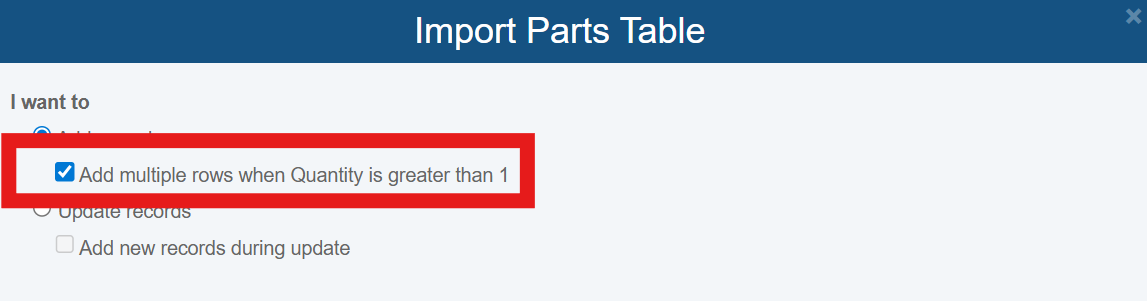
- Use the multiple row import option to automatically create separate entries when importing Part quantities greater than one, saving manual editing and duplication.
RBD Improvements
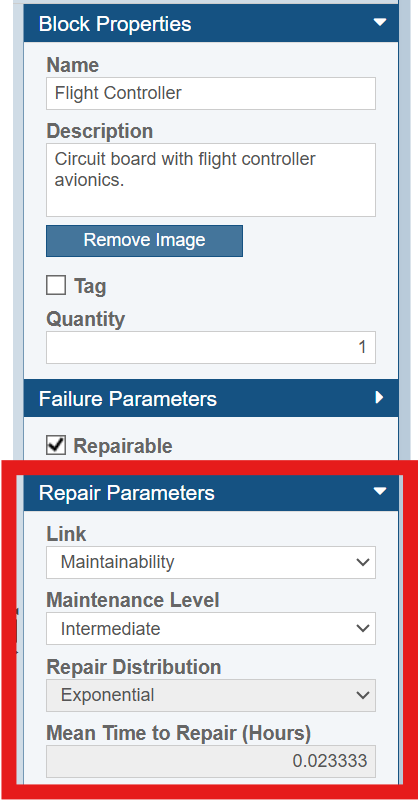
- Use repair data from Relyence Weibull, Reliability Prediction or Maintainability Prediction results.
- Option to automatically copy Names and Descriptions for RBD blocks linked to Subdiagrams, Reliability Prediction, and Weibull.
FMEA Advancements
- New support for Formulas in Knowledge Banks.
- Expanded support for Formulas in Analyses on Control Plans.
Workflow Optimization Features
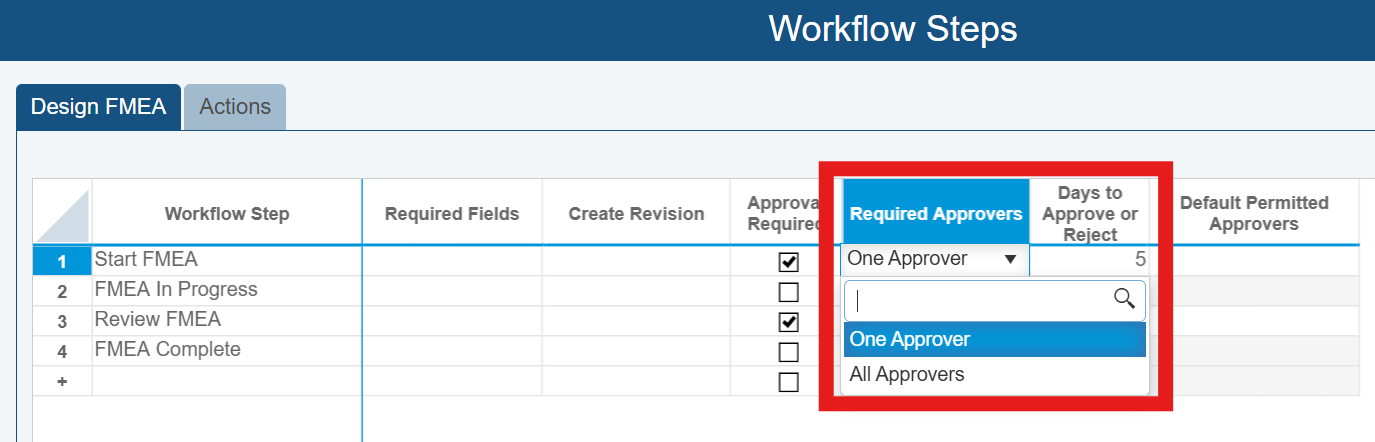
- Require Approval from all listed Approvers to advance Workflow steps, enhancing oversight and ensuring process control with our new All Approvers Workflow option.
- Show or hide the Workflow Status Bar on Worksheets for a cleaner layout or full visibility.
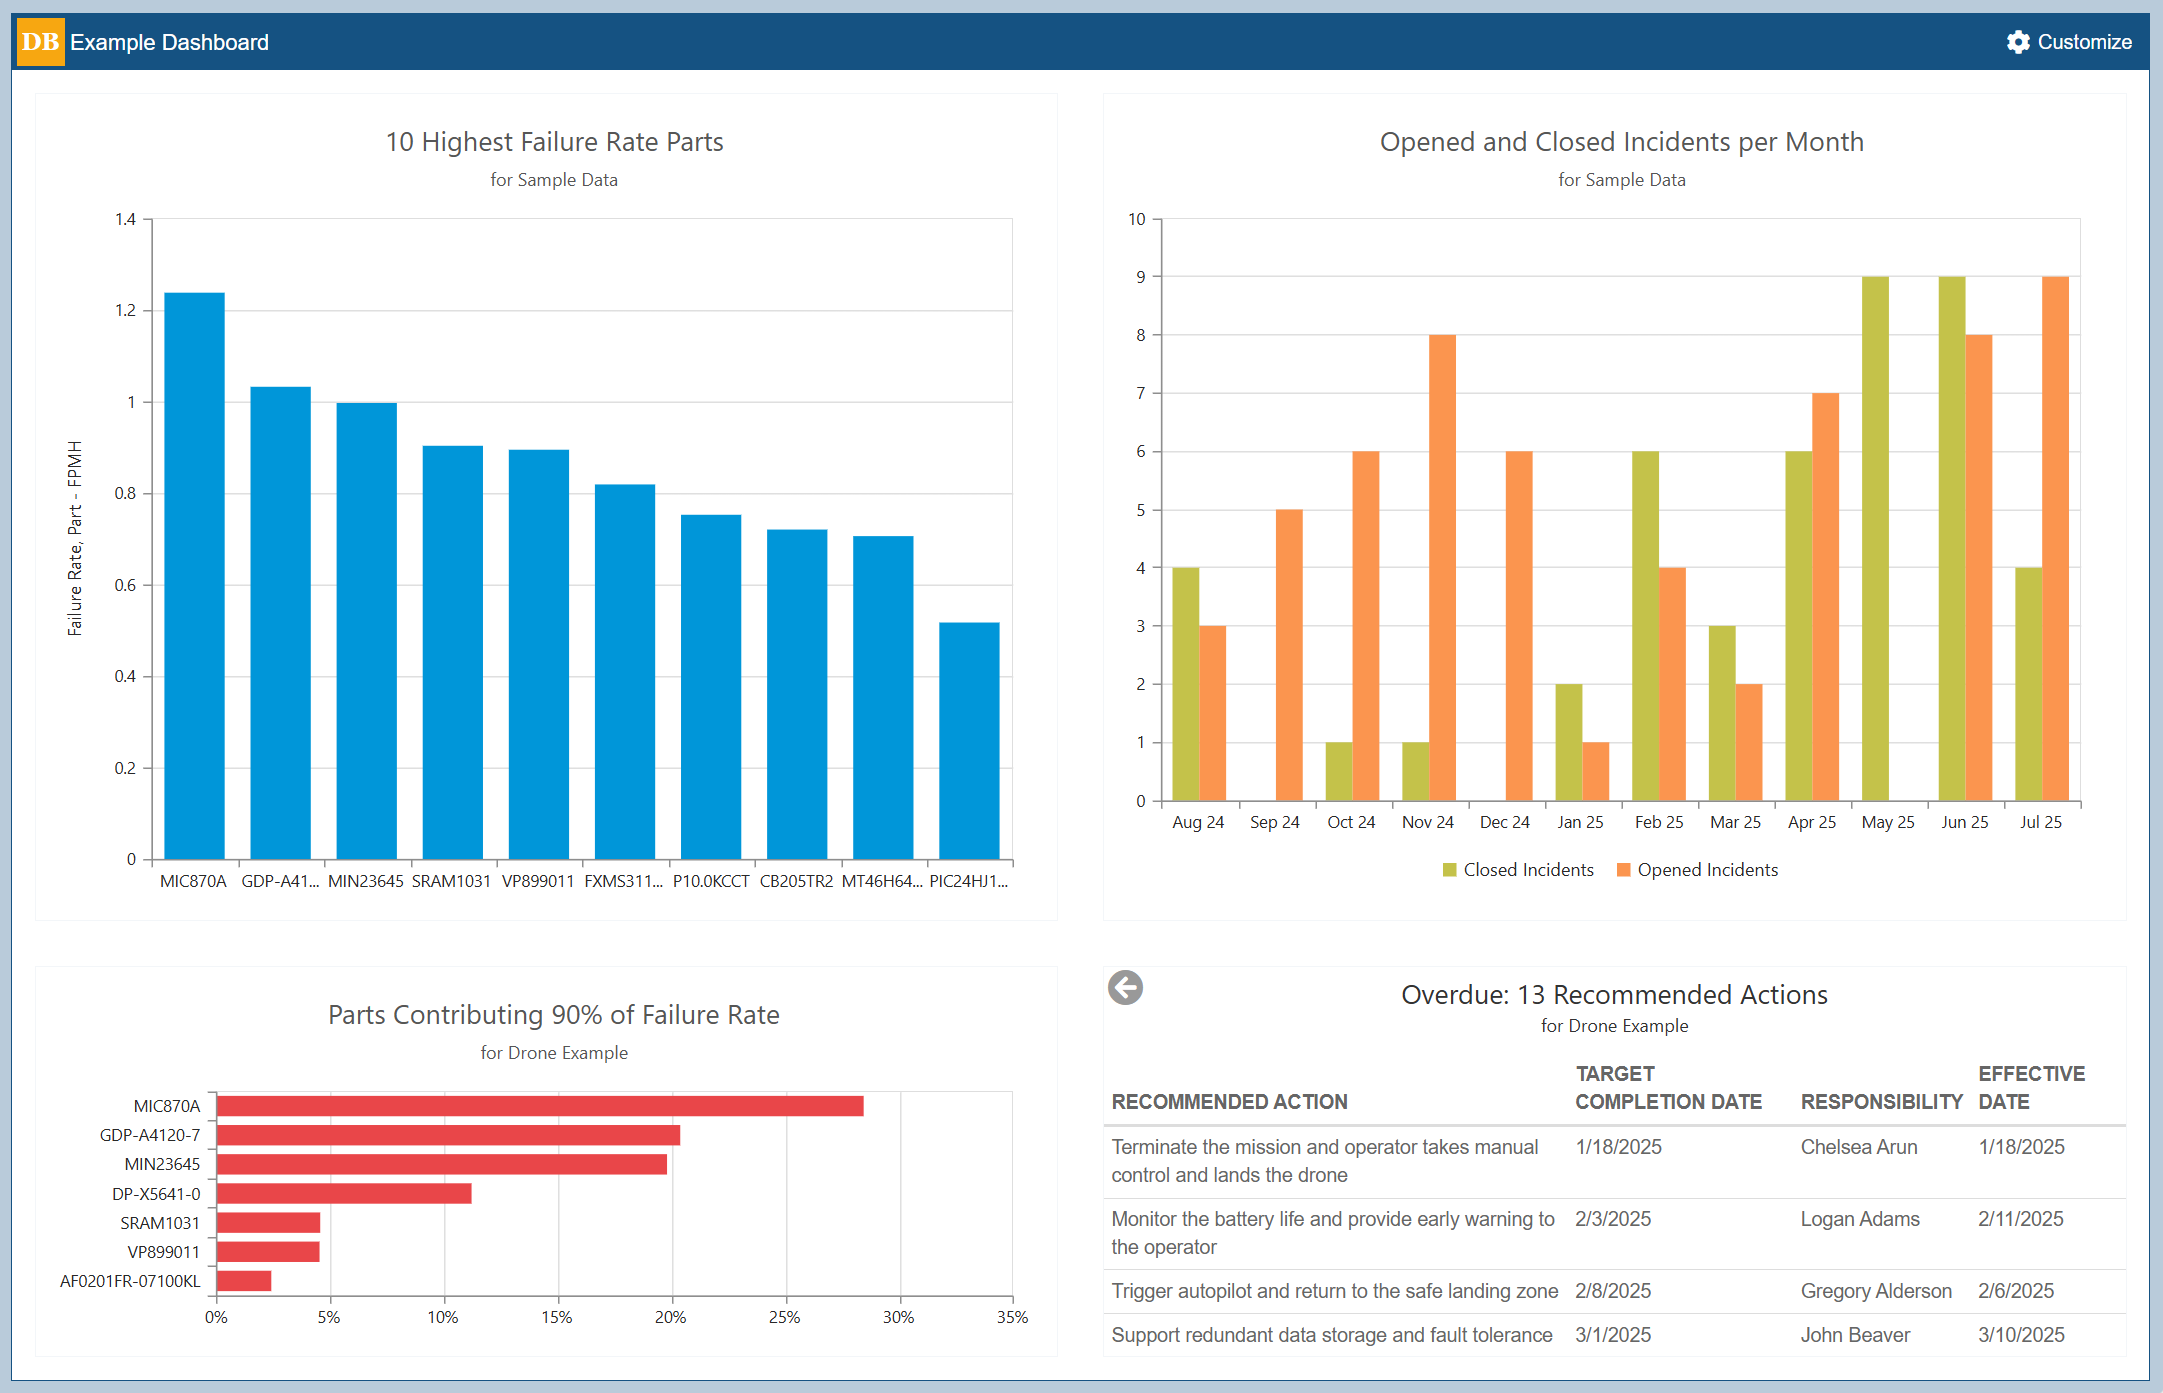
Dashboard Upgrades
- Check out an array of new Dashboard updates:
- Legends added to widgets like Total Incidents/Problems per Month and Open & Closed Incidents/Problems per Month.
- Customization options added to Recommended Action Status filters for DFMEA, PFMEA, and FMEA-MSR dashboards.
- Adjustable percentage threshold for the Prediction Parts Contributing N% of Failure Rate widget (formerly fixed at 80%).
- The Top N Failure Rate Parts widget now allows you to select a custom failure rate field.
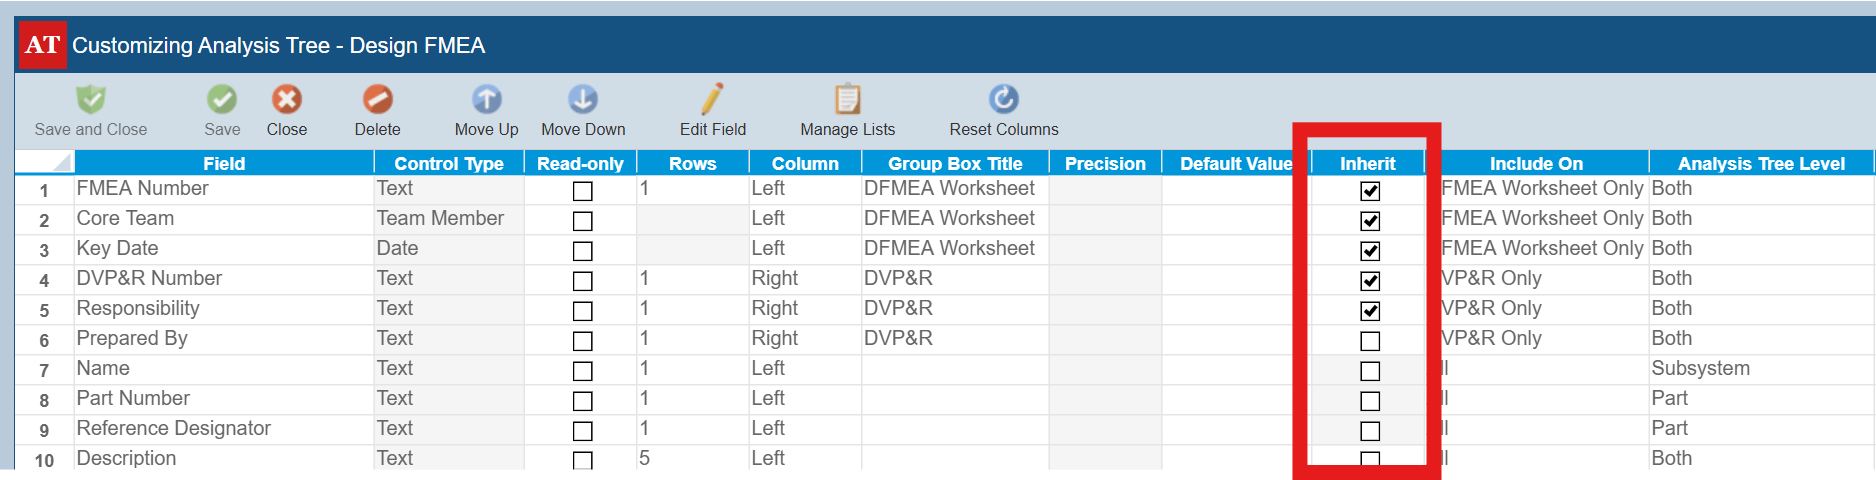
And More!
- Reduce repetitive data entry by using new feature to inherit values from higher-level Analysis Tree items.
- Scale Worksheet Reports to table size, improving layout and readability for large Worksheets.
- Select the Failure Rate Units for each Analysis rather than globally for all.
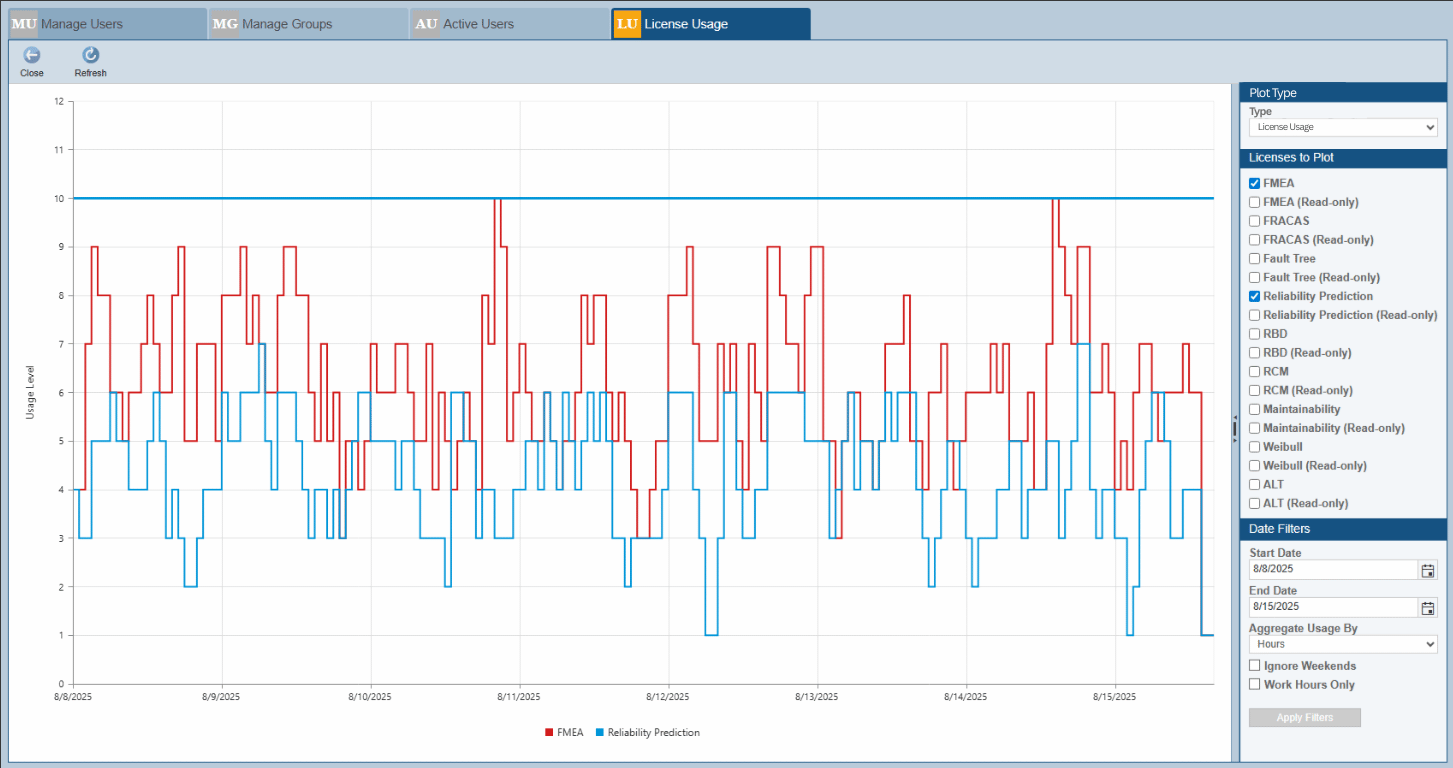
- Monitor detailed license information with the License Usage tab in Manage Users & Groups.
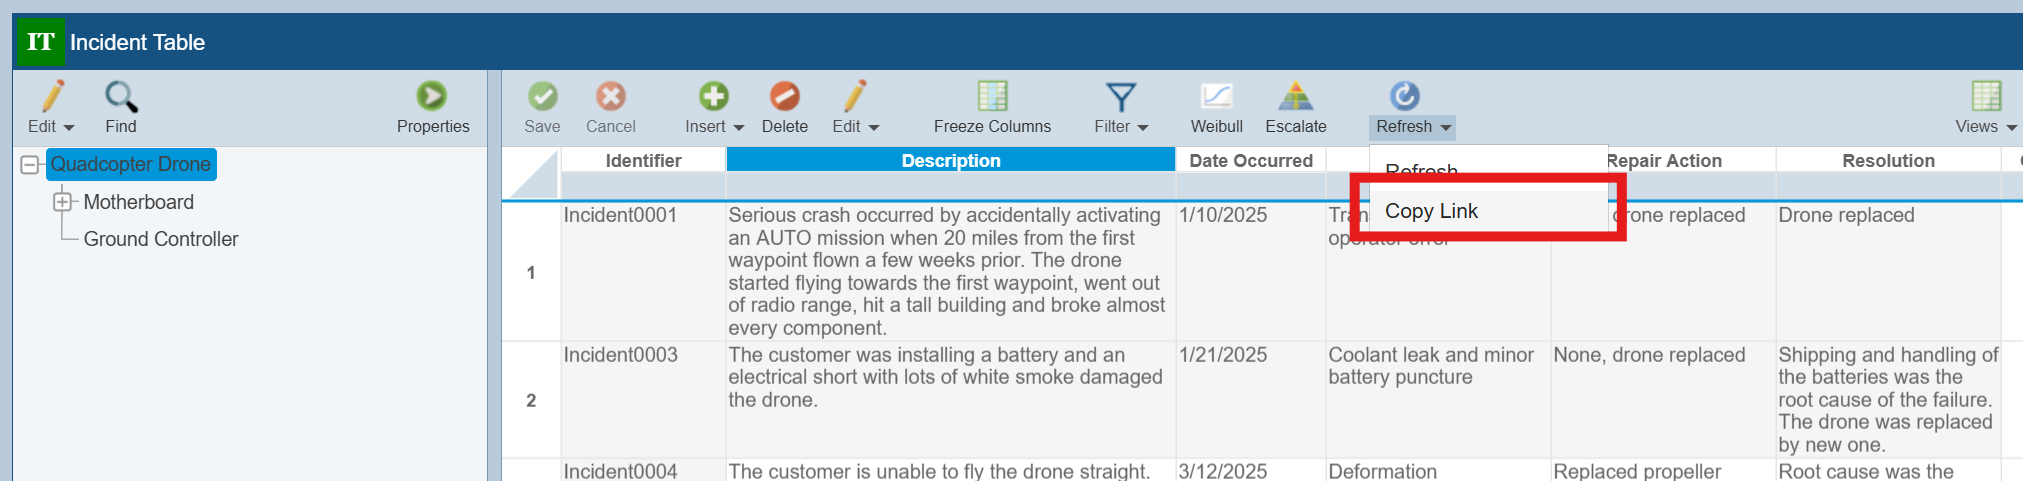
- Generate a shareable URL to a specific item in Relyence with the Copy Link function.
- Include Last Modified Date from your Analysis on Reports.
Upgrade Today to Relyence 2025 Release 2
With 2025 Release 2, Relyence continues to build on its reputation as the most comprehensive, user-friendly suite of reliability tools available. Our new release helps teams worldwide analyze faster, work more efficiently, and deliver results that meet the most demanding industry standards. We’re excited to see how these new tools improve your processes and as always, we welcome your feedback as we plan for future releases!
If you’re a Relyence Cloud-hosted customer, you can start exploring these features right away based on your plan! On-Premise users will receive them as soon as your installation is upgraded. As with every Relyence release, all new features and enhancements are included for active subscribers. Thank you for choosing Relyence. We’re proud to be your partner in achieving reliability success and look forward to continuing to support your goals.

Experience all the new features in Relyence 2025 Release 2 with a free 14-day trial. Want more details? Schedule a demo or reach out to our support team—we’d love to show you why you can Rely on Relyence!