The days may be getting shorter and colder, but we’re working as long as ever to bring you yet another cool release of our Relyence reliability tool suite! Relyence 2019 Release 4 will be our last software update for 2019, but we’re already hard at work on an amazing release slated for early 2020. As always, keep up to date on all that’s going on with Relyence by signing up for our bi-weekly newsletters and by following us on your favorite social media platform.
Announcing Announcements!
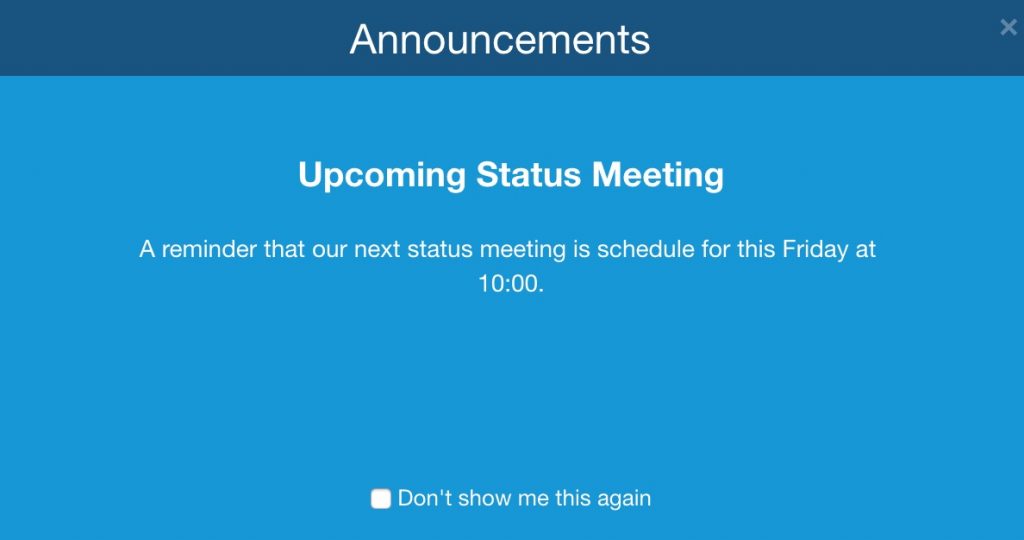
Relyence 2019 Release 4 offers the ability to create your own Announcements. Announcements may be used for any purpose you desire but are primarily intended to keep your team informed of important happenings.
Announcements will appear when a team member signs in to Relyence. You can create any number of Announcements and set starting dates and ending dates for them. By default, team members have the option on each Announcement to select “Do not show me this again”. Or, you can disable this capability so that a team member will always see the Announcement.
Relyence will automatically scroll through each Announcement, or users can progress through the Announcements using the next and previous arrows or select individual Announcements in the slider control.
Announcements are a great way to help with team communication, and to help everyone stay apprised of news and events.

Relyence Announcements enable you to keep your team members informed of important notices and events.
Analysis Status and Owners
As the hub for all your tasks, Relyence Analyses encapsulate all your vital information in one central place. Analyses contain data from all your Relyence Products: FMEA, FRACAS, Fault Tree, Reliability Prediction, RBD, Maintainability Prediction, and Weibull. To track and better control your Analyses, Relyence 2019 Release 4 adds two new data fields and two new Dashboard widgets for insight into your Analyses. You can now set the Status for your Analyses and assign team members as Owners.
The Status designation, by default, is set to a choice of New, In Progress, or Complete. However, you can customize the Status list to your preferences, or even choose to allow any text to be entered into the Status field.
You can choose any of your Relyence team members as Owners for your Analyses. In the Owners field, click the Team Member Selector control to access the listing of team members and select those you want to designate as Owners.
You can also include two new widgets on your Relyence Dashboards:
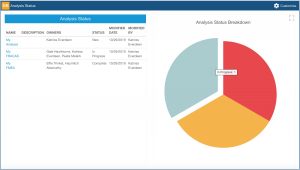
- The Analysis Status widget provides a listing of all Analyses that you have permission to view or edit. The listing includes the Analysis Name and Description, the Owners, the Status, the date last modified, and the team member who made the last modification. You can click on a row in the Analysis Status widget to open the associated Analysis.
- The Analysis Status Breakdown widget depicts the breakdown of your Analyses according to their Status. This provides a useful overview of the state of your Analyses. You can click on any slice of the pie chart to drilldown to see the list of Analyses in a specific Status state. You can then click on a row in the drilldown list to open the associated Analysis.

The new Analysis Status Dashboard widgets provide a quick overview of your progress.
View All
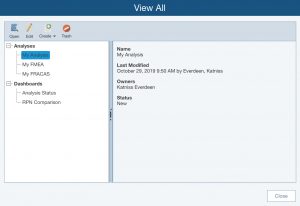
Relyence 2019 Release 4 introduces a handy new View All function. Accessible directly from the Sidebar menu, View All is a single location to view a list of all your Analyses, Revisions, and Dashboards. The Properties of the items are shown, including the Description, Owner, Status, and last modified information.
Along with the ability to view all your Analyses, Revisions, Dashboards and their associated Properties, the View All dialog encompasses several functions to manage your data entities. Select an Analysis, Revision, or Dashboard in the expandable tree pane on the left, and you can then click the Open button in the toolbar to open the selected item. Or, click Edit to edit its Properties. You can also delete items using the View All function.
Lastly, View All can be used to Create new Analyses, Revisions, and Dashboards. The Create button in the toolbar includes several functions for creating new items:
- Create>New creates a new Analysis or Dashboard
- Create>Duplicate makes a copy of an existing Analysis or Dashboard
- Create>Revision creates a Revision of an existing Analysis
- Create>Analysis from Revision enables you to recreate an Analysis from a Revision

The new View All feature is an easy way to manage your Analyses and Dashboards.
RPN Over Time
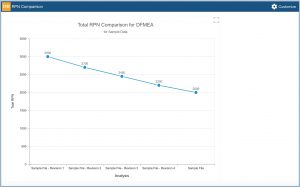
Relyence FMEA Dashboards now offer a new and insightful Total RPN Comparison widget. This widget computes the sum of all RPN (Risk Priority Number) values in an Analysis and the sum of all RPN values in each Revision of the Analysis. The resulting RPN values are then plotted on a line graph. This widget is helpful if you save your FMEA data in Revisions as it evolves. The graph enables you to see how your total RPN, or risk level, is trending over time.

The informative Total RPN Comparison Dashboard widget provides insight into your FMEA risk profile over time.
Free Trial of Relyence 2019
If you are not already a Relyence customer, you can sign up for completely free trial. No hassle, no strings, just register here and put us to the test!
Relyence 2019 Release 4 continues our tradition of always improving. Creating is our passion and we love nothing more than building and delivering tools that exceed your expectations. We strive to keep you front and center, and hope you continue to share with us your suggestions for new ideas and improvements.
Call today to speak to us about your requirements or schedule a personal demo at your convenience.


