LIFE DATA ANALYSIS
Relyence Weibull is built to maximize the analysis of your life data by enabling you to discover failure trends, predict future failure characteristics, and evaluate your failure data using Weibull techniques and other related distributions.
Data Types
Relyence Weibull supports the analysis of various types of life data. Starting with the most basic case, Relyence Weibull supports a list of times that represent failures. You can enter this time-based data in either an exact time format, or specify it in terms of time intervals as start times and end times. You can add to this basic failure time information by including a quantity, or the number of items which have failed for a particular time point. You may also choose to specify suspensions as part of your life data, allowing you to include data about units failing due to a different failure mode or continuing to operate.
Distributions
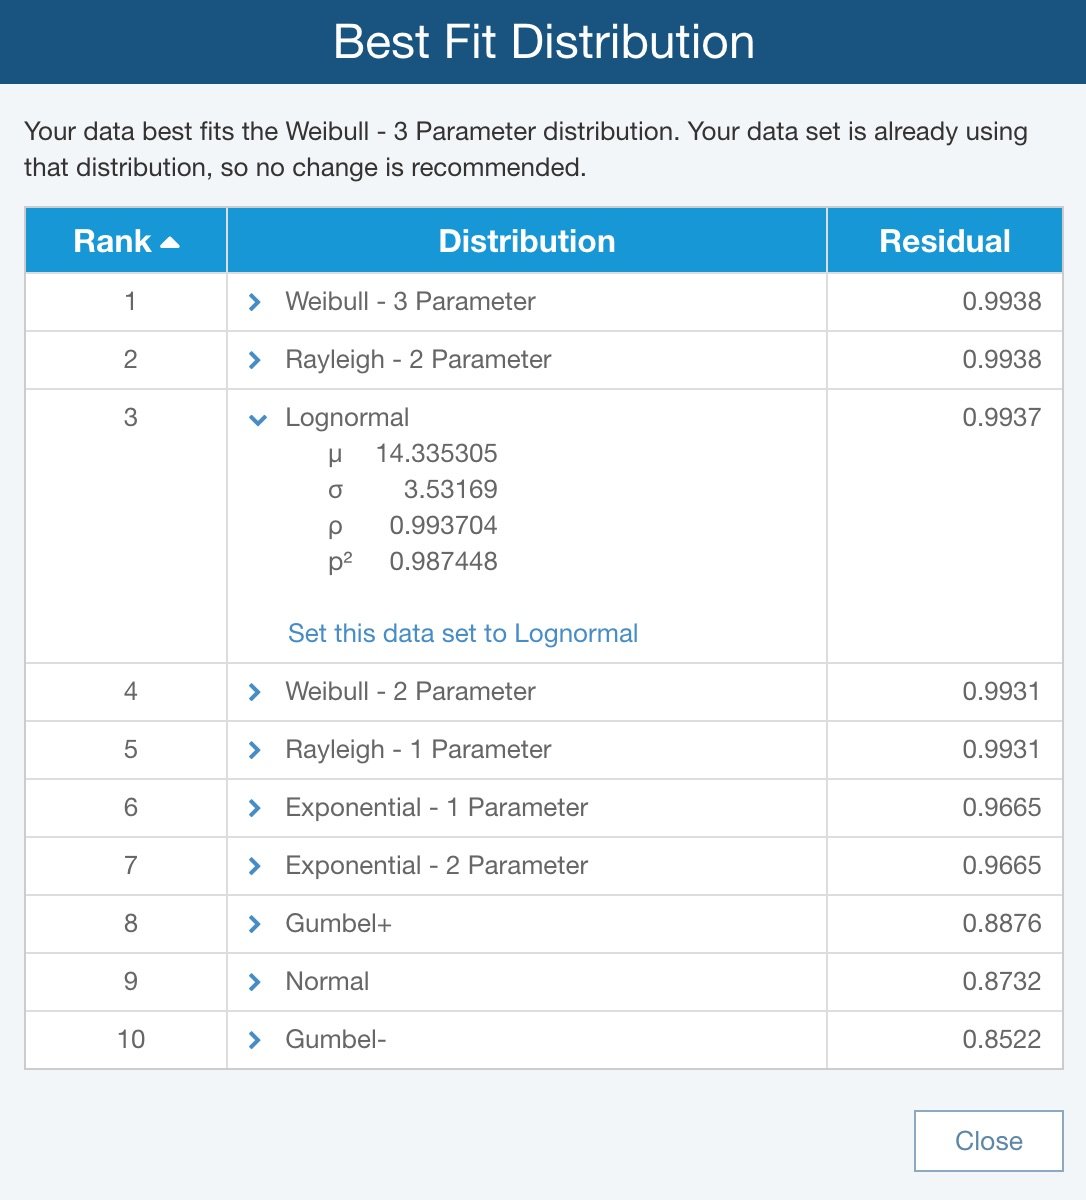
Relyence Weibull supports several distribution types for performing your analysis. The goal of Weibull analysis is to evaluate your life data and find a distribution, or failure curve profile, that best fits your data. If you prefer to use a particular distribution for your analyses, you may set the distribution directly. Or, you can use the built-in Best Fit feature to provide guidance for selecting the distribution that best suits your data. Relyence Weibull supports the following distributions: Weibull 2-parameter, Weibull 3-parameter, Lognormal, Normal, Exponential 1-parameter, Exponential 2-parameter, Gumbel+. Gumbel-, Rayleigh 1-parameter, and Rayleigh 2-parameter.
Calculation Properties
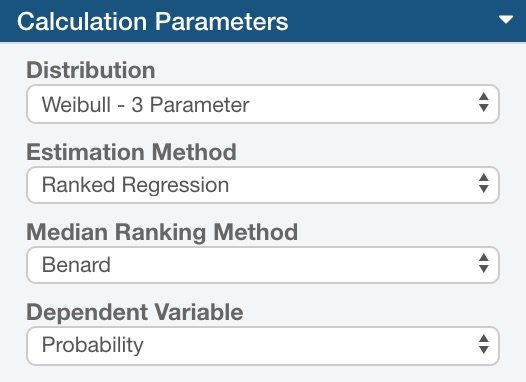
Relyence Weibull supports the following estimation methods: MLE (Maximum Likelihood Estimation), MMLE (Modified Maximum Likelihood Estimation), and Ranked Regression. When MMLE is selected, you can choose from either the RBA Median or RBA Mean type of MMLE. If Ranked Regression is selected, you can choose from either Time or Probability as the dependent variable. Relyence Weibull also offers support for a variety of Median Ranking Methods, including Median, Benard, Mean, Hazen, and Kaplan-Meier.
Competing Failure Mode Analysis
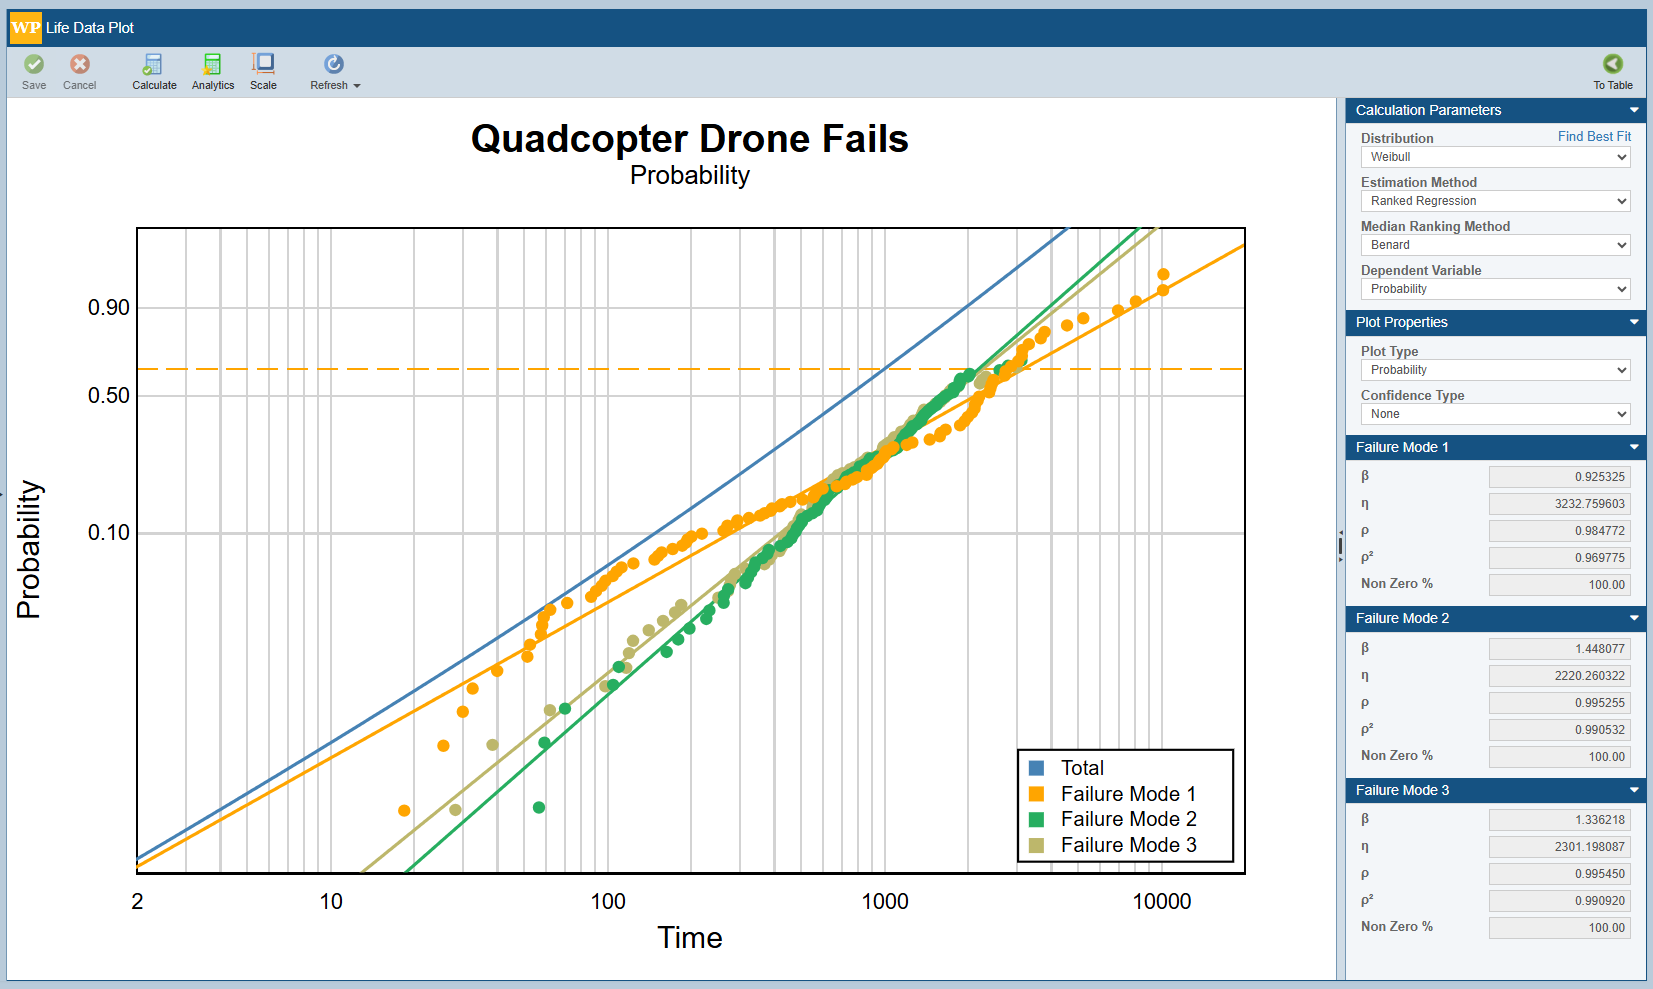
Products often experience multiple failure mechanisms, each with its own life distribution. If you combine all failures into a single data set, you may lose visibility into which failure mode is driving reliability issues. This is where Competing Failure Mode (CFM) analysis comes in. With CFM in Relyence Weibull, you can model up to five distinct failure modes independently. Simply enable the Calculate Competing Failure Modes option, assign Group Names to each data point, and map them to specific failure modes. This allows you to visualize both individual and combined failure behavior, leading to more focused and effective reliability improvements.
Importing Failure Data
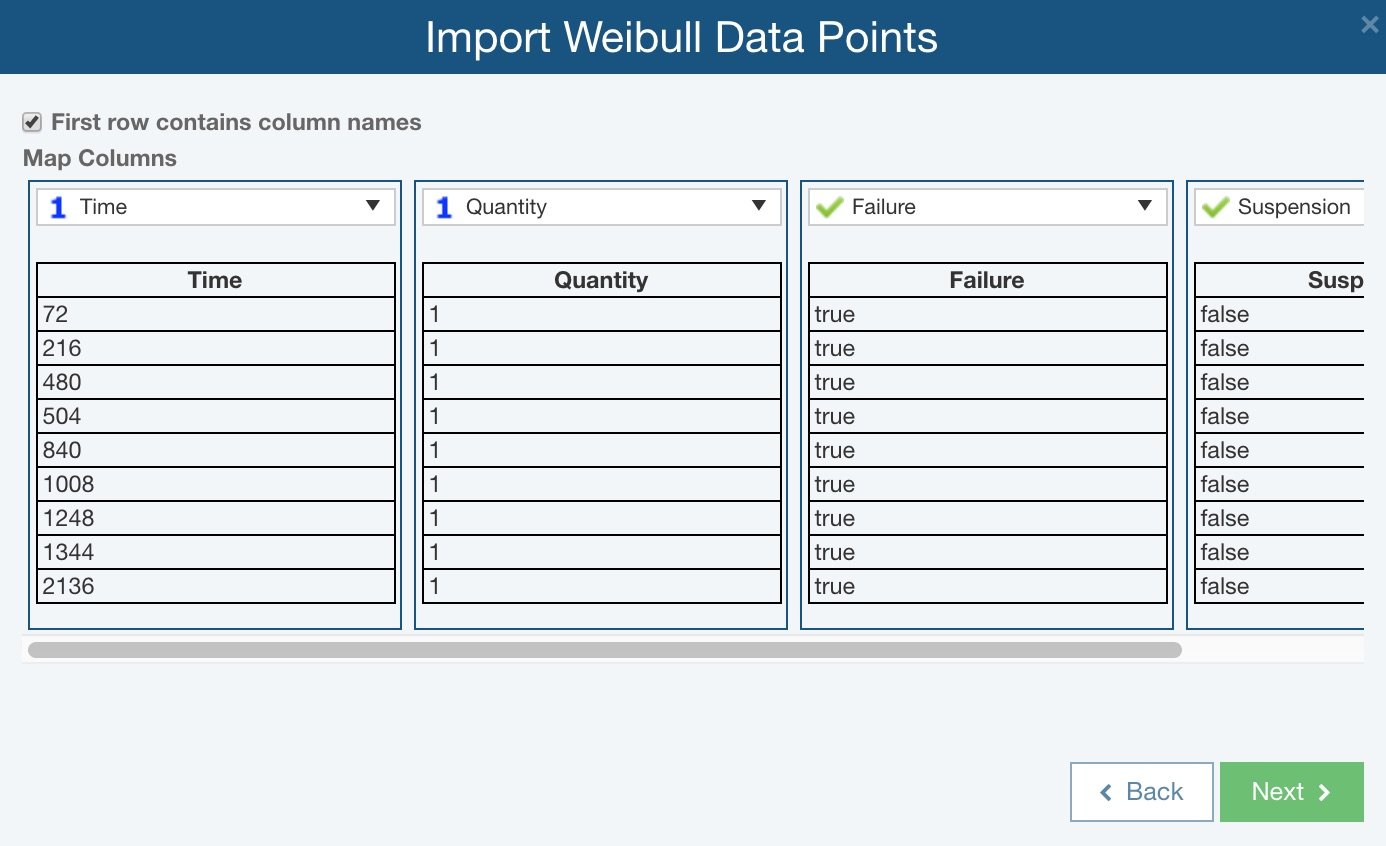
You can enter your life data directly into Relyence Weibull, however, you may want to import data from outside sources. Due to the nature of life data, you may have information in a variety of formats and from varying sources. In order to make your data gathering easy and streamlined, Relyence Weibull supports two ways of importing your life data. First, you can simply copy and paste failure data from an Excel spreadsheet directly into the Relyence Weibull Data Points Table. Alternatively, you can use Relyence’s flexible and intelligent Import feature. The Relyence Import capability guides you step-by-step through the process of importing your externally-sourced data. You can then save your Import for later reuse if you plan to do multiple similar imports.


