The summer heat is still on with our new Relyence 2019 Release 3! Our latest update demonstrates our ongoing commitment to remaining the most innovative and continuously improving reliability and quality software package available. This power-packed release offers an array of new capabilities across our product line, as well as including a number of ideas suggested by our customers. As always, keep them coming! Read on to learn about exciting new additions you will find in Relyence 2019 Release 3!
New AIAG & VDA FMEA
The anxiously awaited first edition of the new AIAG (Automotive Industry Action Group) & VDA (Verband der Automobilindustrie, or the German Association of the Automotive Industry) FMEA Handbook hit the stands in June. And Relyence FMEA is the first to fully support AIAG & VDA FMEAs as described in this comprehensive and effective new standard!
The AIAG & VDA standard, entitled “Failure Mode and Effects Analysis – FMEA Handbook” covers Design FMEA (DFMEA), Process FMEA (PFMEA), and Supplemental FMEA for Monitoring & System Response (FMEA-MSR). Published in cooperation between two widely recognized automotive industry groups, the AIAG & VDA standard is applicable to any organization performing design and process-based FMEAs. Along with a thorough explanation of using FMEAs to meet customer needs, the handbook introduces new concepts such as the 7-Step Approach, more focus on function-based FMEAs, and general guidance for implementing a robust FMEA methodology.
The 7-Step Approach described in the AIAG & VDA standard is described in detail for DFMEAs, PFMEAs, and FMEA-MSRs, but can easily be applied to any type of FMEA performed. The 7-Step Approach includes:
- Planning and Preparation
- Structure Analysis
- Function Analysis
- Failure Analysis
- Risk Analysis
- Optimization
- Results Documentation
The AIAG & VDA Handbook is well-written and easily understandable. For more details about the standard and information on purchasing, go here.
Risk Priority Number (RPN)
One of the primary elements of the FMEA process is risk assessment, and ultimately, the elimination or mitigation of identified failure risks. Up until now, RPN (Risk Priority Number) has been one of the primary methods employed to assess risk. One of the defining features of the new AIAG & VDA handbook was to review the handling of risk assessment regarding the usage of RPN. For that reason, it is important to first understand the concept of RPN.
Most Design FMEAs and Process FMEAs, as well as many other types of FMEAs, use RPN as a measure to prioritize actions based on risk. MIL-STD-1629-based FMECAs use a different risk assessment strategy based on criticality values. For details on the various FMEA types and their similarities and differences, including the different methodologies used for risk analysis, see our informative blog post on the subject.
RPN is based on Severity, Occurrence, and Detection values. Severity, Occurrence, and Detection values are typically defined based on a level system designated from least hazardous to most hazardous.
Severity is an indicator of the criticality of the effect of a particular failure mode. For example, based on a commonly used 1-10 level definition of Severity, 1 indicates there is no discernible effect of the failure, while 10 indicates unsafe operation or non-compliance with regulations.
Occurrence defines how frequently the potential failure may occur. In a common use case, 1 indicates that the failure cause is eliminated through the use of a preventive control (i.e. the design incorporates a measure to ensure the failure cause does not happen), and 10 indicates that there is a high risk of occurrence due to the usage of a new design or new technology with no history.
Lastly, Detection indicates how well the failure is discovered. For example, 1 indicates the failure cause is fully prevented through a design solution, and 10 indicates that there is no design control in place to detect the failure.
Computing RPN
Typically, RPN is then computed as Severity * Occurrence * Detection. Using a 1-10 scale for each of these measures, RPN results in a value between 1 – 1000. Based on this numerical analysis, a risk assessment is easily performed: the highest risk items have the highest RPN values.
Analysts may choose to modify the Severity, Occurrence, or Detection levels and use an internal system that is more applicable for their analysis requirements. Or, analysts may even choose to change the way RPN is determined and create a new way to compute RPN. For example, perhaps you only want to use Severity and Occurrence in determining an RPN value – a customizable RPN can allow this. Also, some organizations may use more than one risk measure, and more than one RPN value, each using their own equation. Relyence FMEA enables you to easily customize RPN and all related measures to suit your needs.
Essentially, RPNs are widely used in FMEAs, and adaptable RPN assessments have allowed FMEA analysts to customize risk assessment measures to their needs. So, RPN remains an important part in FMEA practice today.
Action Priority (AP)
One of the newest innovations found in the AIAG & VDA standard is Action Priority, or AP.
Action Priority is a new rating method for risk assessment that can be used in your FMEAs.
The AIAG & VDA FMEA Handbook introduces the concept of Action Priority as a replacement or adjunct to RPN for risk assessment. Action Priority is a level that is determined based on Severity, Occurrence, and Detection values, similar to RPN. The AP ranking system was developed in order to give more emphasis to Severity first, then Occurrence, and then Detection. Per the AIAG & VDA standard, Action Priority values are defined as:
- H (Priority High): These items are the highest priority for review and action. You need to either recommend an appropriate action to improve Prevention and/or Detection Controls for this item, or document why your current Controls are acceptable.
- M (Priority Medium): These items are medium priority for review and action. You should recommend appropriate action to improve Prevention and/or Detection Controls, or, optionally, document why your current Controls are acceptable.
- L (Priority Low): These items are low priority for review and action. You could recommend appropriate action to improve Prevention and/or Detection Controls.
Customizing RPN and AP in Relyence
In Relyence FMEA, you can add Action Priority to your FMEA Worksheets. You can use AP in place of, or in conjunction with, RPN. You can completely customize AP levels, and, as always with Relyence, you can customize your Severity, Occurrence, and Detection rating levels. If you want to add more AP levels, or change the basis for AP ranking determination, you can do this using the Action Priority customize feature. You can also custom color-code Action Priority levels in your FMEA Worksheets.
New FMEA-MSR
The AIAG & VDA FMEA Handbook also defines a new FMEA type: Monitoring and System Response FMEA, or FMEA-MSR.
FMEA-MSRs supplement DFMEAs and consider how a product will fail when in use by the customer. The intent of FMEA-MSRs is to keep products safe or ensure that a product remains in compliance with regulations (such as environmental statutes). As with all FMEAs, FMEA-MSRs analyze potential failure modes and the resulting effects on the system. A main consideration of FMEA-MSRs is to determine if a customer will detect a failure if it occurs. FMEA-MSRs have been introduced in order to make sure safety goals required by ISO 26262 are met.
Relyence FMEA includes a supplied template for a FMEA-MSR Worksheet. You can use this Worksheet as-is, or modify it as needed to perform your Monitoring and System Response FMEAs.
Multiple Knowledge Banks in Relyence FMEA
The Relyence FMEA Knowledge Bank provides a powerful way to automate your FMEA through the reuse of knowledge gained from all your prior and current FMEAs. The Knowledge Bank grows over time as you continually add to your Knowledge Bank on an ongoing basis. Used across teams, departments, or individuals, you can ensure that everyone has access to historical data so duplicate work and inefficiency are eliminated. You can be sure that you are performing FMEAs in a consistent, organized, and trackable manner. One of the significant advantages of utilizing the Relyence FMEA Knowledge Bank is that your vital lessons learned are never lost.
The FMEA Knowledge Bank is one of the most noteworthy innovations unique to Relyence and is a key part of the proven power and functionality of Relyence FMEA. Providing FMEA automation and empowering you to keep your FMEAs in sync, the Knowledge Bank has become a hallmark of the Relyence brand.
In Relyence 2019 Release 3, we’ve added the ability to create and control multiple Knowledge Banks for ultimate flexibility. You can use more than one Knowledge Bank for any reason you desire. Perhaps you want to separate Knowledge Banks based on team or based on product line. The choice is yours, and the streamlined design of our Knowledge Bank capability remains intact!
Subtables in Relyence FRACAS
Relyence Failure Reporting, Analysis, and Corrective Action System (FRACAS) provides a complete tracking and control framework handling issues of any type. Whether you want to track customer issues, audit report findings, compliance concerns, safety issues, software bug reports, or incidents of any type, Relyence FRACAS is built to handle your needs.
Recognizing that no two corrective action processes are the same, Relyence FRACAS provides complete customization capabilities. Built-in support is provided for an array of commonly used process management methodologies, such as 8D, DMAIC, or PDCA. You can use our supplied templates as-is, or modify them as desired, or design a completely custom process.
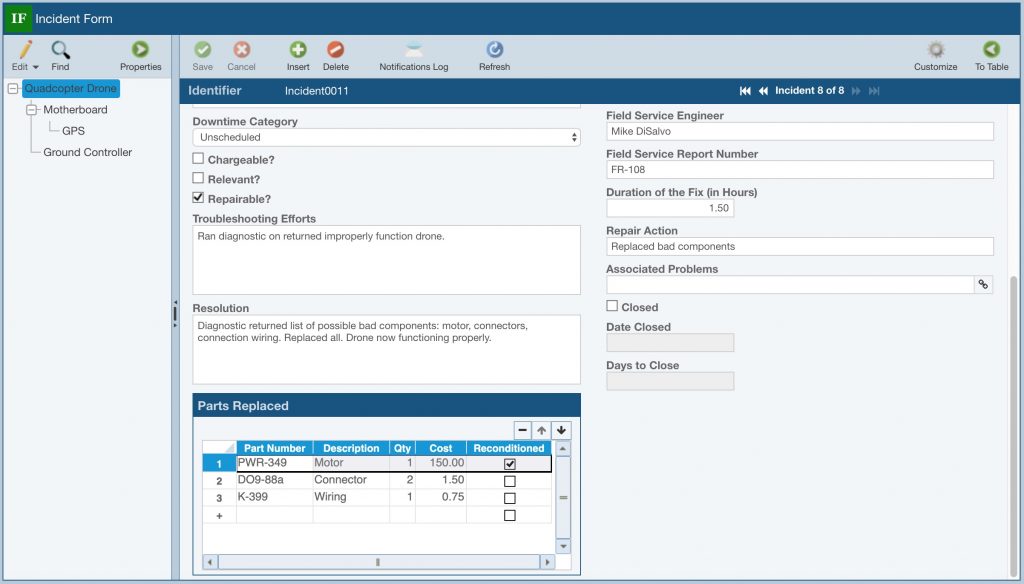
Relyence 2019 Release 3 now offers the ability to add Subtables to your FRACAS data entry steps. Subtables, or small tables of data, can be used for any purpose, and are completely customizable. You define a Subtable based on the columns of data you want to enter. Subtables can then be placed on any of your FRACAS Incident or Problems Forms and you can enter rows of data into the table as needed.
For example, you may want to include a list of components replaced during a repair. A Subtable can be used to easily handle this:

Relyence FRACAS supports using fully customizable Subtables on forms for data entry.
The uses of Subtables are unlimited, so feel free to use this new feature to enhance your FRACAS data capture!
Intelligent Part MappingTM in Relyence Reliability Prediction
Relyence Reliability Prediction provides failure rate and MTBF calculations for your systems based on the worldwide accepted standards for prediction analyses: MIL-HDBK-217, ANSI VITA 51.1, Telcordia, 217Plus, and China’s GJB/z 299.
The basis of all reliability predictions is the list of components which comprise your product. Relyence Reliability Prediction provides several ways to enter your parts list for maximum efficiency. You can directly enter your parts using our intuitive user interface, you can import your list, you can take advantage of the Relyence supplied Parts Libraries for quick look-up and retrieval of part data, and you can include components from the NPRD/EPRD databank into your analyses. You can also augment the supplied Parts Libraries with your own database of parts.
Intelligent Part Mapping
Relyence 2019 Release 3 introduces another new innovation for Reliability Prediction parts entry: Intelligent Part Mapping. Intelligent Part Mapping reviews your part Description, determines the matching component information, and extracts as much part specific data as possible. Intelligent Part Mapping can be used during data entry and also during importing. A short list of some examples of Descriptions that Intelligent Part Mapping recognizes includes:
- CAP CER 10uF 50V
- IC Logic
- RES Thick Film
- CAP 50 nF
- RCR 5W
- Zener
- DIODE
- EEPROM
- FPGA
- CERM 0.2 pF
This new capability is continually being updated as more information is gathered and learned. Give this a test run today and see the efficiency of your part data entry improve!
Excel-based Dashboard Reports
Analysts, reliability engineers, team leaders, and managers have come to rely on the Relyence Dashboard to provide a concise, visual overview of quality and reliability metrics. Supporting cross-module analytics, the Relyence Dashboard offers the ability to monitor all your quality activities at a high level, while providing drill-down capabilities for in-depth review.
With Relyence 2019 Release 3 you can now export tabular Dashboard widgets to Excel spreadsheets. This enables you to include your table-based data in reports, use them in presentations, or integrate with other applications.
Simply hover over the upper left corner of your Dashboard widget until the Excel Report icon appears and click to generate a report. The resulting Excel spreadsheet will be automatically downloaded to your default downloads folder.
You can generate an Excel-based report from any tabular Relyence Dashboard widget.
Importing Users
For large teams, it may be helpful to import your list of users directly into Relyence. The new Import Users function in Relyence 2019 Release 3 enables you to import your users and associated information from an Excel based file. You can optionally include as much data about each user as you prefer, such as Title, First Name, Last Name, Company, Phone Number, Email, and the list of Groups they belong to. Exporting the Relyence user list is also supported.
You can access the import and export users function from the Manage Users and Groups feature found in the Account dropdown menu in the upper right corner of the Relyence header bar.
Show Feature to Control Data Displayed in Table Views
The new Show capability in Relyence 2019 Release 3 allows you to configure your Table views to include the data you prefer. When viewing data in your FMEA Worksheets, Reliability Prediction Parts Table, and FRACAS Incident and Problem Tables, the Show toolbar button offers several options to control the data displayed.
In Relyence FMEA:
- By Subsystem: Displays the FMEA data associated with the selected Subsystem in the Analysis Tree.
- By Branch: Displays the FMEA data associated with the selected Subsystem and its children (i.e. the branch) in the Analysis Tree. For example, if you are on the top-level item in your Analysis Tree in FMEA and select Show>By Branch all FMEA data in your Analysis will be shown.
- All: Shows all FMEA data across your entire Analysis Tree.
In Relyence FRACAS:
- By Subsystem: Displays the Incidents or Problems associated with the selected Subsystem in the Analysis Tree.
- By Branch: Displays Incidents or Problems associated with the selected Subsystem and its children (i.e. the branch) in the Analysis Tree. For example, if you are on the top level item in your Analysis Tree, and select Show>By Branch all Incidents or Problems in your Analysis will be shown.
- Unassociated Incidents or Problems: Shows the Incidents or Problems that are not associated with any Analysis Tree item.
- All: Displays all Problems or Incidents in the entire Analysis Tree.
- By Incident: Displays the Problems associated with the Incident selected in the Incident Table when on the Problem Table.
- By Problem: Displays the Incidents associated with the Problem selected in the Problem Table when on the Incident Table.
In Relyence Reliability Prediction:
- By Subsystem: Displays the Parts associated with the selected Subsystem in the Analysis Tree.
- By Branch: Displays the Parts associated with the selected Subsystem and its children (i.e. the branch) in the Analysis Tree. For example, if you are on the top-level item in your Analysis Tree and select Show>By Branch all Parts in your Analysis will be shown.
- All: Shows all Parts in your entire Analysis Tree.
And More…
As always, there is an array of additional features included in this release. A short list of additional newly introduced capabilities in Relyence 2019 Release 3 includes:
- Deleted Analyses are now moved to a Trash bin so they can be recovered if needed. In the Manage Analyses feature found in the Account dropdown, deleted Analyses can be viewed, restored, or permanently deleted by clicking the Advanced button in the toolbar.
- Team member dialogs now include a handy “Find” text box that enables you to filter your team list. This is helpful when you have a large list of team members and you want to filter the list to more easily locate user names.
- New symbols have been added for use in Process Flow Diagrams (PFD) to support AS13004. New symbols include Administration, Packaging Interaction, Lift, and Load/Install.
- You can now generate reports on calculation results for FRACAS, Reliability Prediction, and Reliability Prediction What-If? computations. These smaller reports encapsulate calculated results in an easy-to-view format.
Free Trial of Relyence 2019
If you are not already a Relyence customer, you can sign up for completely free trial. No hassle, no strings, just register here and put us to the test!
Relyence 2019 Release 3 continues our tradition of always improving. Creating is our passion and we love nothing more than building and delivering tools that exceed your expectations. We strive to keep you front and center, and hope you continue to share with us your suggestions for new ideas and improvements.
Call today to speak to us about your requirements, or to schedule a free webinar to see the power of Relyence in action!


