Summer has arrived and with it comes a new release from Relyence! Through the first half of 2021, we have been hard at work advancing the Relyence tool suite – continuing our commitment to always improving. With Relyence 2021 Release 2 we are introducing new exciting features along with product enhancements to make your reliability analyses even more effective. As always, our main goal is to keep Relyence as the best-in-class RAMS solution across the board. To that end, Relyence 2021 Release 2 includes both entirely new features as well as product developments that are designed to make your job easier and improve your productivity. With this release, we have made improvements across our entire product line!
New! Boundary Diagrams in Relyence DFMEA
FMEA Boundary Diagrams provide a visual representation of the components of a system including the interfaces between components and external factors, such as environmental effects and human interactions. Boundary Diagrams are an optional, but helpful, part of the FMEA process. They are typically used as the first step in the DFMEA process to better define the scope of analysis.
The intent of a Boundary Diagram is to improve understanding of the system under consideration by providing a graphical diagram of its interactions with internal and external elements. Because Boundary Diagrams are fully customizable to your needs, they can be useful as an upfront brainstorming tool to help ensure all appropriate factors are taken into consideration in the DFMEA. For example, Functions in DFMEA can easily be added based on the interfaces defined in the Boundary Diagram. Additionally, knowledge gained from constructing a Boundary Diagram can be valuable in P-Diagram analysis.
Boundary Diagrams are typically constructed using a set of graphical elements. The list below includes the elements most often used when constructing a Boundary Diagram. All of these elements are built into Relyence FMEA. Additionally, you can add to this list to create your own elements, as well as customize the built-in elements as you prefer using the Relyence Configure feature.
- Blocks: In Relyence Boundary Diagrams, Blocks are used to portray the internal and external factors, system boundary, and any additional diagram descriptors. By default, Relyence includes the following Block diagram elements:
- Analysis Tree Subsystem: Represents a Subsystem that is present in your Analysis.
- Boundary: The Boundary is intended to represent the scope of analysis. Items within the Boundary represent the parts of the system that are to be considered in your analysis. Typically, Blocks within the Boundary are components that are under the control of your analysis team.
- External Factor: Represents an external element whose interactions with other diagram elements should be considered. Examples of External Factors may include environmental effects and human interactions.
- Legend: A legend, or key, which defines the types of Interfaces that appear on the Boundary Diagram.
- Other Subsystem: Represents a Subsystem that is not present in your Analysis but whose interactions with other diagram elements should be considered. Other Subsystem Blocks are flexible and can be used to represent various components types. Some examples include:
- Components that share a relationship with the system under consideration but are under the control of another team.
- Components that are purchased off-the-shelf or from a third party.
- Components that are part the system but are to be evaluated outside this analysis or at a later time.
- Text: Can be used as a label on the Boundary Diagram to provide additional text descriptions where needed.
- Interfaces: In Relyence Boundary Diagrams, Interfaces are used to describe the interactions between elements. Relyence offers five interface options out-of-the-box:
- Data Exchange: Represents an exchange of information between elements. For example, the interaction between a TV and remote control.
- Energy Transfer: Represents a transfer of energy from one element to another. For example, the heat exchange between a CPU and a heat sink.
- Human-Machine: Represents an interaction between a user and a diagram element. Examples of systems that have a Human-Machine interface are gas and brake pedals in a car, keyboards, and many types of switches.
- Material Exchange: Represents an exchange of any type of material from one element to another. For example, the flow of gasoline from a car’s gas tank to the combustion engine.
- Physical Connection: Represents elements that are physically connected. For example, components that welded, bolted, or clamped together.
Note: The Block and Interface elements offered out-of-the-box by Relyence are based on the June 2019 publication of the AIAG & VDA FMEA handbook.
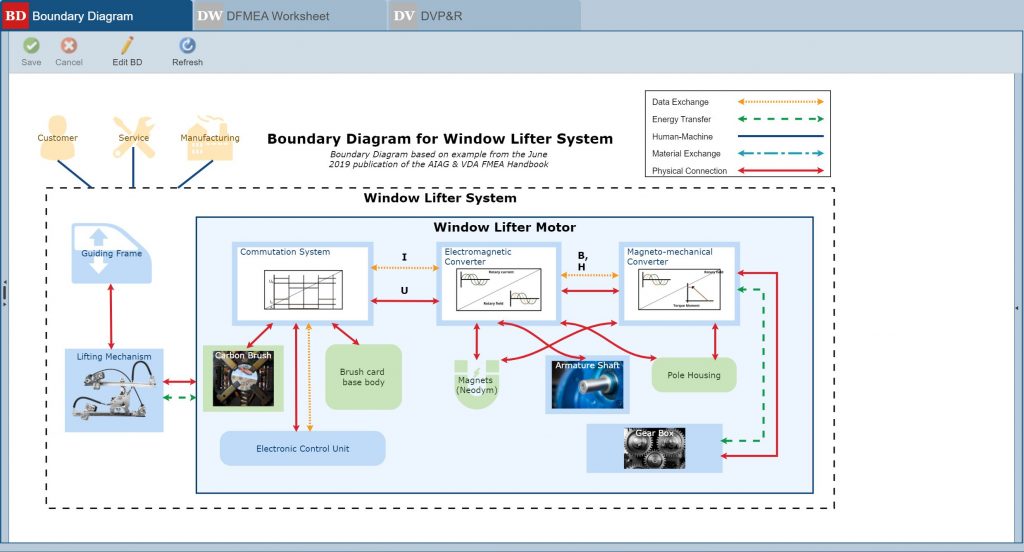
Boundary Diagrams provide a graphical overview of a system’s components and connections to other elements. (Boundary Diagram is based on the example from the June 2019 publication of the AIAG & VDA Handbook.)
Once built, the Boundary Diagram provides a clear visual overview of a system’s structure and the interactions to be analyzed. Boundary Diagrams are powerful tools to help better understand the design at a high level before the more detailed design analysis begins.
With Relyence 2021 Release 2, Boundary Diagrams are available as an optional element that can be enabled in Relyence DFMEA. Boundary Diagram construction is accomplished using a drag-and-drop style visual editor to place, move, and resize diagram elements. You can fully customize your Boundary Diagrams by adding elements, and changing element labels and appearances to meet your needs. Additionally, interface data from your Boundary Diagram can be added as or connected to Functions in your DFMEA Worksheet using the Insert Boundary Diagram Data feature.
New! Analytics Calculator in Relyence Weibull
Weibull analysis, or Life Data analysis, is a methodology for analyzing a sample set of life data, or failure data. Weibull statistical techniques are employed to fit the data to a distribution. From this, future trends can be extrapolated. For example, Weibull analysis can be used to assess the probability of a system operating over a time interval, analyze the mean life of a system, predict failure rate, or even determine a warranty period.
Relyence Weibull now includes an Analytics calculator that can be used to calculate various Weibull metrics. Metrics available for calculation include Bearing Life (used to calculate B10 Life), Probability of Failure, Failure Rate, Mean Life, Warranty Time, and more. In addition, Confidence interval information can be optionally calculated for Confidence Types of Upper, Lower, Double, or Upper and Lower using either the Fisher Matrix or Likelihood Ratio methods. The Analytics calculator can be accessed by clicking the Analytics button in the top toolbar of Relyence Weibull.
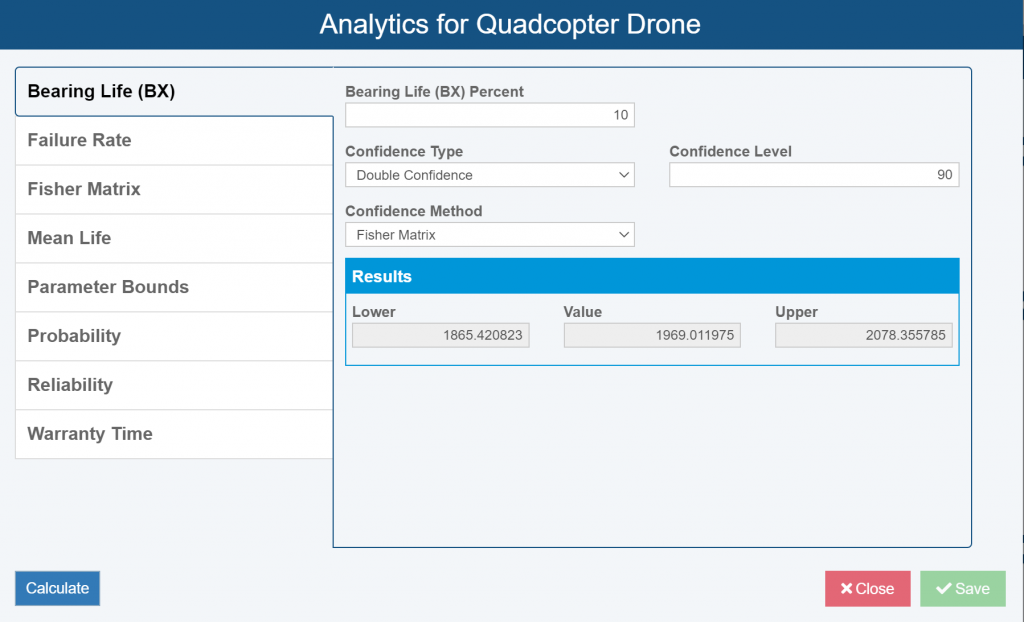
The Weibull Analytics calculator allows you to compute a variety of point-based metrics from a set of life data.
Cut Sets in Relyence RBD
An RBD cut set is a group of system components that, upon failure, lead to an overall top-level system failure. That is, if all blocks in a cut set are non-operational, the system will fail. Cut set analysis is a crucial element to consider as part of overall system assessment. By providing insight into the components that are most critical to system operation, cut sets can be used to help target the areas that most affect system performance for product improvement efforts.
Relyence 2021 Release 2 introduces the ability to calculate cut sets in Relyence RBD. Calculation results are presented in a table format on a separate tab on the RBD Results dialog. The results include the individual block names that make up each cut set with their availability, as well as the overall availability of the cut set. In addition, Order and Availability Cutoffs are provided as calculation options to omit improbable cut sets from the results.
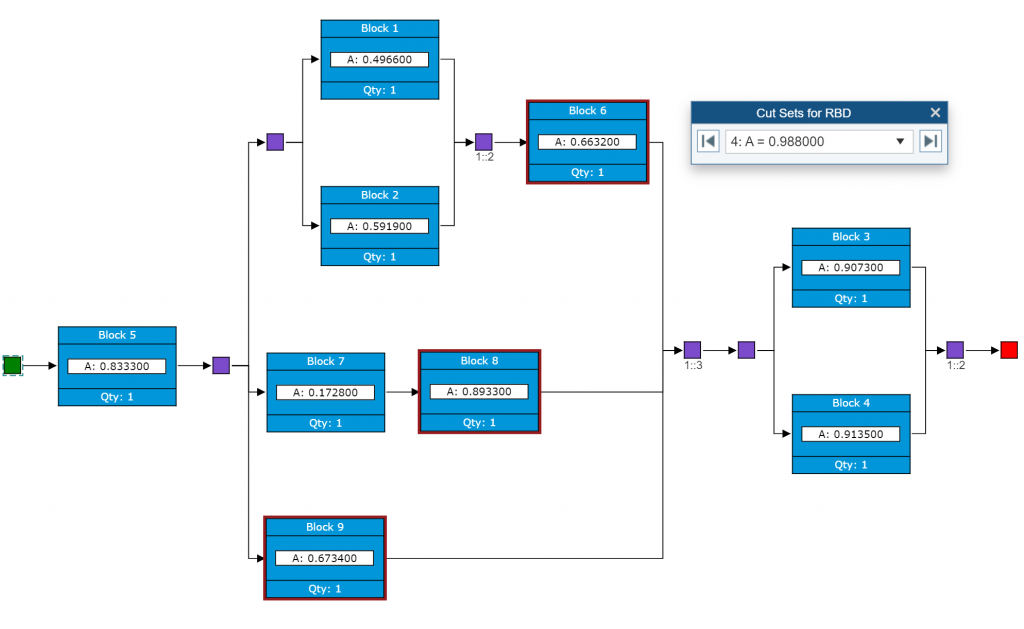
Cut Set results can be viewed using the Cut Set Highlighting feature as well as in reports.
In addition to table-based cut set results, the Cut Set Highlighting feature enables you to see cut set metrics directly on the graphical RBD. This provides a uniquely intuitive format to view cut set results. It is helpful for presentations or when working in a collaborative team environment. The RBD Cut Set Highlighter tool sequentially highlights each cut set on your diagram and also enables you to select a specific cut set to highlight. In addition, to view cut set results at a high level, a new RBD Cut Sets widget can be included on any Relyence Dashboard.
Additional Product Enhancements
Along with our new enhancements to FMEA, Weibull, and RBD, Relyence 2021 Release 2 also introduces a number of valuable new features to other products in our Reliability Studio platform:
- New in Relyence Reliability Prediction – new Derating Profile field can be added to reports to include the Derating Library name and overstress criteria.
- New in Relyence Maintainability Prediction – Maintenance Level and Maintenance Time data fields can be added on the Analysis Tree Properties page. These fields can be included on reports and in exported files.
- New in Relyence ALT – Bearing Life, which is used to calculate B10 Life, metric can be computed in the Analytics Calculator.
- New in Relyence Fault Tree – option to automatically display unique Identifiers for all Gates and Events in diagrams and tables.
- New in Relyence FRACAS – ability to import Subtables based on the Incident or Problem Identifier field.
Additionally, new widgets have been added to the Relyence FMEA Dashboard to provide even more options for high-level insight into your FMEA data:
- FMEA Cause Breakdown: Provides a pie chart breakdown of your FMEA Cause information. Causes can be classified and sorted into pie chart segments based on any Cause-level text field.
- FMEA Revised Values Complete: Provides a pie chart breakdown of the status of Recommended Action related data in your FMEA. Data is sorted into the corresponding pie chart segments based on the completion status of the Recommended Action and the Revised Severity, Occurrence, and Detection fields.
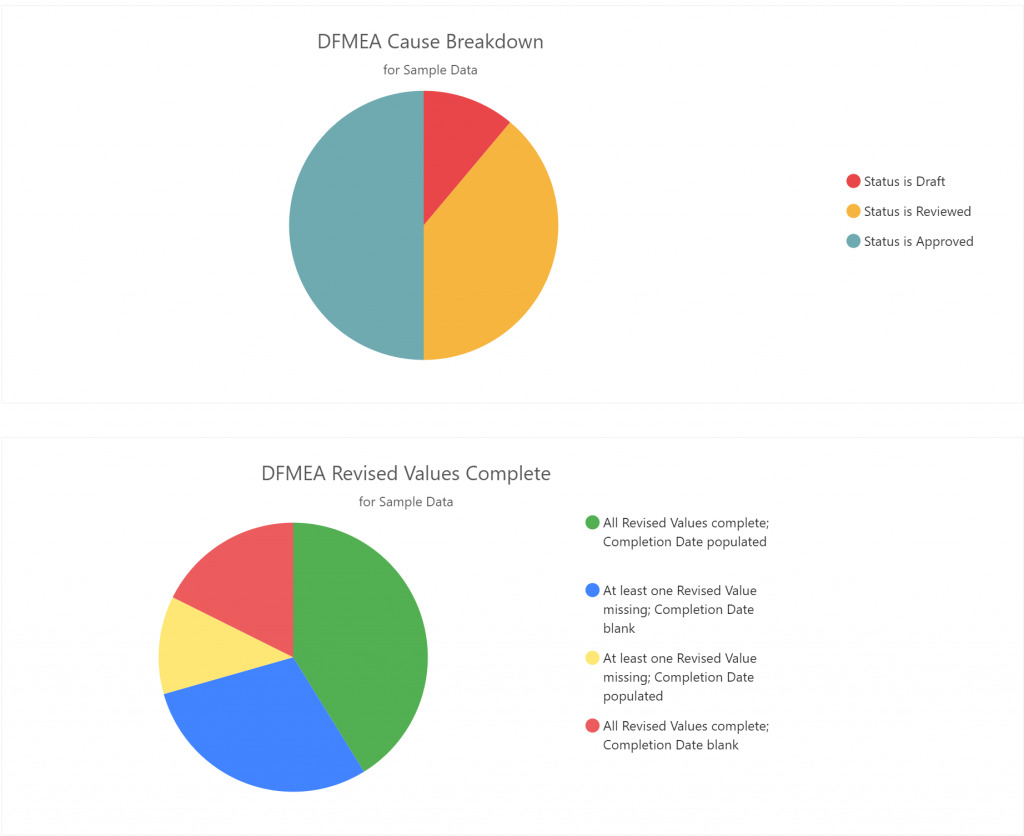
Two new useful widgets have been added to the FMEA Dashboard: Cause Breakdown and Revised Value Complete.
Free Trial of Relyence Reliability Software
As always, we offer a “Thank you!” to all our customers for the valuable feedback and recommendations that led to these new enhancements. Please keep them coming! You all help us to continually advance Relyence and to remain the best in our field!
If you are a current Relyence cloud-based customer, you will see all the new capabilities now. If you are an on-premise customer, you will be able to access all these new features once you update your installation. Feel free to reach out with your comments if you are a current Relyence customer, a soon-to-be customer, or a future customer! 
If you would like to check out these new features, or any of the capabilities of the Relyence software tool suite, you can sign up for a completely free trial. No hassle, no strings, just register here and put us to the test! Or call today to speak to us about your requirements or schedule a personal demo at your convenience.


