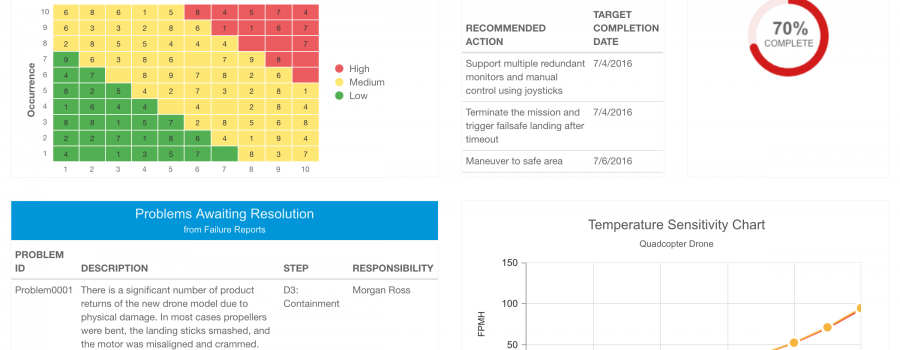
Relyence Dashboards are a highlight of the Relyence tool suite. Providing insight into all your reliability and quality metrics at a glance, Relyence Dashboards enable you to keep an eye on your system at a high level to monitor any and all aspects you deem critical. Importantly, Relyence Dashboards allow you to work proactively to issues before they are out of control. A key advantage of Relyence Dashboards is the ability to turn insight into action.
Relyence Dashboards are completely customizable, so you can create Dashboards to meet your unique needs. Additionally, there are features built into Relyence Dashboards that make them an impressive platform for helping to attain and maintain your reliability and quality objectives. This article will review 5 Top Tips for maximizing the use and effectiveness of your Relyence Dashboards.
Relyence Dashboard Tip #1: Customize it!
Relyence includes Example Dashboards for FMEA, FRACAS, Fault Tree, Reliability Prediction, RBD, and Maintainability Prediction accessible at any time from the Welcome dialog. Viewing these Dashboards may give you some ideas for how to design your own Dashboards.
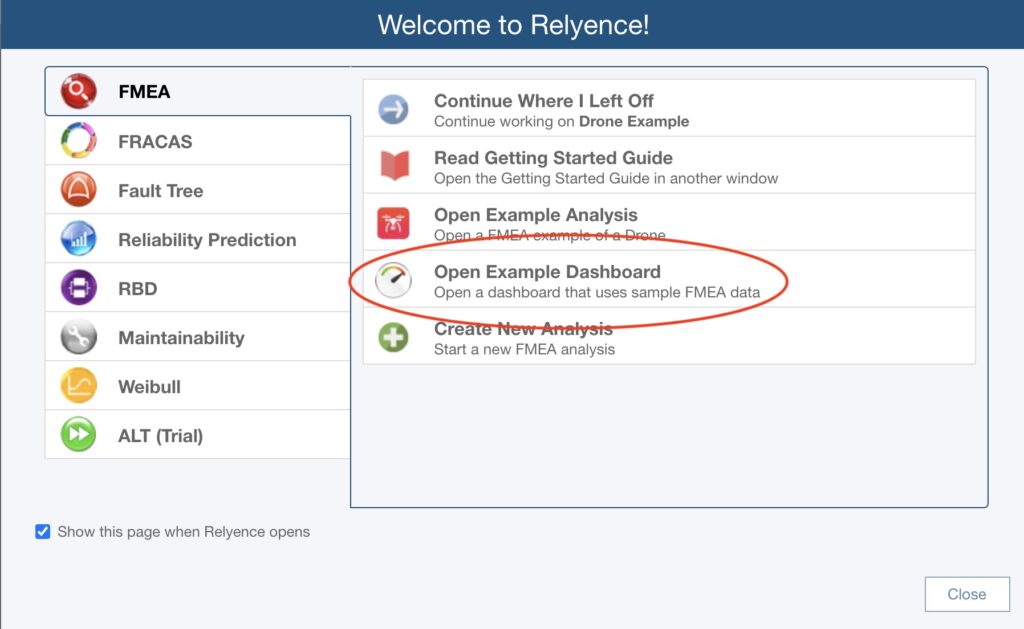
View any of the supplied Example Dashboards to get ideas for designing your own Dashboards.
A new Dashboard is created by selecting Create>New from the View All function in the Sidebar, selecting Create New… from the Dashboard selector in the Sidebar when a Dashboard is active, or by using the Manage Analyses function in the Account menu. The Designer brings you to the Dashboard canvas where you can add and remove widgets, move widgets around, and change widths and heights. The Relyence Dashboard Designer uses a drag-and-drop interface, so customization is quick and easy.
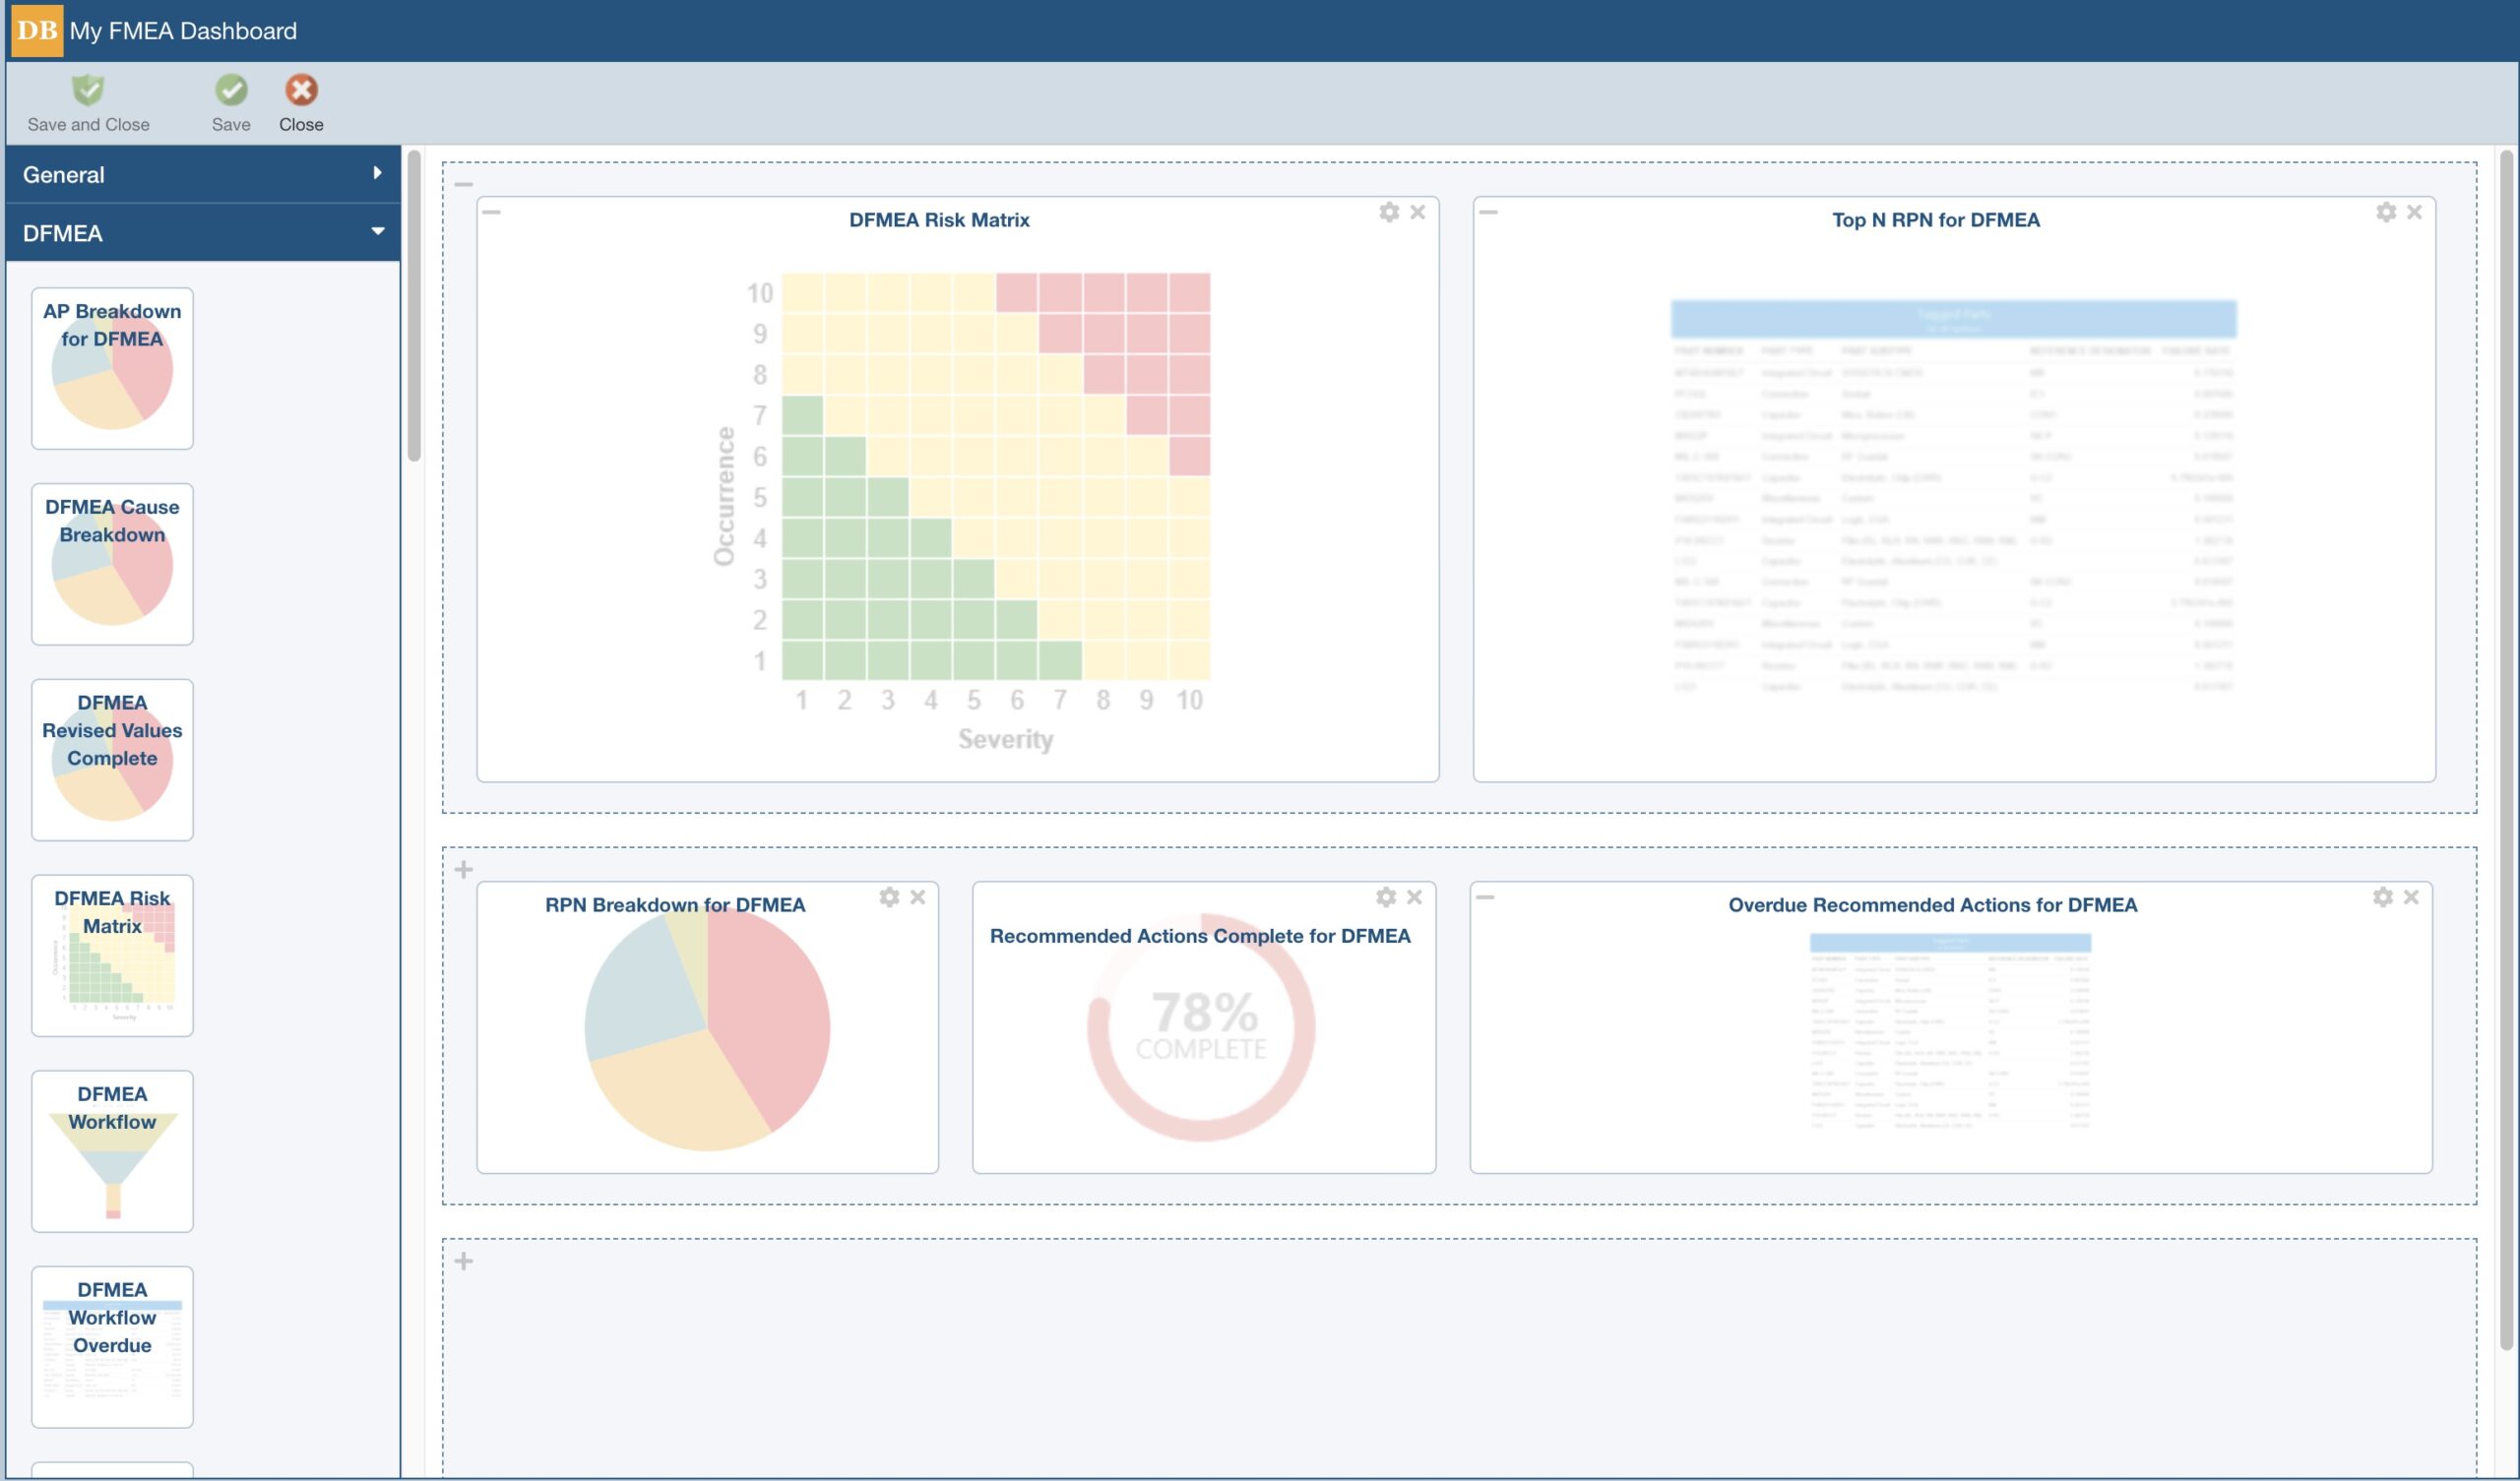
The Relyence Dashboard Designer provides an easy-to-use drag-and-drop interface.
The Example Dashboards can be used as a starting point for creating your own Dashboard. To do this, open and view any of the Example Dashboards. When creating your new Dashboard, select the Create based on an existing Dashboard checkbox and select the desired Example Dashboard. Once created, modify your new Dashboard by clearing the Use sample data checkbox on the widgets, and select your desired Analyses.
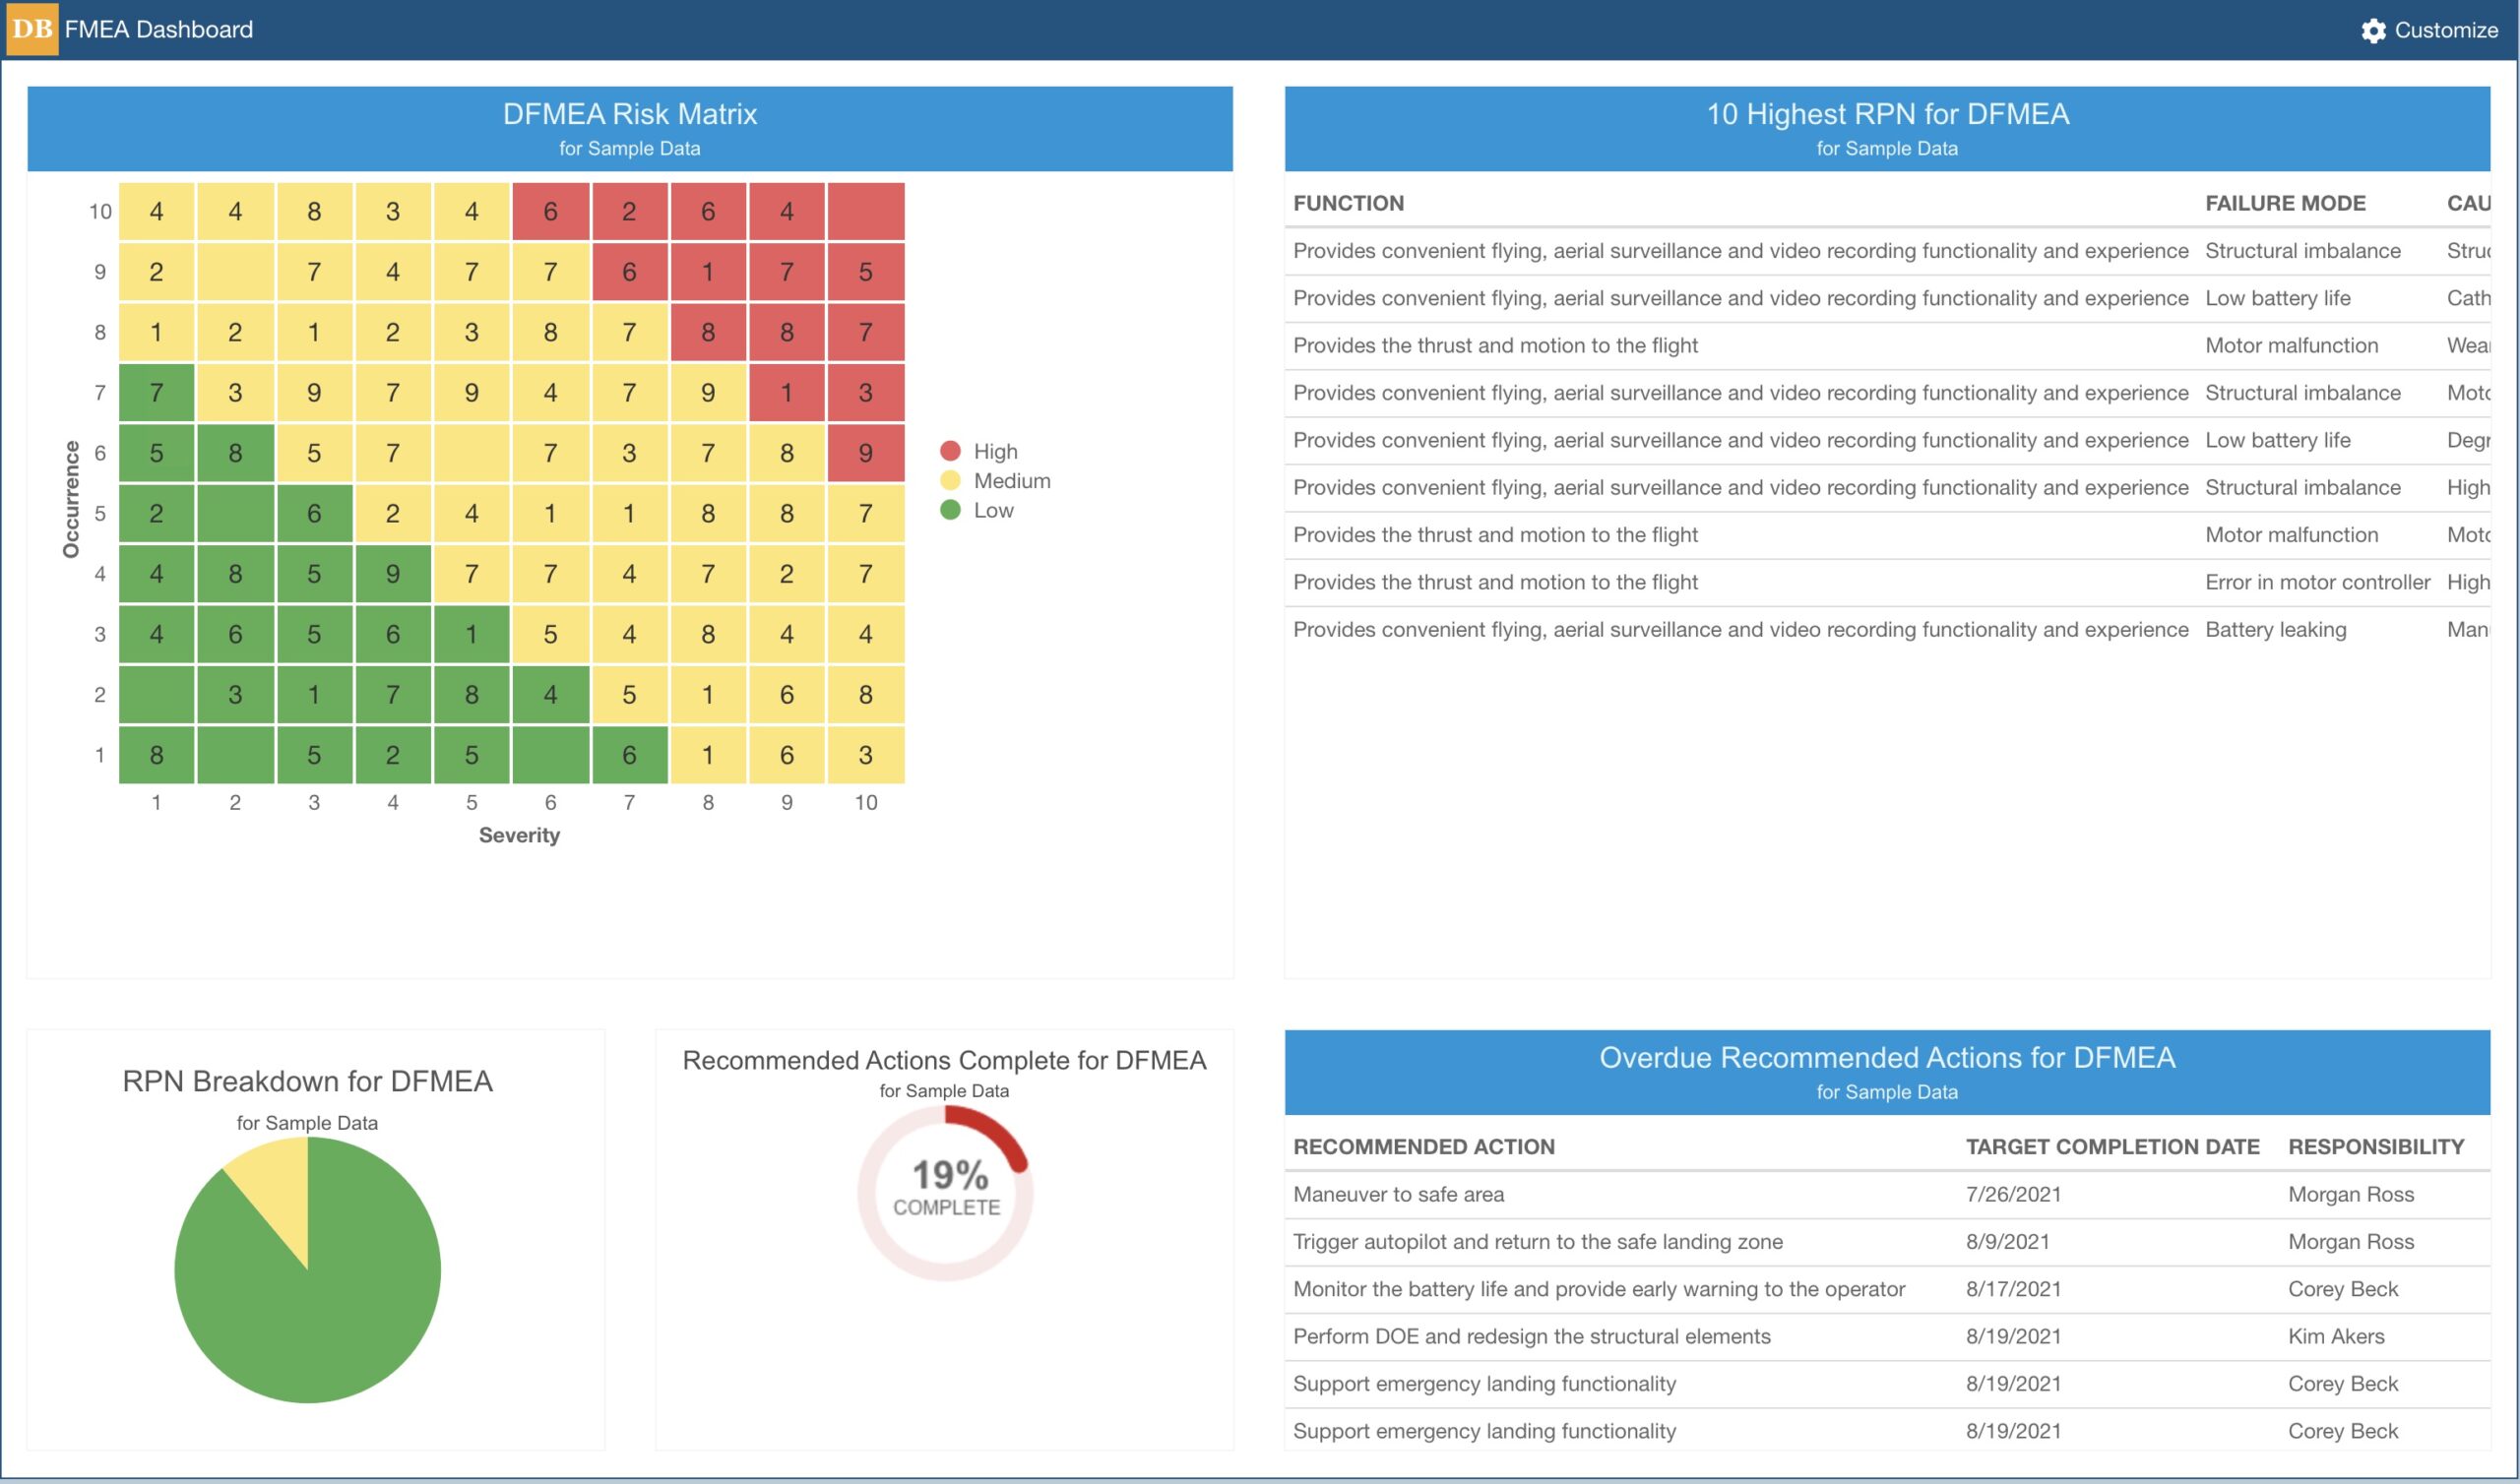
An example Relyence FMEA Dashboard.
Another advantage of Relyence Dashboards is the ability to create as many different Dashboards as you would like. For example, you may want a Dashboard suited for viewing your critical tasks and another that provides a high-level overview for management tasks.
Check out the customize features to create a Dashboard or several Dashboards to optimize your view into your reliability metrics.
Relyence Dashboard Tip #2: Drill down
Relyence Dashboards offer a high level overview of your reliability and quality metrics across your Relyence products. Relyence Dashboards aggregate the data from your Analyses and present that information in a concise, clear, visual format. In some cases, you may also want to take a more detailed look at the data underlying the charts and graphs on your Dashboards.
Relyence Dashboards include the useful drilldown feature that enables you to delve into the details. To use drilldown, simply click on the specific data you want to review in detail. For example, if you have the Top N RPN widget on your FMEA Dashboard configured to display the top 10 items, click on any of the 10 line items and you will automatically be taken to the specific item in the appropriate FMEA Worksheet. To return, simply click the Back to Dashboard link the Sidebar menu.
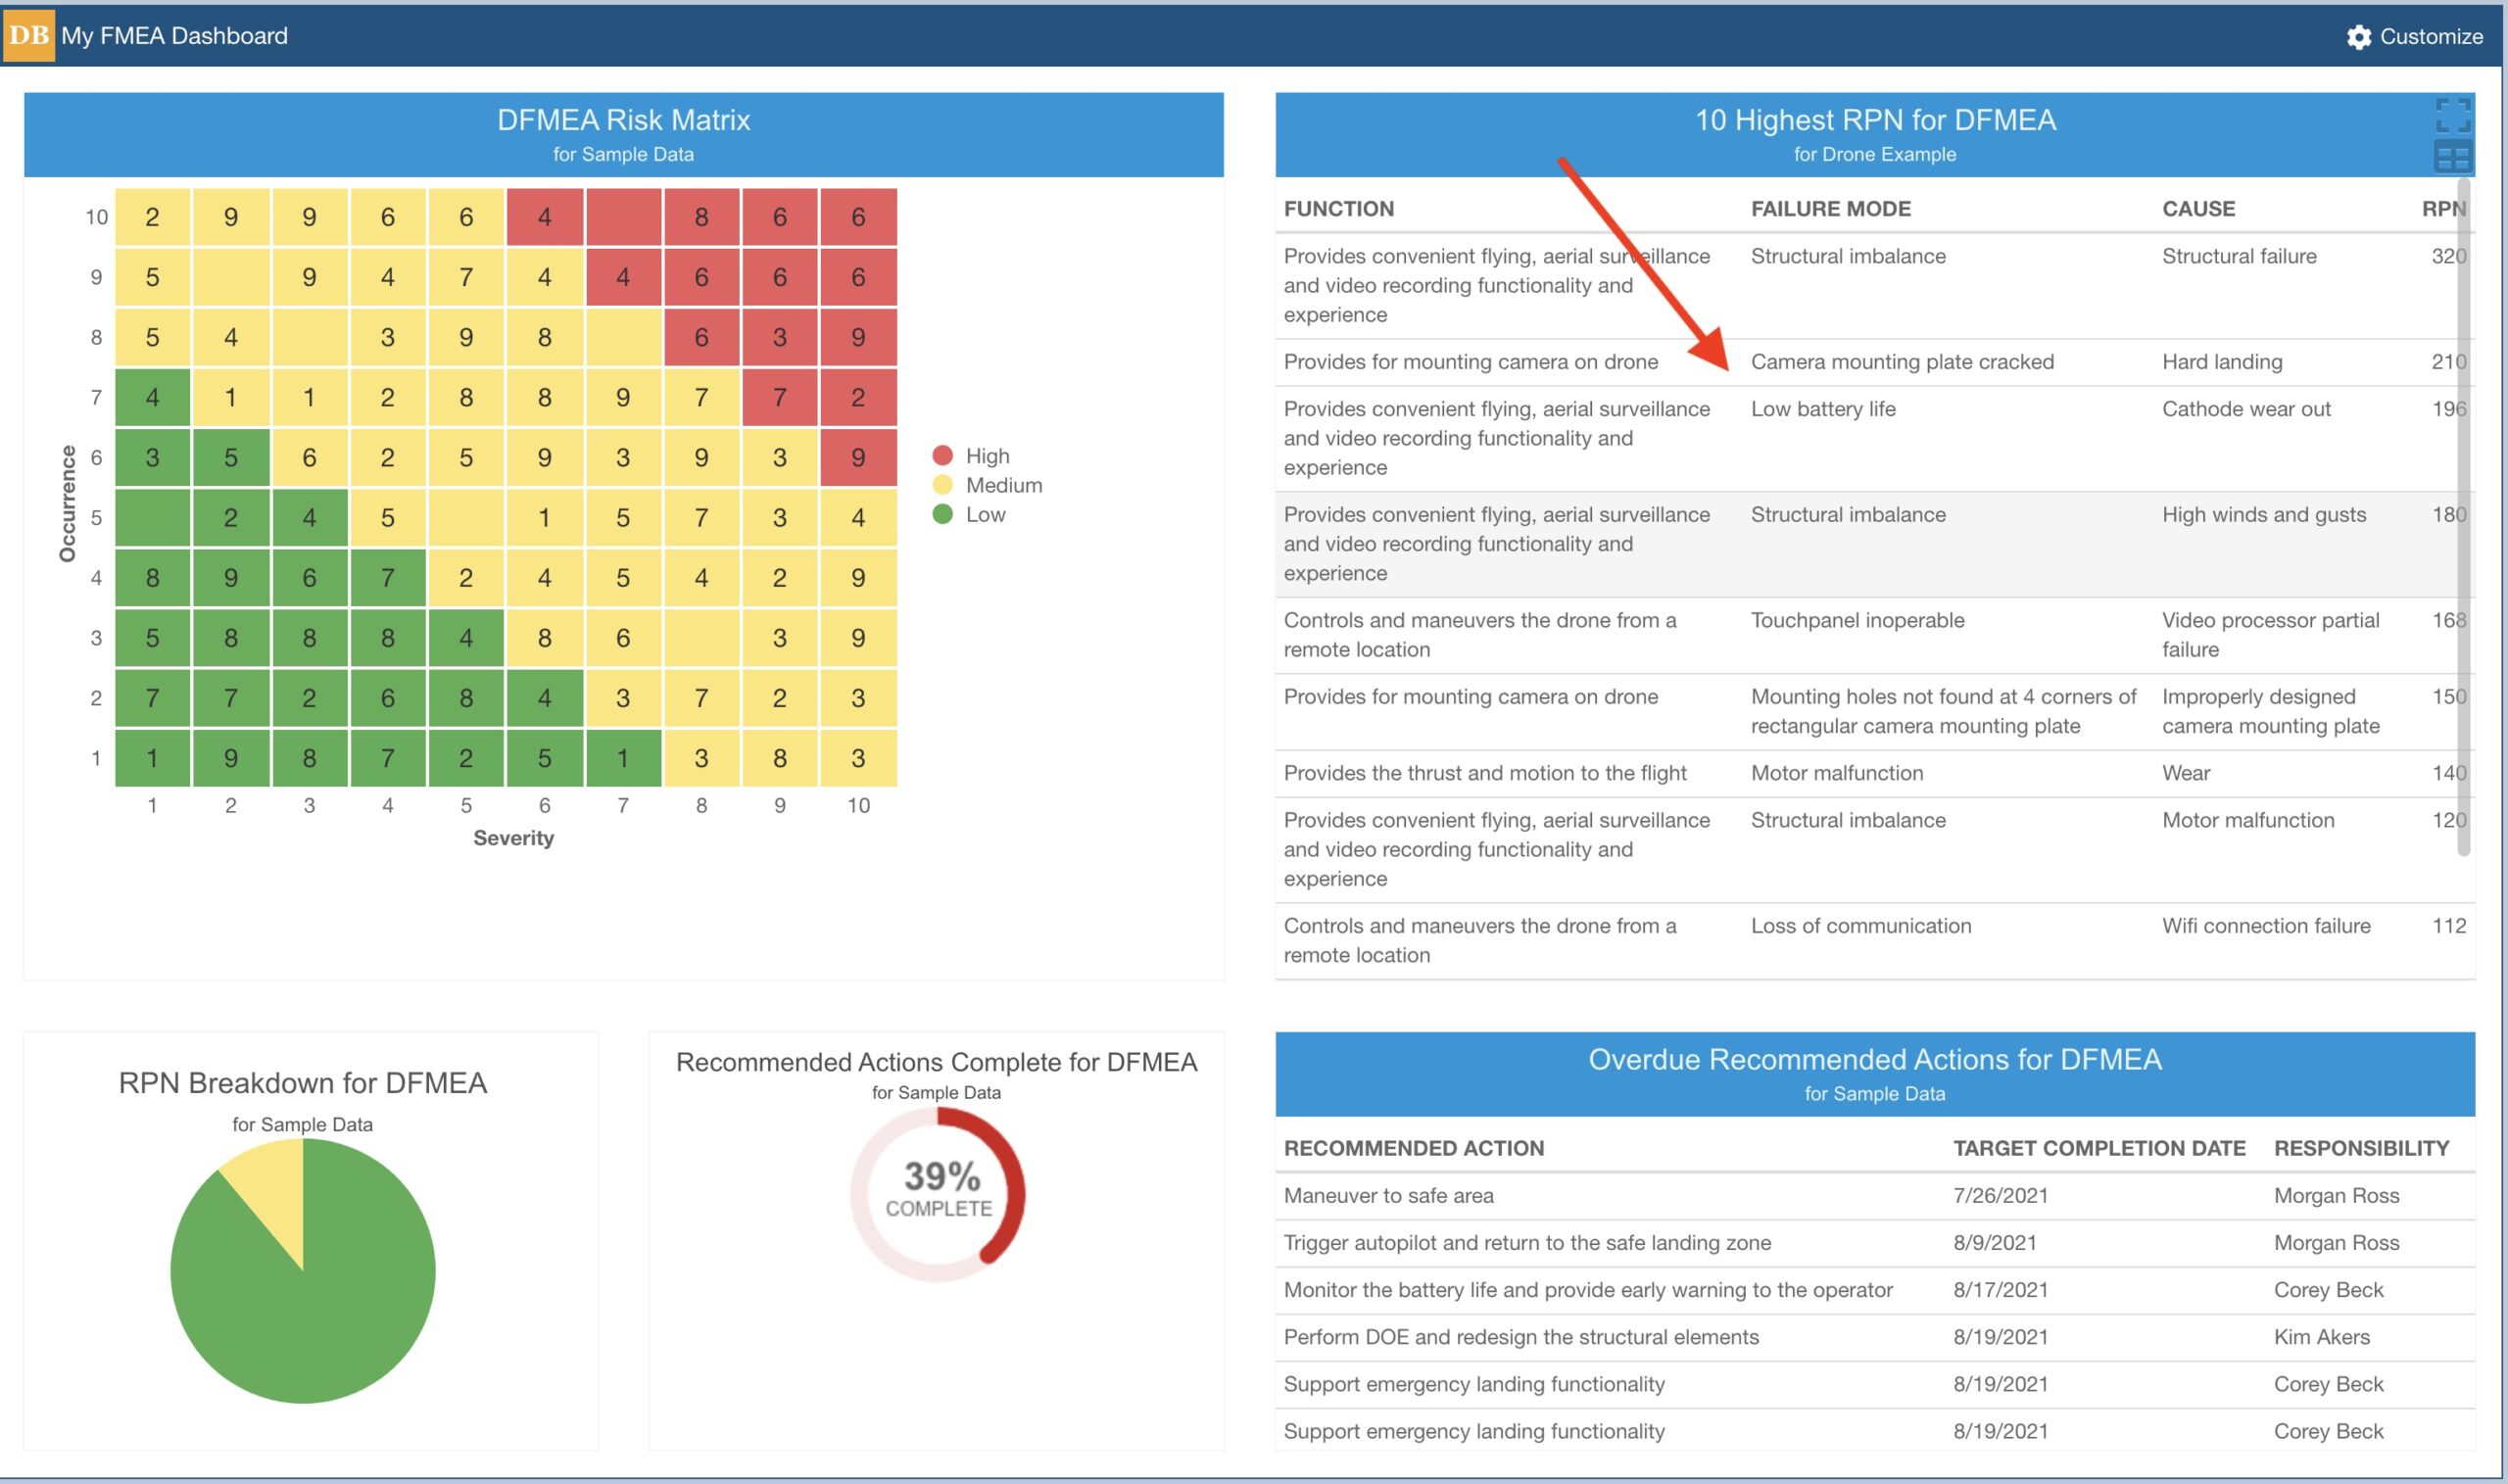
Use the drilldown feature to click on an item to view the underlying data.
In some cases, you may see a widget with double-drilldown. For example, the DFMEA Test Plan Status widget shows a pie chart of passed and failed test plans in your DVP&R (Design Verification Plan and Report) Worksheet. Clicking on a piece of the pie chart will bring up a list of the test plans contributing to the particular status. From this list, you can then click on a specific line item to be taken to the test plan in your DVP&R Worksheet.
Relyence Dashboards not only provide an informative high-level overview of your Analysis data, but also support drilldown for insight into the details.
Relyence Dashboard Tip #3: Capitalize on cross-product and cross-analysis capabilities
A significant advantage of Relyence Dashboards is that they gather Analysis data from a number of different sources and present it in an organized overview for at-a-glance insight. It’s the best way to keep the metrics that are most critical at the forefront and proactively address issues while they can be easily managed. It’s the essential mission of Relyence Dashboards: enabling you to turn insight into action.
A single Dashboard can combine metrics from Relyence FMEA, FRACAS, Fault Tree, Reliability Prediction, RBD, and Maintainability Prediction. You can have separate Dashboards if you prefer, but Relyence allows you to combine measures from multiple products for a single overview. Especially handy for managers or team leaders, the cross-product support of Relyence Dashboards provides a great way to keep track of activities across the whole team.
Additionally, Relyence Dashboards support cross-analysis capabilities. This means that you can combine metrics from any number of Analyses into one widget. For example, you may have several FMEA teams working on various projects, or on various parts of the same project, in different Relyence Analyses. In this case, the Top N RPN widget (where N is a customizable quantity) can pull data all your Analyses so that you see the items with the highest risks across all your projects in a single place. Similarly, using the Problems Pending Approval widget, you can include Problems across all your Analyses, or even a subset of your Analyses, so that you can review all FRACAS Problems that are awaiting team member approval in one place.
Take advantage of the cross-product and cross-analysis features to leverage the full power of Relyence Dashboards!
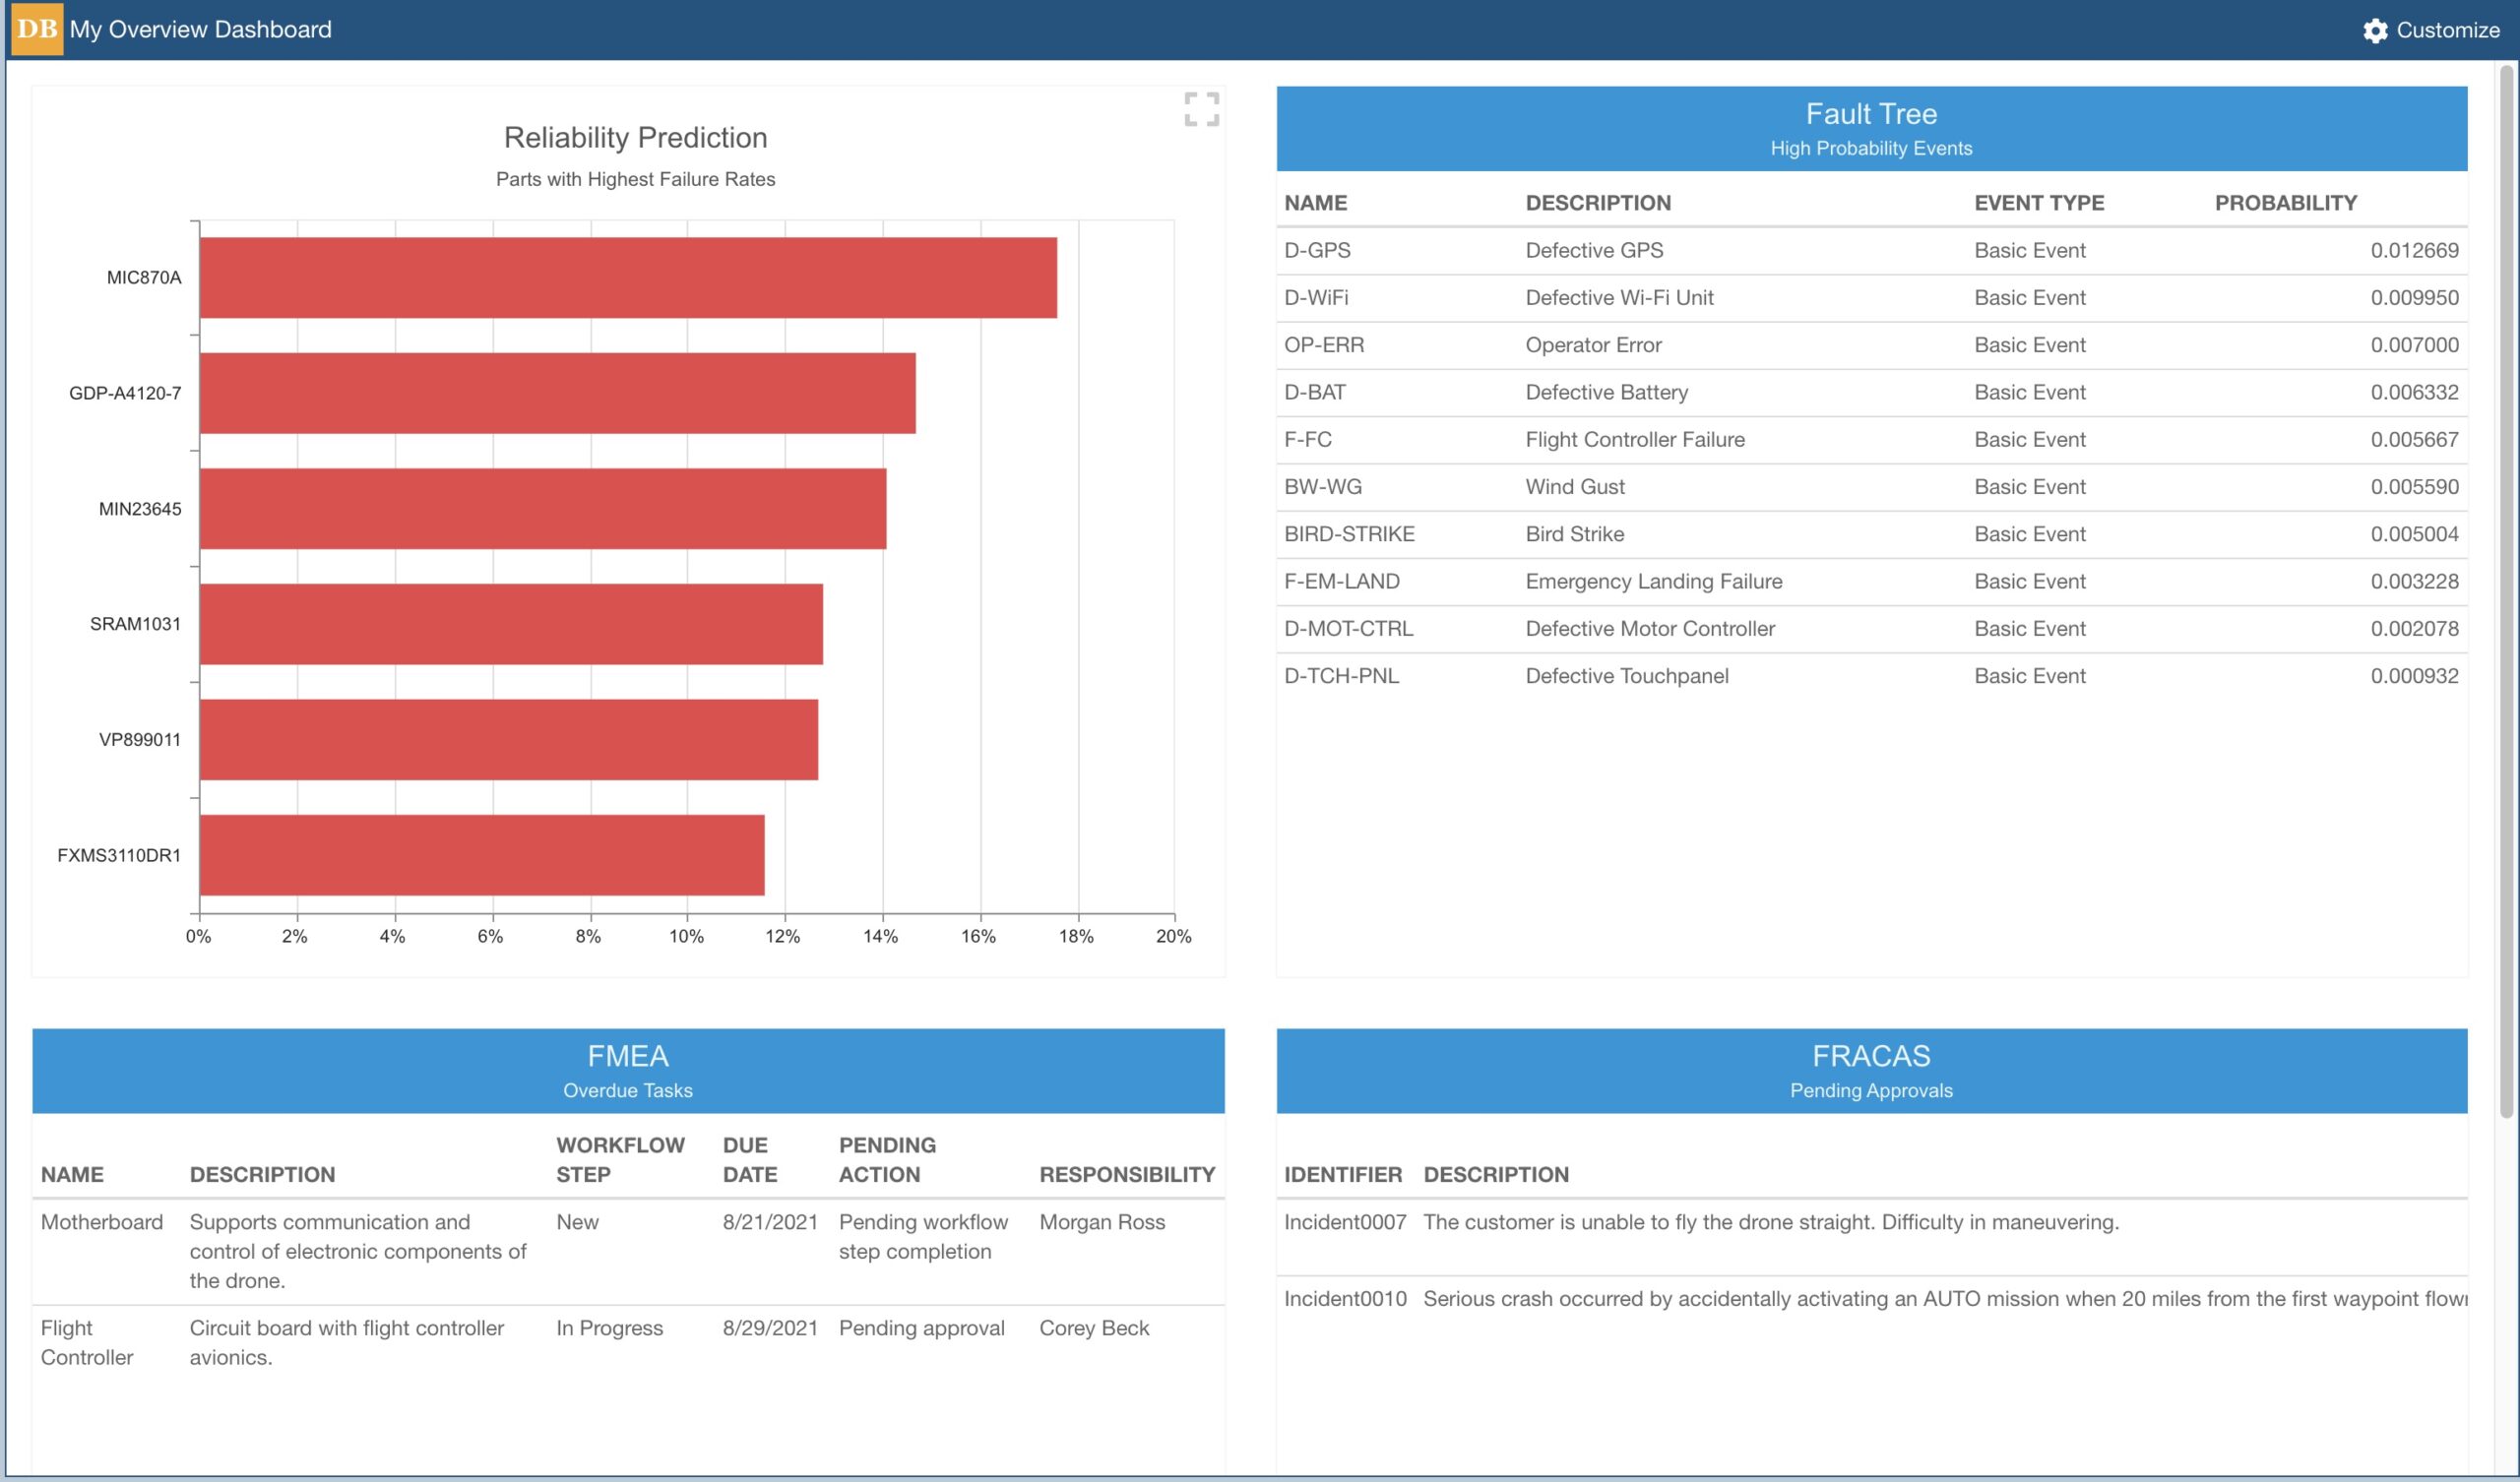
Relyence Dashboards allow you to combine data from multiple products for an informative overview.
Relyence Dashboard Tip #4: Zone in on your responsibilities
Another very useful feature of Relyence Dashboards is the ability to designate “my responsibilities” in various widgets. This enables you to view the items that are assigned to you at a glance. When in Customize mode, simply select the items “that I am responsible for” checkbox. All items in the widget that are assigned to you will automatically be displayed. For example, you can view all Problems in Relyence FRACAS that you are responsible for.
The “I am responsible” setting in Relyence Dashboards is smart enough to know who is actually signed in and viewing the Dashboard. So for example, you can create one Dashboard and select the “I am responsible” setting for your widgets, and any member of your team who signs in and accesses this Dashboard will see their assignments (not yours!).
This feature enables your entire team to more effectively keep track of tasks and more efficiently manage their time.
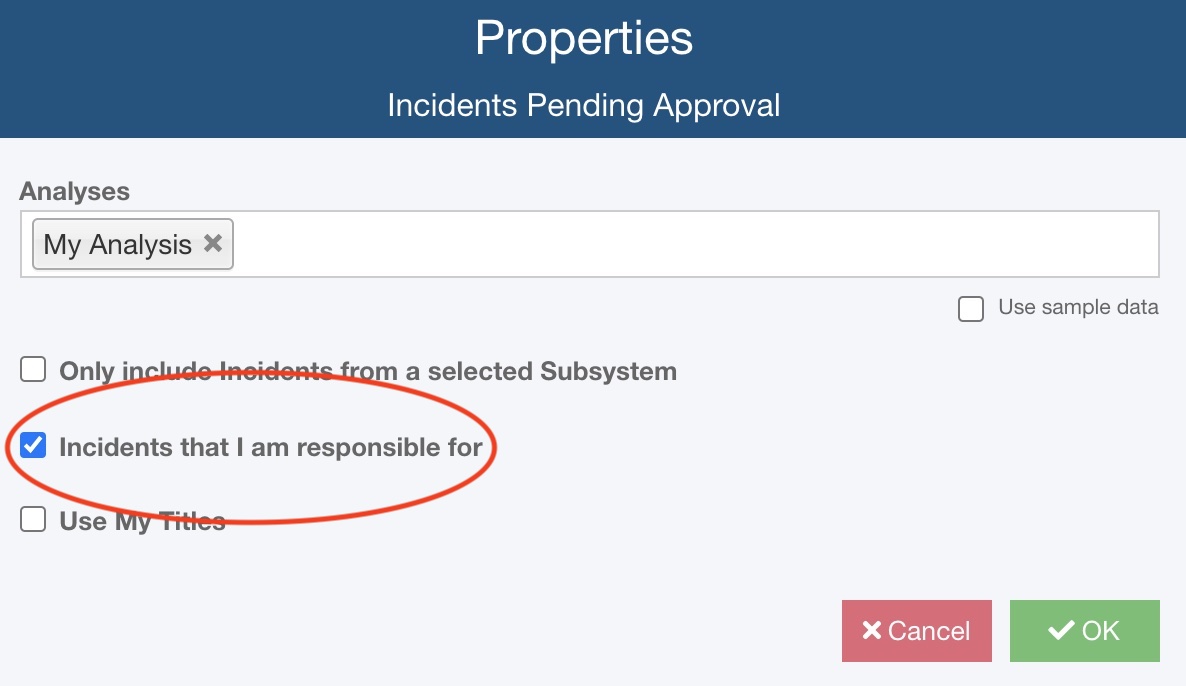
Use the “my responsibilities” option to zone in on your tasks.
Relyence Dashboard Tip #5: Keep track of due dates
Lastly, use Relyence Dashboards to keep track of all-important pending and overdue due dates. This critical information can sometimes be buried in a large Analysis with a lot of data, so using Dashboards to filter this vital information can be greatly beneficial to keeping your tasks on track.
For tasks that have due dates attached, there is a Relyence “overdue” widget available. Your goal, of course, is to keep that overdue list clear, but you’ll see an overdue item pop up on your Dashboard for quick highlighting!
Workflow and Approval tasks have various widgets enabling you to track due dates. In Relyence FRACAS, you can include widgets for Incidents Pending Approval, Problems Pending Approval, and Workflow Responsibility. Similar Workflow widgets are available to track your FMEA Workflow items as well. These widgets all include due date information to enable you to keep up-to-date on your assignments.
Combining Tips 4 and 5 can help you keep an eye on all your responsibilities in a single view.
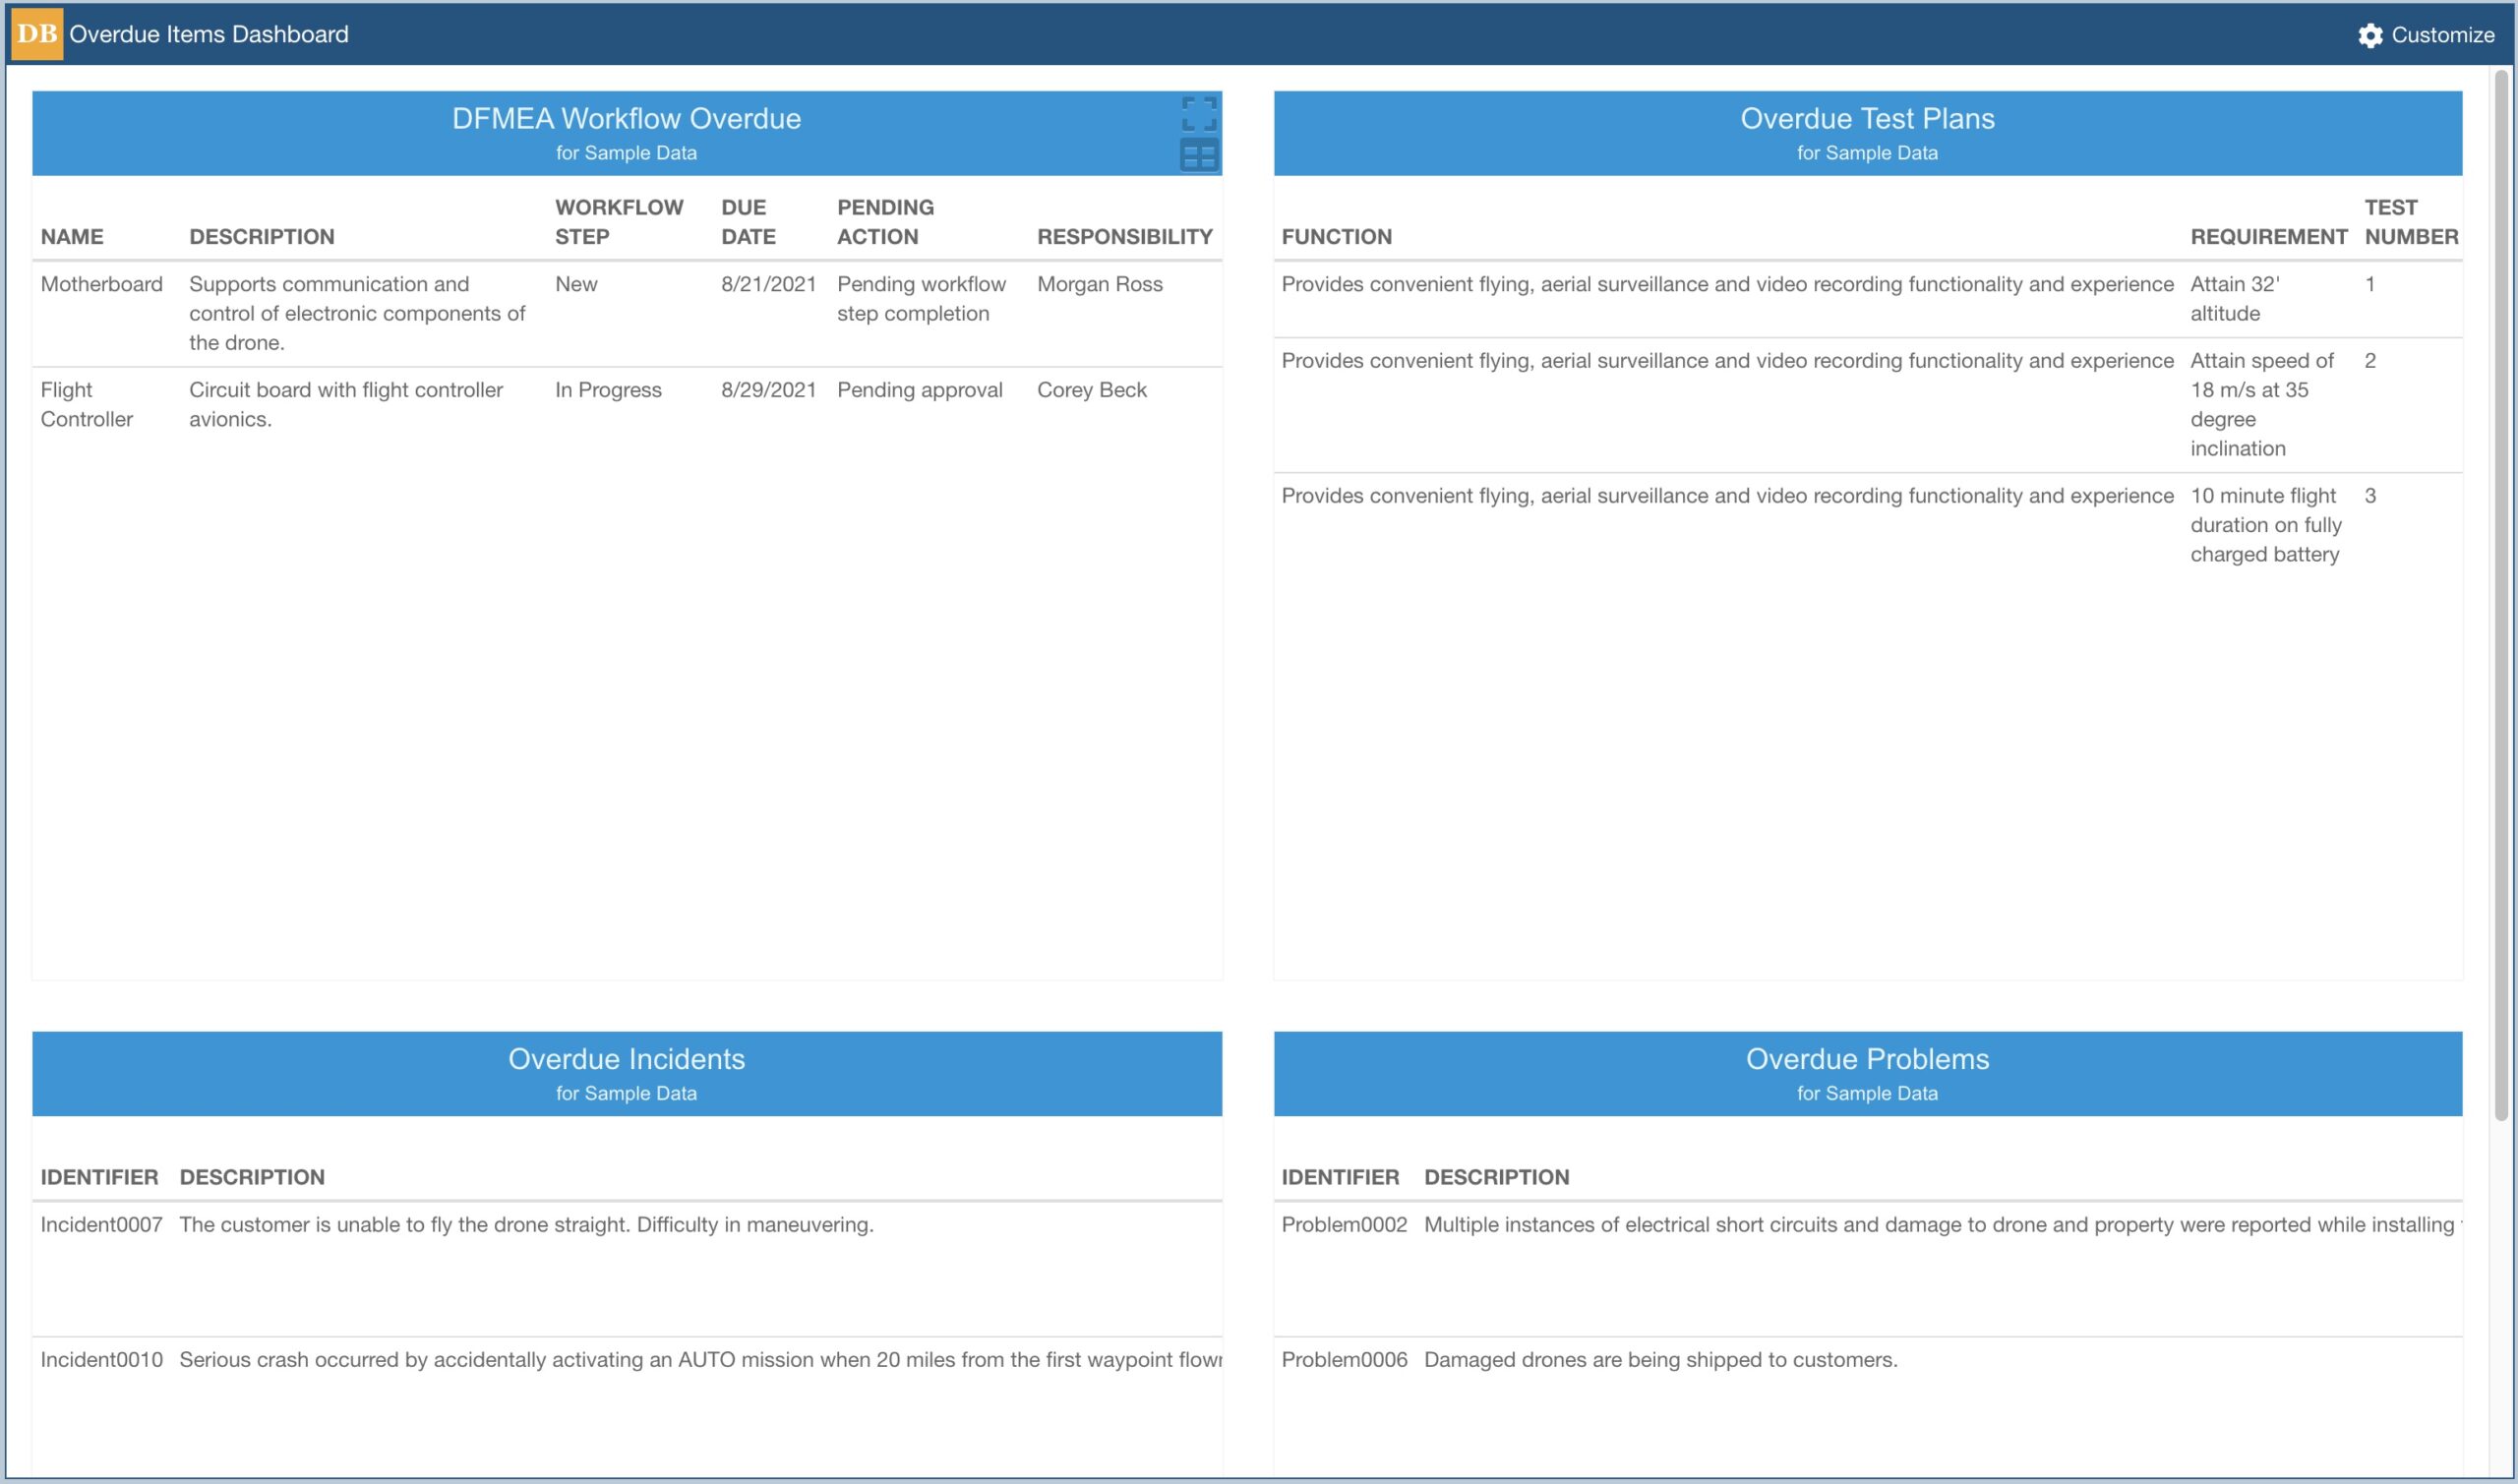
Use the Relyence Dashboard Overdue widgets to keep track of critical due dates.
Relyence Free Trial
At Relyence, our mission is to build not only the most capable tools, but also the most technologically advanced and well-crafted applications available. We rely on our expertise to build the tools reliability experts expect, and couple that with a design elegance and utility that makes our tool suite stand out. Relyence Dashboards showcase the Relyence difference: elegant, intuitive design backed up with reliability expertise that makes your job easier.
Relyence offers a free fully functional trial of our complete tool suite! Check out Relyence Dashboard capabilities along with our complete reliability and quality software tool suite.
Feel free to contact us, or call today at 724-832-1900 to speak to us directly about your requirements or schedule a free webinar.

