What is Life Data Analysis?
Life Data Analysis is a method of predicting how your product will operate through its lifetime by analyzing a sample set of failure data. The analysis is done by curve fitting the sample data set to a distribution, and using that distribution to determine trends. The term life data analysis is used because actual field-based data is analyzed to make forecasts about your product’s life.
To perform Life Data Analysis, you must have some sample data about the product you want to analyze. The sample data is typically information related to product failures or product performance. Once the data is collected, you then determine a mathematical distribution and its associated parameters that fits the data captured. Using this curve, you can then generate a graph of the data and its best-fit distribution. Using the graph and the distribution-specific parameters, you can analyze and predict future performance based on the distribution curve plotted.
Because one of the most applicable distributions used in Life Data Analysis is the Weibull distribution, Life Data Analysis is often called Weibull Analysis. Though Life Data Analysis is the broader term, Weibull Analysis is often used interchangeably with Life Data Analysis. The analysis process and techniques are the same for both. The term Weibull Analysis has arisen and is commonly used because the Weibull distribution is very useful to characterize a wide range of data trends that other statistical distributions cannot, including decreasing, constant, and increasing failure rates. In addition, the Weibull distribution can effectively be used to approximate other distributions.
What is Weibull Analysis?
Therefore, Weibull Analysis, like Life Data Analysis, is a statistical-based technique used to analyze various types of life data in order to predict failure trends. The key part of the statistical analysis is done by using mathematical distributions, one of which is the Weibull distribution. The Weibull distribution is especially noteworthy due to its versatility, its ability to model life data, and its ability to work with a small data set. It is one of the most widely used mathematical techniques for evaluating life data across a range of industries, and across the product lifecycle.
The core principle in Weibull Analysis is to gather a sample set of life data, or data about failures over a time frame, and then apply Weibull techniques in order to fit the data to a distribution. Using this information, you can then extrapolate to evaluate trends, assess the probability of a system operating over a time interval, analyze the mean life of a system, predict failure rate, or even determine a warranty period.
Why perform Weibull analysis?
Weibull Analysis offers a valuable way to gain insight into the lifetime performance of your product. By using sample data captured about failures and time, that information can be effectively analyzed using Weibull techniques to help answer critical concerns. For example, you can analyze the expected life of a product, how long warranty periods should last, and identify the root cause of a device failure such as a design flaw, improper maintenance, or a bad production run. Weibull Analysis helps to identify these types of problems and many more.
Here are just a few examples of the ways Weibull analysis can be applied:
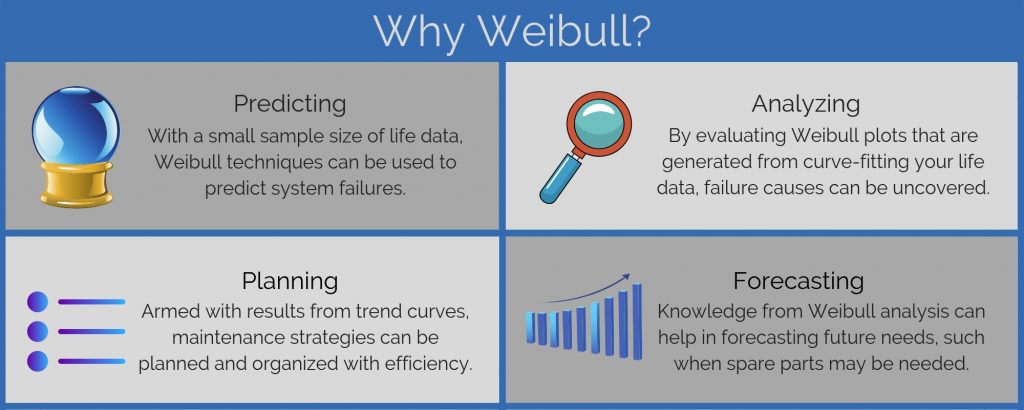
- Predicting: Using your life data, Weibull plots can be used to predict future failure characteristics.
- Analyzing: By evaluating the curves of your Weibull plot, you can uncover failure causes.
- Planning: Using the information gleaned from Weibull Analysis, you can effectively plan and organize maintenance strategies.
- Forecasting: From information gained with Weibull Analysis, you can forecast future needs, such as when spare parts will likely be needed.

Weibull is a powerful and versatile tool to add to your reliability analysis toolset.
What are the benefits of Weibull Analysis?
The primary advantage of Weibull Analysis is the ability to analyze failure trends and provide failure forecasts based on known sample data sets. The benefit of the Weibull distribution specifically is due to its versatility and ability to effectively be applied to small sample sets.
Another advantage of Weibull Analysis is that it offers a visual and easily understood graphical view of failure data. Weibull plots are very useful in discovering trends and allowing analysts to easily present and describe important information in a concise, clear format.
How do I perform Weibull analysis?
Weibull analysis is performed by first defining a data set, or a set of data points that represent your life data. This data can be in many forms, from a simple list of failure times, to information that includes quantities, failures, operating intervals, and more. The data is then evaluated to determine a best fit distribution, or the curve which best fits your data based on a statistical analysis. This may be the Weibull distribution, or a different distribution commonly supported in Weibull Analysis such as the Normal, Lognormal, or Exponential distributions. You can then perform additional analysis, such as looking at confidence bounds based on selected confidence levels.
Almost all Weibull Analyses are done using a specific software tool designed for the process. Look for a tool that provides an easy-to-use interface combined with plotting capability that is easy to read and interpret. A web-based package allows you access to your Weibull Analyses across remote teams or distributed locations.
Weibull Plots
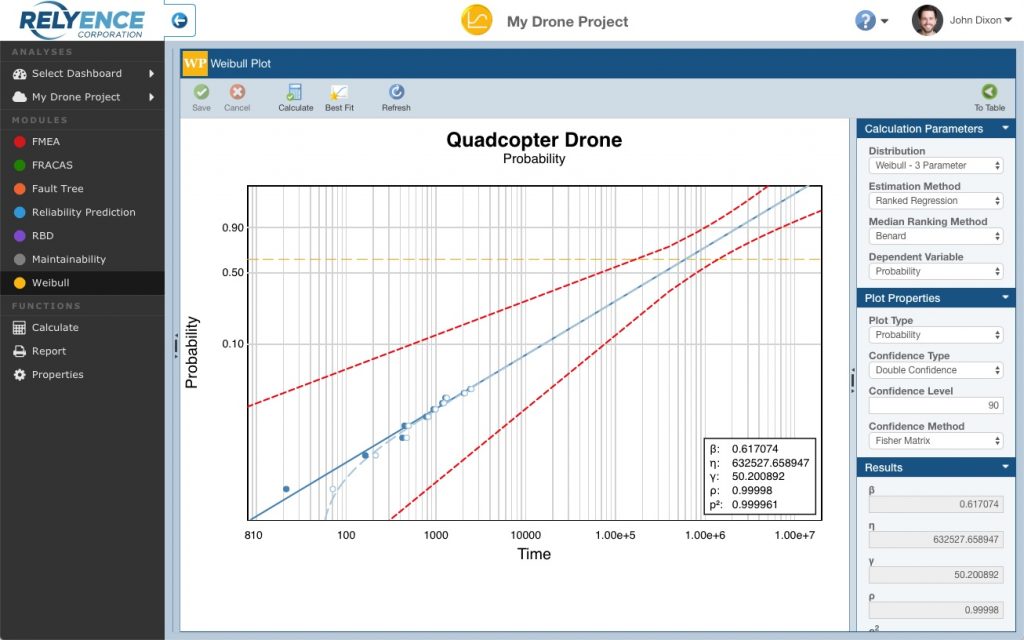
A central component of Weibull Analyses are Weibull plots, or the resulting graphical representation of your failure data along with the distribution curve. Weibull plots are a vital element of Weibull tools, allowing you to visually see your life data along with the distribution line for full understanding of trends and future performance.
Some common plot types that are used in Weibull Analysis include Probability, Reliability vs Time, Unreliability vs Time, Failure Rate vs Time, and PDF (Probability Density Function) plots.

Weibull plots are very useful to explain important information in a concise, clear format.
Best Fit Distribution Analysis
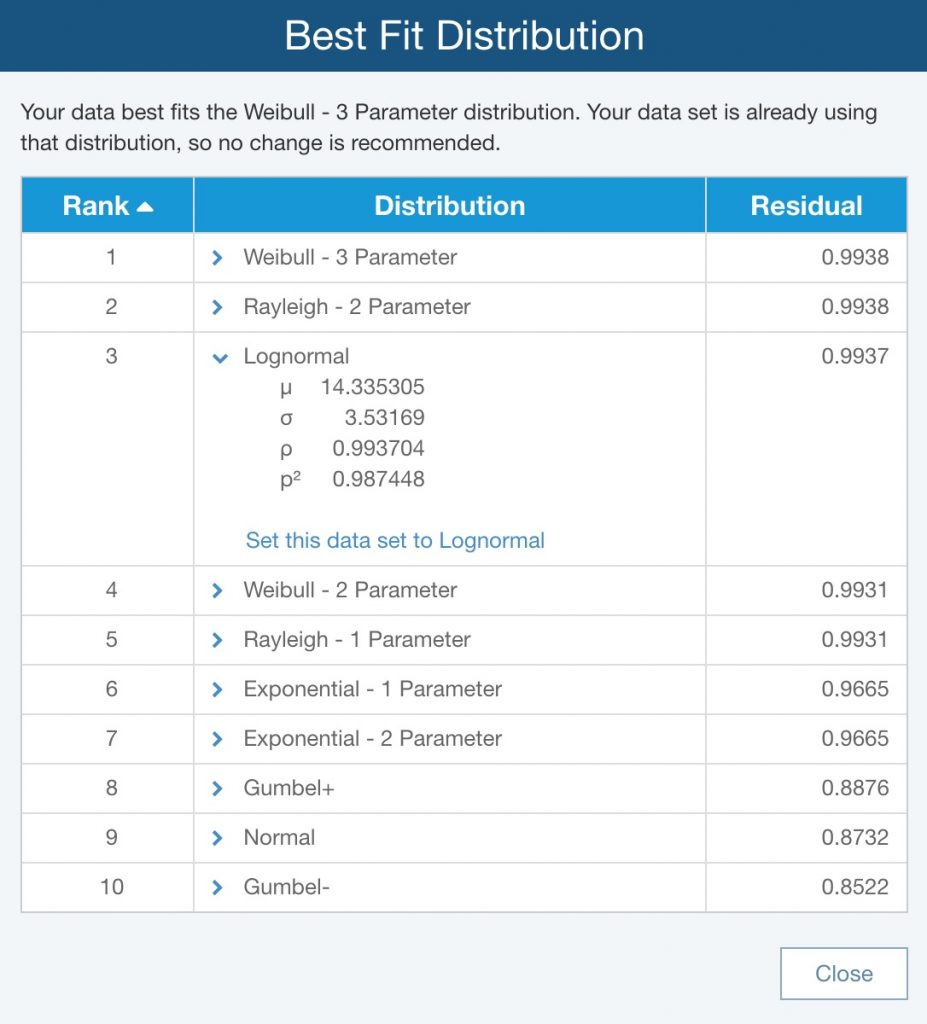
In some cases, you may want to statistically determine which distribution best fits your data instead of selecting a particular distribution. In this case, a best fitanalysis can be done. Best fit analysis considers each distribution and then using statistical techniques determines which one most closely aligns with the sample data. The best fit is also a useful tool when you are unsure of which distribution to use.
Often, if a Weibull Analysis software tool is used to perform life data analysis, a best fit analysis feature is available. The best fit tool will consider each distribution and provide a numerical measure of how closely it fits your data. In this way, you can see which distributions are best to use for your analysis. In the case where more than one distribution may be a good fit, you can simply select your preferred distribution.

Best Fit Analysis can help determine which distribution best fits your data.
Using Weibull as Part of your Reliability Analysis Toolset
Weibull Analysis can be done as a stand-alone failure analysis technique, but it is often integrated with other analysis tools to take full advantage of its capabilities.
Weibull Analysis and RBD
For example, Weibull Analysis can be used in conjunction with system modeling tools, such as Reliability Block Diagram (RBD) analysis. RBD analysis is a methodology for assessing the failure or success paths through a complex system. RBDs are used to compute a wide array of critical reliability and availability metrics. Oftentimes, RBDs are used to assess the impact of redundancy, or the use of backup components or paths that can keep a system operational when the primary path fails. RBDs are created in a visual format, using blocks to represent components in your system and then defining the failure characteristics of each of those blocks in order to perform the analysis. In this case, if you have sample data for a particular component of your RBD, you can use that information along with Weibull Analysis to accurately define its failure profile for your RBD.
Weibull Analysis and Reliability Prediction
Weibull Analysis and Reliability Prediction analysis share a key feature: they are both predictive, or forecasting, tools in reliability engineering. While Weibull Analysis uses sample life data, Reliability Predictions use information about the electromechanical components in your system to provide estimated failure rate assessments. Reliability Predictions are based on standards which include equations that model the devices in your system. The equations were developed based on a vast amount of historical failure data collected on a wide variety of components in the field.
A main difference between Weibull Analysis and Reliability Prediction analysis is that Weibull Analysis requires a sample set of life data from operational products. Reliability Predictions can be done at any time of the product lifecycle, including, and importantly, at the design phase before products have been manufactured.
However, in some cases, analysts may be able to use the two analyses together to provide an accurate assessment for failure prediction. For example, perhaps you have designed a new system that includes some parts that are presently in an older design, or in a similar product in production. In this case, you can augment your Reliability Prediction analysis by modeling those fielded components using Weibull techniques based on your collected life data.
Weibull Analysis and FRACAS
FRACAS (Failure Reporting, Analysis, and Corrective Action System) and CAPA (Corrective and Preventive Action) are closed-loop process management tools for managing issues that occur with any type of product, process, or system. The process begins with a problem report, progresses through the corrective action defined to resolve the issue, and finally concludes with implementing the corrective action and verifying problem resolution. The information in your FRACAS and CAPA can therefore provide a wealth of product life data.
You can look to your FRACAS or CAPA system to provide a sample set of life data to use as a basis for Weibull Analysis. This extends the advantages of your FRACAS from an effective process management tool to a trend analysis tool. By leveraging the data already captured in your FRACAS, you can gain insight into future product performance, and use that information to proactively resolve problems before they become larger issues.
Relyence Weibull
Relyence Weibull is a powerful tool for performing Weibull Analyses that seamlessly integrates with other modules in the Relyence Studio platform for optimal system reliability analysis. Offered on the web with a browser-based interface, Relyence Weibull offers an array of features for streamlined, efficient life data analyses.
Contact us today so we can talk about your Weibull needs and how Relyence Weibull can help, or sign up today for our free trial to see Relyence Weibull in action.


