Jump to: Types | Equations | Examples
What are Fault Tree importance measures?
Fault Tree importance measures provide a quantitative approach to help in pinpointing areas for risk reduction in Fault Tree Analysis (FTA). Importance measures help to target those events which are likely to have the most effect on improving your overall system performance measures, such as availability and reliability.
First: What is Fault Tree Analysis?
Before delving into the details about importance measures, it is good to understand the basics of fault tree analysis. The following articles may be a good start for learning about fault tree analysis:
Essentially, Fault Tree Analysis is a graphical and intuitive method to analyze reliability, safety, and risk. This top-down deductive approach is used to determine the probability that an undesired outcome, defined by the top event, will occur. Undesired outcomes generally considered are the loss of a system, product, or a process failure. FTA is flexible and can be used for investigation of a wide range of events, such as a failure at a nuclear power plant, a personal drone crash, dispensing improper medications, explosions, as well as less catastrophic events. Fault Tree Analysis evaluates the probability of the undesirable outcome and then helps to identify opportunities to reduce the likelihood of occurrence. The objective of FTA is to ensure that the probability of the undesired event is at an acceptable level.
Fault Tree Analysis begins with the construction of a fault tree diagram. The diagram is a graphical model of events that can alone or in combination lead to the top event occurrence. Logic gates are used in the construction of the fault tree diagram. Construction always begins at the top level where the top unwanted event to be analyzed is defined. Events which could cause the top event to occur are defined and connected using logic gates.
Boolean logic is used to evaluate the fault tree diagram. Using this methodology, fault tree analysis provides critical metrics, such as the probability of the undesired top event occurring, as well as various other quantitative outputs.
Once the analysis in complete, it is then time to assess the results. Does the overall likelihood of your system’s catastrophic event meet your goals or requirements? If not, you must consider how to lower the risk profile. One way to do this is to focus efforts on lowering the probability of the contributing events. However, you may have little or minimal control over some events. Additionally, some events have more impact on your overall system performance than others. So how do you determine which events are the best candidates for improvement efforts? That is where fault tree importance measures step in.
Second: What are importance measures?
Fault tree importance measures, or reliability importance measures, attempt to identify which events to target to yield the most improvement in system performance. Based on the individual event probabilities and the overall top unwanted event probability, importance measures allow you to rank the events in order of which, with a reduced likelihood of occurrence, can best improve the overall system.
What are the Types of Fault Tree Importance Measures?
There are various methods used to calculate importance measures the are widely used, including:
- Marginal, or Birnbaum
- Criticality
- Diagnostic
- Risk Achievement Worth
- Risk Reduction Worth
How are Fault Tree Importance Measures Computed?
Each type of importance measure has its own way of computing importance. They each vary, and one method should not necessarily be considered better than another. The results for each measure depend on the particular fault tree event probabilities and the fault tree diagram construction. For this reason, it is helpful to look across results from the various importance measures to get a more comprehensive view of areas to target for improvement.
Marginal (Birnbaum)
The Marginal measure, also called Birnbaum, measures the increase in the probability (P) of the top event (E) due to an event (A). It is reported as the difference in the probability of E given that A did occur (probability of event A is set to 1) and the probability of E given that A did not occur (probability of event A is set to 0).
Marginal Importance Measure = P(E|P(A)=1) – P(E|P(A)=0)
It allows you to see the increase in the probability of E given the occurrence of A.
One weakness of the Marginal importance measure is that it does not directly consider the probability of event A occurring, which means you can be led to assign high importance values to events that are very unlikely to occur and thus may be difficult to improve.
Criticality
The Criticality measure is a modification of the Marginal importance measure that also takes into account the probability of event A. It takes the Marginal importance measure and multiplies it by the probability of A divided by the probability of E.
Criticality Importance Measure = Marginal Importance Measure * P(A) / P(E)
Because it also takes into account the end event occurrence, it is used to highlight events that lead to the top event occurring and are also more likely to occur and thus can reasonably be improved.
Diagnostic
The Diagnostic measure is the fraction of the top event (E) probability (P) that includes the event (A) occurring; or it is the probability that if the top gate occurred, the event occurred.
Diagnostic Importance Measure = P(A) * P(E|P(A)=1) / P(E)
Risk Achievement Worth
The Risk Achievement Worth (RAW), or Top Increase Sensitivity, measure is the increase in probability of top event E when event A is given to occur. It reports the ratio of the probability of E when event A is given to occur (probability of event A is set to 1) and the probability of E.
RAW Importance Measure = P(E|P(A)=1) / P(E)
Events with the largest RAW measure values have the largest impact on the probability of the top gate, P(E), therefore it shows where prevention areas should be focused to prevent top event failures.
Risk Reduction Worth
The Risk Reduction Worth (RRW), or Top Decrease Sensitivity, measure is the reduction in probability of top event E when event A is given to not occur. It reports the ratio of the probability of E and the probability of E when event A is given to not occur (probability of event A is set to 0).
RRW Importance Measure = P(E) / P(E|P(A)=0)
The RRW measure determines the maximum reduction in the top event probability if the event is improved.
Fault Tree Importance Measures Examples
Example 1
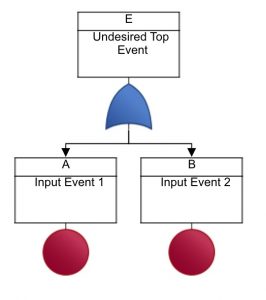
Let’s look at a very simple example fault tree and evaluate the fault tree importance measures. Undesired top event, E, can occur when event A occurs, when event B occurs, or when both events A and B occur.

A simple example fault tree diagram.
Assume P(A) = 0.1 and P(B) = 0.2.
Based on those inputs and Boolean logic for the OR gate, P(E) = 0.1 + 0.2 – (0.1 * 0.2) = 0.28.
The importance measure analysis for this example yields the following results:
Marginal
P(E|P(A)=1) – P(E|P(A)=0) = 1 – 0.2 = 0.8
P(E|P(B)=1) – P(E|P(B)=0) = 1 – 0.1 = 0.9
Criticality
Marginal Importance Measure * P(A) / P(E) = 0.8 * 0.1/0.28 = 0.285714
Marginal Importance Measure * P(B) / P(E) = 0.9 * 0.2/0.28 = 0.642857
Diagnostic
P(A) * P(E|P(A)=1) / P(E) = 0.1 * 1/0.28 = 0.357143
P(B) * P(E|P(B)=1) / P(E) = 0.2 * 1/0.28 = 0.714286
RAW
P(E|P(A)=1) / P(E) = 1/0.28 = 3.571429
P(E|P(B)=1) / P(E) = 1/0.28 = 3.571429
RRW
P(E) / P(E|P(A)=0) = 0.28/0.2 = 1.4
P(E) / P(E|P(B)=0) = 0.28/0.1 = 2.8
Example 1 Fault Tree Importance Measures Results Summary
A summary table of the example results:

Table of Fault Tree importance measures results.
With such a simple fault tree and just two input events with different probabilities of occurrence, it is rather simple to surmise that we should work to improve event B and lessen its probability of failure in order to make the most effective overall system improvement as it has the higher likelihood of occurrence. In this case, all but the RAW fault tree importance measure verifies this. But, since all of the various fault tree importance measures don’t rank the events in the same way, how do we decide where to focus efforts on improvement? In such a case, you might consider taking an average of the various importance measure ranking or using the ranking from the fault tree importance measure deemed most useful for your application.
Example 2
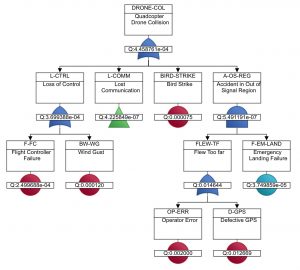
Let’s take a look at a slightly more complex fault tree diagram: that of an analysis for a drone. Here is the fault tree diagram:

An example fault tree diagram to analyze a drone.
For this case, computing the importance measures is done by employing fault tree analysis software. It is easy to see how the complexity of evaluating importance measures grows along with the complexity of the fault tree diagram. Additionally, you can see why importance measures analysis is critical in order to determine which areas of your system to focus on for improvement.
Example 2 Fault Tree Importance Measures Results Summary
The importance measures results for the drone example are shown in the table below. Note that there are additional events shown in our results table due to the fact that a transfer gate is used in this example. Transfer gates enable you to link fault tree diagrams together and are useful for organization and reusability. The triangular L-COMM (Lost Communication) gate represents another fault tree diagram with additional events that are included in the importance measures analysis.

Importance measures results for fault tree drone example.
In this example, the results indicate that targeting the F-FC event (Flight Controller Failure) for improvement would have the most impact on improving overall system performance metrics.
Conclusion
Fault tree importance measures, or reliability importance measures, help you to focus efforts on those events that will yield the most improvement in system performance. Afterall, the objective of fault tree analysis is to make system improvements to maintain an acceptable risk level.
With a simple fault tree as in the above Example 1, determining the fault tree importance measures is quite straightforward. However, with larger, more complex fault trees, determining the impact of any individual event on the overall system can be challenging to handle with manual calculations. Relyence Fault Tree can help you to easily build your detailed fault tree and perform calculations that provide results including fault tree importance measures.
Learn more about Relyence Fault Tree, our best-in-class fault tree tool for risk and safety assessment or sign up today for your own no-hassle free trial. Feel free to contact us to discuss your needs or schedule a personal demo today.


