When looking to model and calculate the reliability performance for a product or system, two of the most commonly used tools are Fault Tree Analysis (FTA) and Reliability Block Diagram (RBD) analysis. At first glance, both seem to provide similar system and component modeling capabilities, so the question of which to choose comes up frequently. In this article, we will detail the possible answers to this question by first covering the basics of FTA and RBD, explaining their similarities and differences, and conclude by offering practical advice on why you may prefer one or the other depending on the system being analyzed.
What is Fault Tree Analysis?
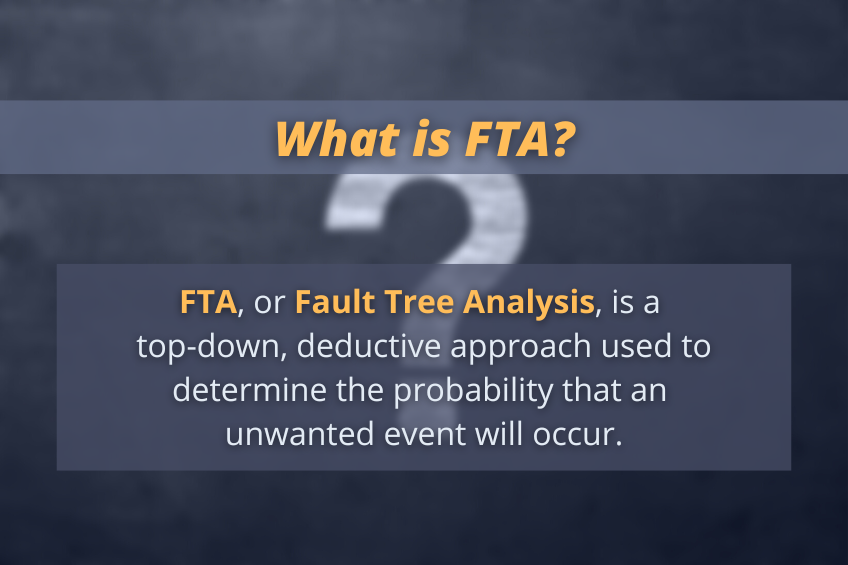
Fault Tree Analysis is a methodology used to determine the probability that an unwanted event will occur. The unwanted event is often the failure of a product, system, or process. This can mean anything from a household appliance malfunction, a software crash, or more dangerous events like collisions or components catching fire. Because of its detailed focus on a single undesired event and the causes that lead there, FTA is commonly used to investigate top-level events that are safety-related or have catastrophic consequences.
FTA uses a top-down, deductive approach to failure analysis that begins by first defining the main undesired event you are investigating. Then, construction of the fault tree diagram continues by delineating the potential contributing factors to that undesired event and their connection to the top-level event. Various logic gates, which represent how the underlying events interact to create a certain outcome, are then used to connect the basic events to the top-level undesired event.
Oftentimes, the main desired output of FTA is the probability of occurrence of the top-level event. FTA can also be used to assess additional reliability and quality insights such as Cut Sets and Importance Measures which help analysts determine the key events to target that will yield the most improvement in system performance. To learn more about FTA metrics, diagram construction, and see an example use case, be sure to check to download our informative white paper.
What is Reliability Block Diagram analysis?
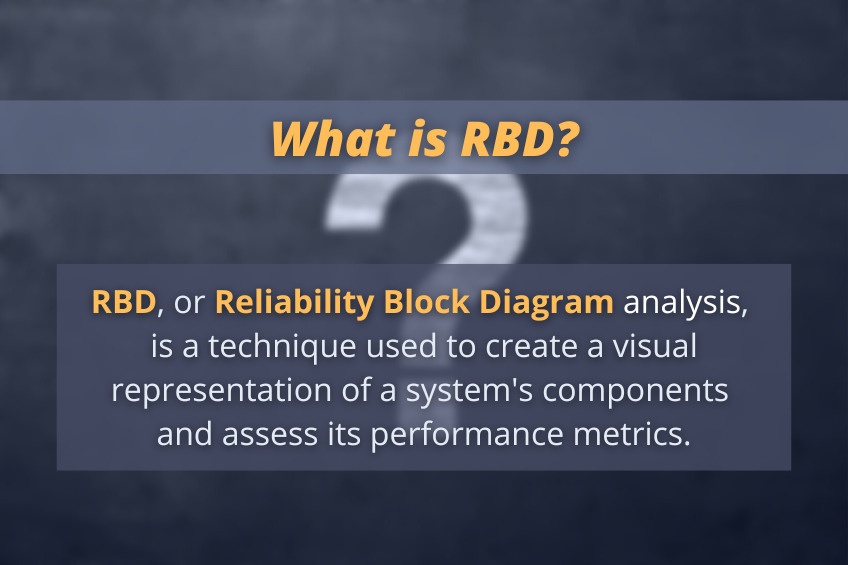
Reliability Block Diagram analysis is a technique used to assess and calculate the reliability and availability metrics of a system. RBDs are most often used to model complex systems, especially those that incorporate redundant components, repairable components, or both to more accurately reflect real-world system performance. RBD could be used to model an individual product (for example, a quadcopter drone), a portion of a product (for example, the steering assembly in an EV), or even an entire manufacturing plant.
RBDs are created in a visual format, using blocks to represent components or elements of a system. The blocks are then connected with lines to indicate their relationships to one another. Once the diagram is laid out and constructed, the visual format provides an easy and intuitive way to see the success path of the system under analysis.
Various reliability and availability metrics are often desired outputs from the reliability block diagram analysis. These include component and system reliability, availability, expected number of failures, downtime, and more. RBD is most commonly used to give analysts an idea of the overall system reliability performance. For an in-depth look at the system modeling procedures and calculation options that are available in RBD, download our white paper.
What are the Key Similarities Between FTA and RBD?
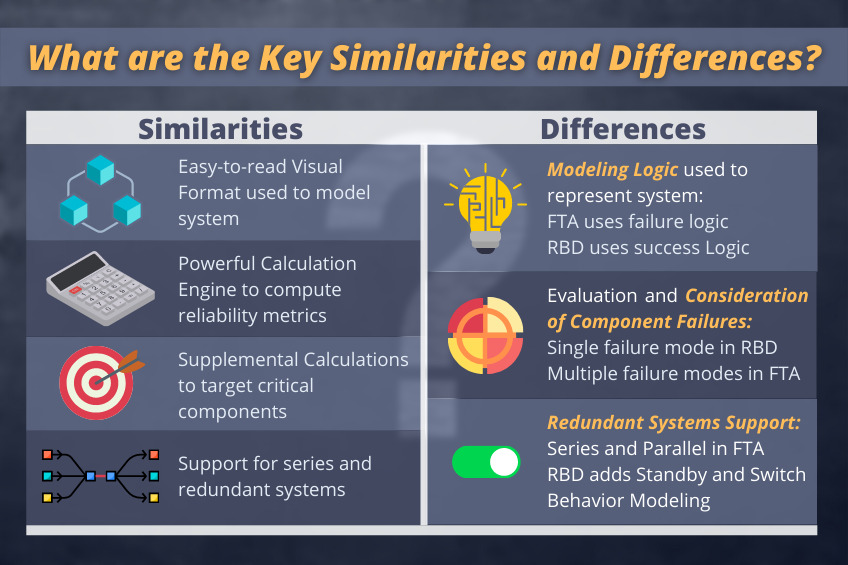
FTA and RBD both offer powerful system modeling capabilities and share some key similarities, such as:
- Both take advantage of an easy-to-understand visual format that is used to model a system.
- The front-end visual model is coupled with a powerful back-end calculation engine that is capable of calculating a wide range of performance metrics. Metrics that can be calculated with FTA and RBD include widely-used quality indicators such as reliability, failure rate, unavailability, and number of failures.
- FTA and RBD incorporate supplemental calculation abilities including cut sets in both, path sets in RBD, and Importance Measures in FTA which allow analysts to target critical components for system improvement efforts.
- Both offer the capability to model series and parallel redundant components.
What are the Key Differences Between FTA and RBD?
There are, however a few key factors that differentiate FTA and RBD, such as:
- While offering similar system modeling and calculation abilities, FTA and RBD differ in their overall logic and visual representation of the system being analyzed. FTA uses failure logic – the basic events, logic gates, and their connections detail the ways that the top-level undesired event can occur. That is, tracing the lines of a fault tree diagram will show a path to system failure. On the other hand, RBD uses success logic – the blocks and their connections show the paths that can be taken through the diagram from start to end for successful system operation. That is, tracing the lines of an RBD will show a path to successful system operation. One way of looking at the system is not necessarily better than the other. If you prefer one way over the other, you should choose the system modeling tool that suits your needs. Or in some cases, the system under analysis may naturally lend itself to one logic type over the other.
- Another main difference between FTA and RBD is how they evaluate system and component failures. Most often in RBD, a single failure mode is considered for each component and the overall system. The impacts of all potential failure modes are combined and modeled on a single block using the available failure and repair distributions. This differs from FTA where each individual failure mode can more easily be broken down into its own basic event. Then if needed, the consequences of each failure mode can be independently modeled using differing logic gate paths. For example, maybe both an open circuit and short circuit are potential failure modes, however both lead to different system consequences.
- While both FTA and RBD can be used for series and parallel systems, RBD also includes the ability to model standby components and switching behavior. In a standby system, backup components are on hand to take over should any of the active units fail. In these cases, the switchover to the backup units may include some delay or the potential for switch failure. RBD allows these switching characteristics to be taken into account.
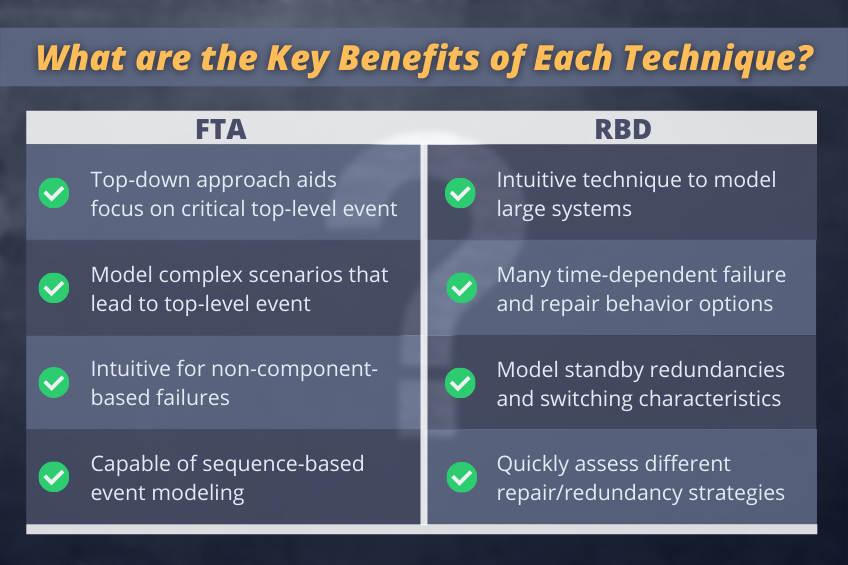
What are the Key Benefits of FTA?
With its top-down approach, FTA is most often used as a tool to determine the likelihood of a catastrophic top-level event. Its detailed approach and various logic gates allow for complex scenarios and their relationships to the top-level event to be modeled. For example, the Exclusive OR (XOR) Gate is used when the output occurs if one input does not occur and one does occur. This type of relationship cannot be modeled in RBD. Additionally, sequence-based Gates, like the Priority AND (PAND) gate where the output occurs only if all the inputs occur in a particular order are often better modeled using FTA. FTA also offers the ability to model simple parallel redundancies with AND or Voting gates.
FTA also generally offers a methodology that is more intuitive for non-component-based failures – for example human errors. These types of faults can also be modeled in RBD, however they would require the use either of “fake” blocks or by taking these faults into account for each component’s failure behavior. Because FTA is based around “events” instead of “components”, it is often the more intuitive approach to failure analysis when non-component-based failures must be considered.
What are the Key Benefits of RBD?
Due to the success logic used and the ability to easily connect blocks in a variety of ways to indicate different relationships, RBD often provides the more intuitive tool when predicting the reliability and availability metrics of large systems. Included with RBD is the ability to choose from a variety of both failure and repair characteristics for the most accurate component modeling. Where FTA considers constant failure and repair behavior or time-independent probabilities, RBD provides more options to model time-dependent failure and repair behavior. If you are analyzing a system that contains components with a varying failure or repair rate, RBD is most likely the tool of choice.
Additionally, RBD offers the ability to easily model and calculate complicated redundant component setups – indeed, this is one of the paramount reasons analysts often turn to RBD for complex systems. Both parallel and standby redundancies can be modeled, and additionally you can to take into account switching characteristics – switch probability and delay – that may be appropriate. Note that parallel redundancy is possible in FTA with AND or Voting Gates, however RBD expands on FTA’s capabilities with its inclusion of standby component and switch behavior modeling. If your system under analysis contains any redundancies or backup components, RBD likely offers an advantage in its ability to quickly and accurately model and calculate these structures.
As an extension of the usage of RBD, the built-in capabilities related to redundant component and repair modeling allow you to perform a type of “What-If?” analysis on your system. You can quickly and easily see how changing repair strategies or adding redundant components could affect overall system performance.
Can I Convert Between a Fault Tree Diagram and RBD?
Because of their similarity, the question occasionally comes up about the ability to convert between FTA diagrams and RBDs and vice versa. In some simple systems, this is possible. The key is to remember that FTA uses failure logic while RBD uses success logic. With that in mind, below are a few examples of this conversion between FTA diagrams and RBDs.
Understanding How Fault Tree OR Gates can be Represented as RBD Series Blocks
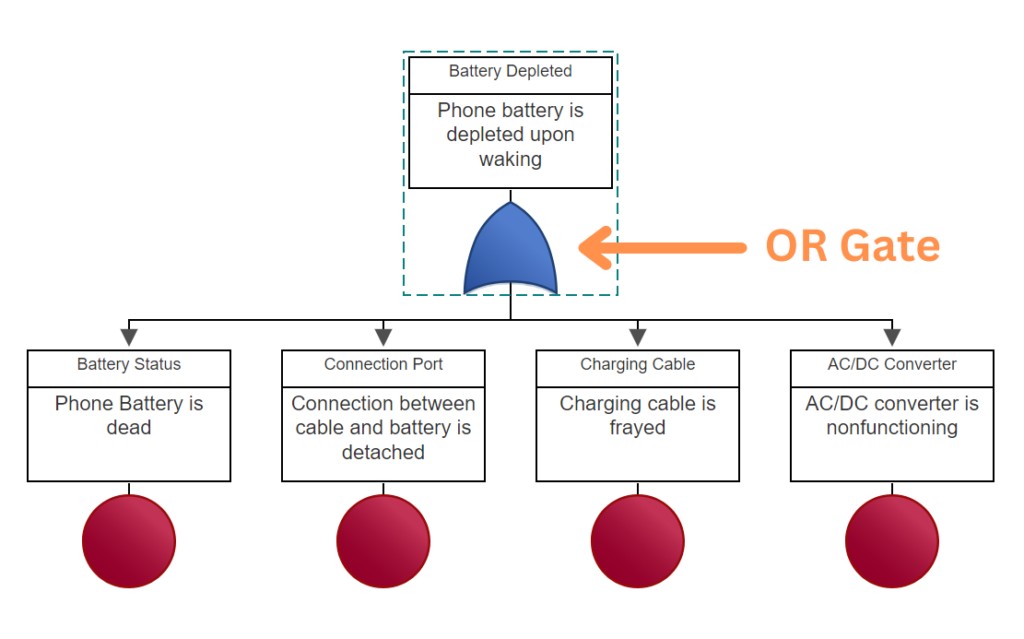
Let’s first consider the example case of charging your cell phone. For our analysis purposes, we will consider our system to be the combination of your phone with its charging unit. So, in this simple example, we are interested in the behavior of four main components – your phone’s battery, the connection port between the charger and battery, the charging cable itself, and the AC/DC converter.
First, we will start with FTA and failure logic. In this case, a failure of any one of these components will lead to the undesired event of waking up with a depleted battery. These means we should use the logic OR gate to connect the four individual component failures.
Now, with RBD and success logic, we see that the system is successful (i.e., the phone gets charged) if all each of the four components is operational. In RBD terms, this means connecting each of the four components in series.
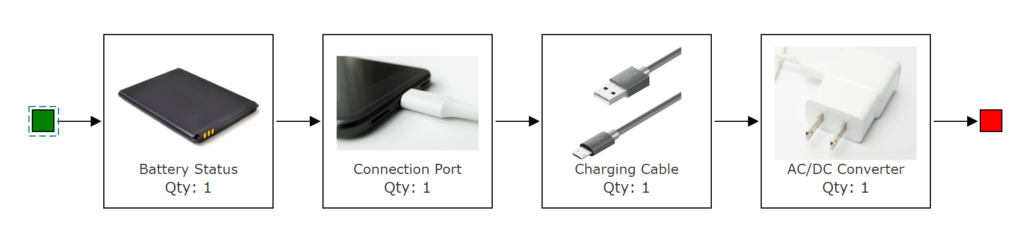
In this example, because we are dealing solely with electronic components, you can also see how RBD provides a more intuitive model for this system. Placing the diagram blocks in series mimics the real-life structure of these components, and thus may provide the intuitively easier to understand system model.
Understanding How Fault Tree AND Gates can be Represented as RBD Parallel Blocks
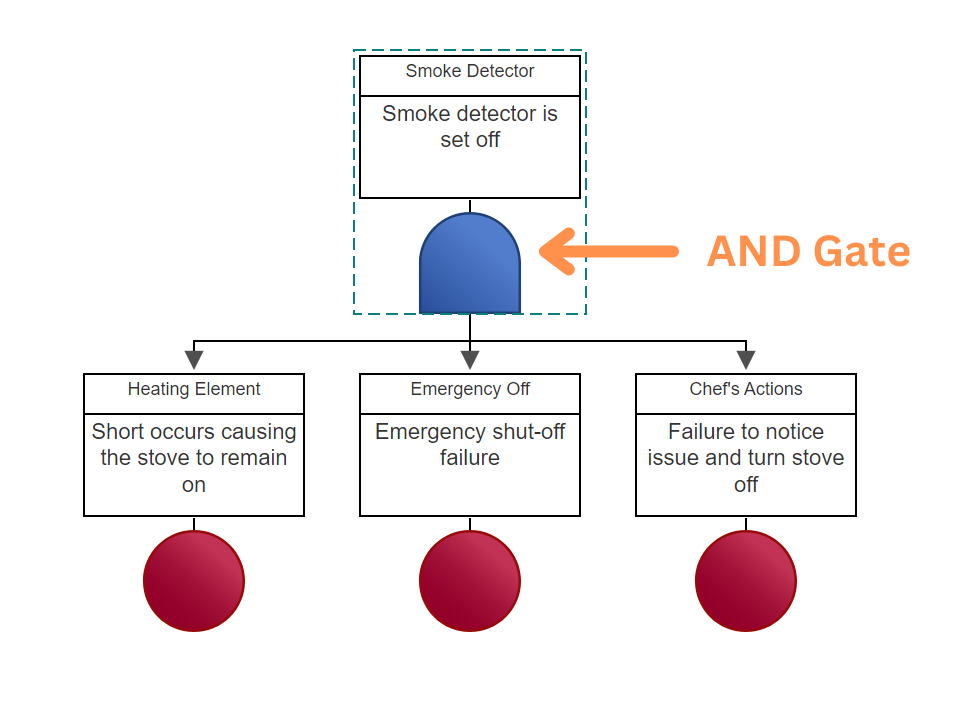
Now we will consider the example case of setting off your home smoke detector while cooking. For our analysis purposes, we will consider the system under consideration the stove heating element, its emergency shut-off, and also consider actions taken by the chef. In this case, we will consider the smoke detector going off as the top event we’d like to model.
Again, we will first begin with the FTA for this system. In this case, a failure will occur if all three of these events take place:
- A short occurs which causes the stove heating element to remain on indefinitely.
- The emergency shut-off fails.
- The chef fails to notice the problem and does not switch the heating element off.
Because the overall system failure depends on all 3 events occurring, this means we use the logic AND gate to connect the three individual events.
Examining the same system using RBD, we see that the system will be operational (i.e., the smoke alarm does not go off) so long as one of the three events doesn’t take place. This means that we will place these three blocks in parallel with each other with only one required for system operation.
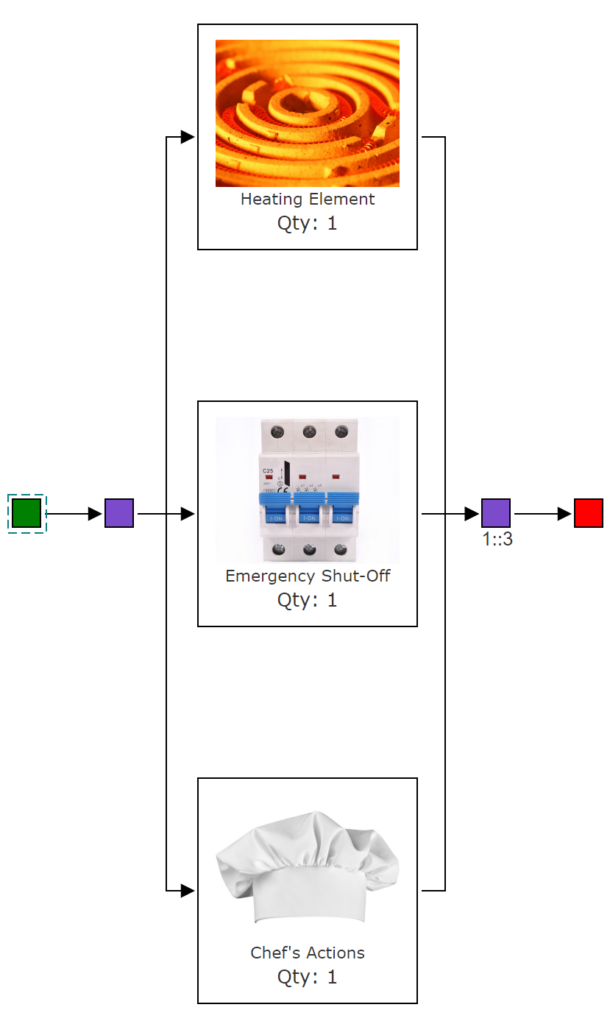
In this system, we can see how an FTA system model may be the more intuitive choice here for a few reasons. The first is that we are mainly interested in the likelihood of an undesired event occurring – the smoke alarm going off – rather than getting a picture of the overall system’s performance. Second is that we must take into account a human interaction element. With FTA’s focus on basic events rather than blocks that model system components, it is often the more intuitive option to model systems where human interaction must be taken into account.
Example of How to Convert an FTA to an RBD
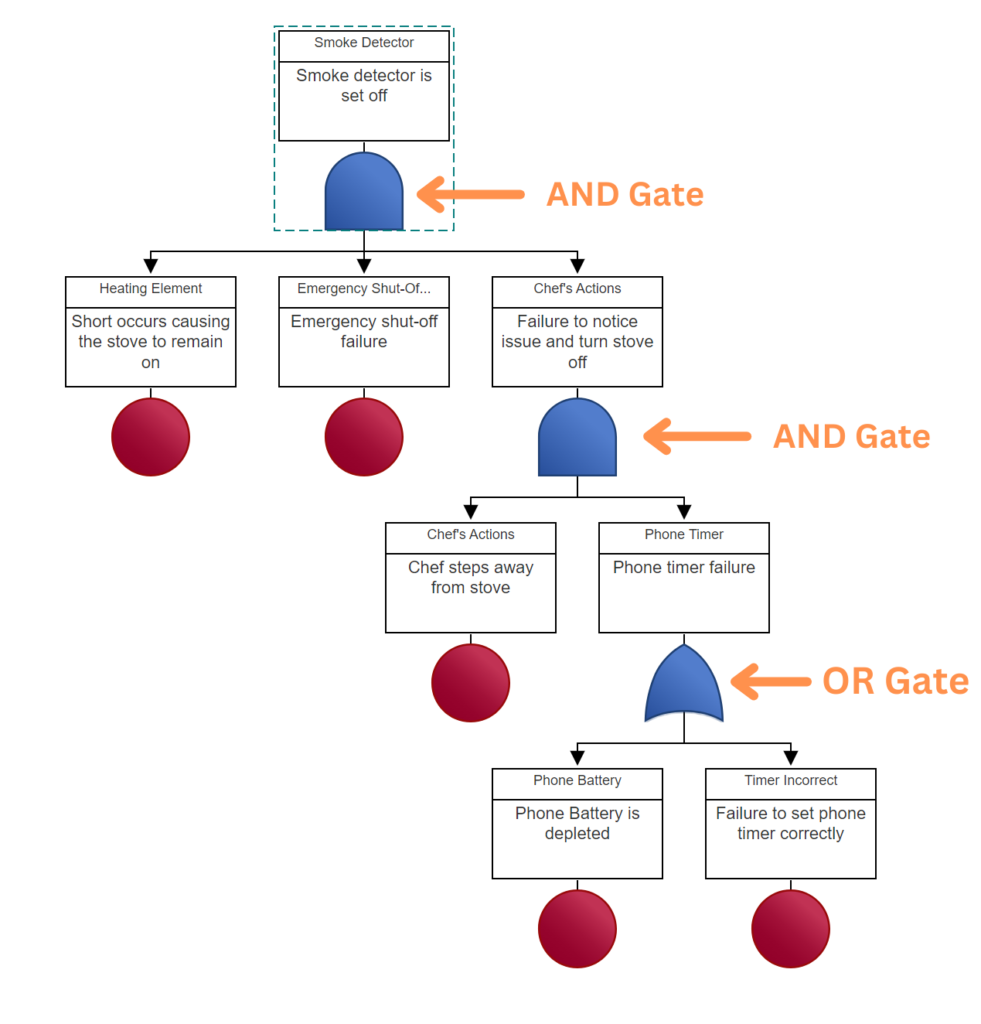
Using the basic principles described above, we can see how it is possible to convert between FTA diagrams and RBDs in some simple cases. Now let’s examine the FTA diagram below that contains a combination of OR and AND Gates. In this example, we will combine parts of the previous two from above – the main system being analyzed is the smoke detector going off. Note that for this example, we will assume the chef is using their phone timer to know when to turn the stove off. So, we will consider the chef’s failure to notice the problem as being dependent on both:
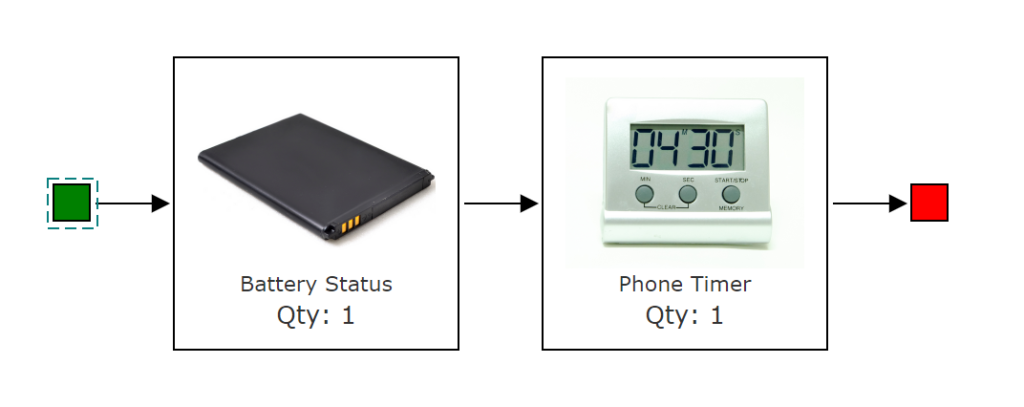
- A failure in the phone timer due to either the battery being depleted or a failure to set the correct time.
- Chef steps away from the stove for too long.
We will begin again using FTA with the diagram below.
First, as we saw, we can convert any OR gates in FTA to Series blocks in RBD.
Then we can convert all AND gates in FTA to Parallel blocks in RBD.
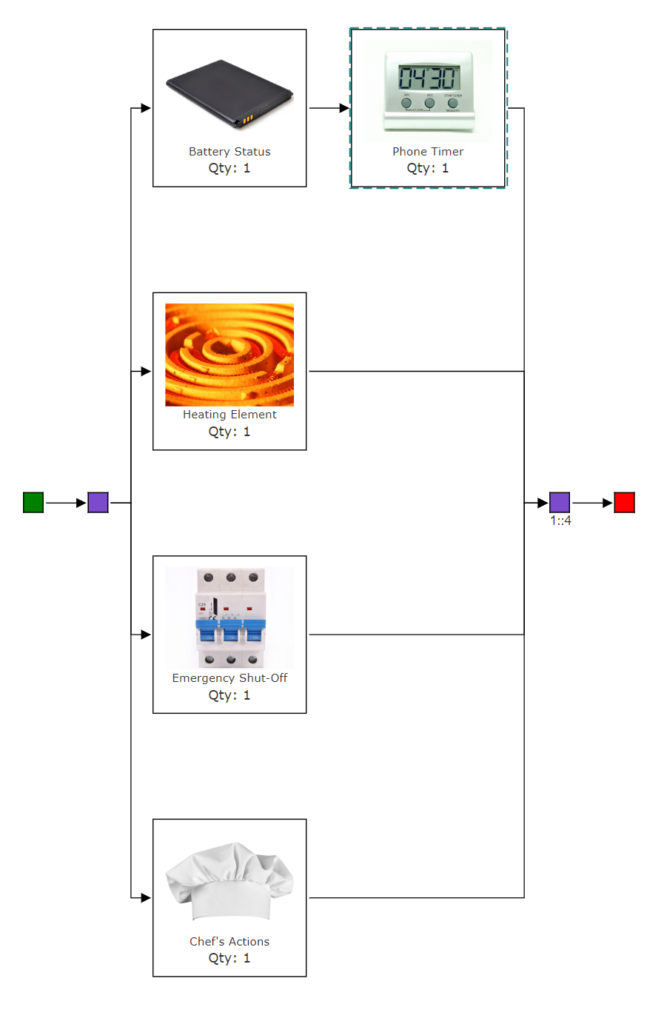
With these basic principles, you can see how it is possible to convert between simple FTAs and RBDs. However, as systems get more complex, it becomes more and more difficult to easily convert between the two modeling approaches. Additionally, because FTA and RBD offer certain exclusive component or event behavior capabilities, for example sequence-based events in FTA and switching characteristics in RBD, sometimes conversion becomes impossible. In these more complex cases, it is advisable to choose the system modeling tool that is more intuitive to your case.
Conclusion
Both FTA and RBD offer powerful system modeling capabilities and they both offer their own unique benefits. Depending on the system type being analyzed, one may lend itself more naturally to that task. Or, you may have a personal preference. Or in some cases, both may be used to model the same system, as shown in our preceding example.
Relyence Fault Tree and Relyence RBD both offer powerful and comprehensive system modeling tools for completing your FTA or RBD analysis needs. Relyence Fault Tree offers an intuitive platform for constructing FTA diagrams with the ability to model an array of input events and compute a wide range of availability metrics using its highly capable mathematical engine. Relyence RBD supports the creation of complex system models, including redundant components and branches, and computes a wide array of metrics using analytical computation methods and Monte Carlo simulation techniques.
With the Relyence Studio integrated reliability package, you can choose from either tool individually, or if desired, you can use both for your system. Contact us today to discuss your Fault Tree and RBD needs and learn how Relyence can help. Or sign up today for our free trial to test drive Relyence Fault Tree and Relyence RBD yourself.