What is RBD Analysis?
Reliability Block Diagram (RBD) analysis is a methodology for assessing and calculating the reliability and availability metrics of complex systems using a graphical depiction of the system. RBDs are created in a visual format, using blocks to represent components or elements of the system and connections between the blocks to define their relationships to one another. In other words, the layout and connections of the components indicate the paths of a given system’s successful operation.
RBDs are most often used to model complex systems, especially those that incorporate redundant components. RBDs can also include repair related data to more accurately reflect real-world system performance.
The objective of RBD analysis is to determine system metrics based on its configuration. Therefore, an RBD consists of two parts: the front-end graphical diagram that depicts the system and the back-end calculation engine that computes the reliability and availability measures of the system. This article provides information about the system modeling options and calculation techniques utilized in RBD analysis.
Why perform RBD analysis?
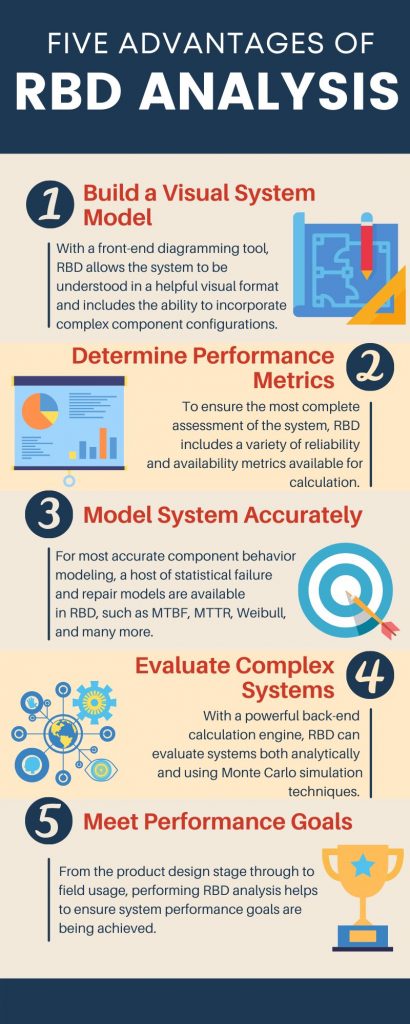
Whenever there is a need for system reliability and availability assessment, especially when redundancy is an integral part of the design, RBD analysis is the tool of choice. There are many advantages to performing RBD analysis either on its own or as part of a larger system analysis practice.
#1 Build a Visual System Model
The easiest way to understand a complex system is by viewing it in diagram form. Using a visual approach enables you to see the all the elements of the system as well as their interconnecting relationships. Because RBD analysis begins with the creation of a system model in a front-end diagramming tool, it allows team members to view the overall system and its interdependencies in an understandable format.
An additional benefit to RBD’s visual modeling is its ability to incorporate more complex configurations, such as redundancy and parallel operating branches, into the diagram. RBDs enable you to model systems that go beyond a basic series set up, thereby allowing you to evaluate systems that require high level analysis techniques.
#2 Determine Performance Metrics
The core aspect of RBD analysis is the ability to model and calculate performance metrics for complex systems. Powered by a robust back-end calculation engine, RBD can evaluate system configurations that include redundant components, parallel operating branches, and switching behavior.
A wide-range of reliability and availability metrics are available and can be selected based on your unique requirements. To view performance over time, RBD analysis can include time-based results such as reliability, availability, failure rate, number of failures, and many more. Additionally, steady state metrics, such as MTBF and MTTR, can be calculated to examine system performance when it reaches steady state. With several metrics available for calculation, RBD analysis ensures you obtain the most complete and accurate assessment for your system.
#3 Model System Accurately
RBD analysis includes the ability to define both the failure characteristics and, if applicable, the repair characteristics of the system’s components. By incorporating a host of distribution models to define failure and repair data for components, RBD analysis ensures that system performance is accurately modeled.
For example, simpler time-based parameters, such as MTBF and MTTR, can be used to model components with predictable and consistent failure and repair rates. Or statistical models, such as Normal, Lognormal, and Weibull, can be employed to model components with more complex failure and repair characteristics such as infant mortality and wear-out curves. In this way, RBD analysis can evolve over time as component knowledge is gained, thus providing increasingly accurate system modeling.
#4 Evaluate Complex Systems
After the system diagram is constructed, RBD computational engines use known mathematical techniques to calculate the system’s performance parameters. Many times, the system can be analyzed using equations that are generated based on the component characteristics and system configuration. This is referred to as solving the RBD analytically or using an analytical approach. In these cases, the selected performance metrics are then calculated based on the generated equations.
However, there are some systems that cannot be evaluated using an analytical approach due to their complexity. If an analytical solution cannot be determined, Monte Carlo simulation techniques are engaged. In these cases, RBD engines can run through hundreds or thousands of simulation iterations in order to most accurately assess system metrics. Whether using analytical or simulation techniques, RBD analysis provides efficient and accurate reliability and availability calculations.
#5 Meet Performance Goals
RBD analysis is performed in order to assess system performance. Typically, this analysis is done in order to ensure that your system is meeting its required goals. For example, you may have certain performance metrics that must be attained to meet contractual specifications, compliance requirements, or your own internal goals. RBD analysis can help you determine that your system performance meets these standards.
In addition, RBD analysis can be used as a predictive tool during a product’s design stage to model and compare various system configurations. Doing so can allow RBD analysts to assess the performance that certain product designs will have without the need to build each as a prototype, thereby saving both time and money. Modeling prototypes in RBD allows analysts to evaluate alternate component configurations, added redundancies, and repairable component strategies in order to achieve the required performance. In other words, RBD has the ability to perform “What If?” Analysis during product design to help ensure your product meets your required reliability and availability goals.
Who performs RBD Analysis?
RBD in Aerospace
RBD is useful for ensuring the safety and reliability of the equipment used in the aerospace industry. A few examples of aerospace applications for RBD are:
- RBD can be employed during prototyping to assess the safety impact of various design changes and ensure all applicable safety requirements are met.
- RBD can be used to identify and target key areas where adding redundancy is necessary to achieve system reliability and availability compliance requirements.
RBD in Automotive
In the automotive sector, the reliability and quality of vehicle components is critical for customer safety and satisfaction. RBD can be employed to assist automotive companies in these areas. Some examples include:
- RBD can be used to assess the impact of implementing various repair strategies on overall availability goals.
- RBD analysis can be applied to assist in setting warranty length and confirming high likelihood of the system’s proper functioning throughout and beyond the warranty period.
RBD in Commercial & Consumer Products
Performing RBD analysis can also benefit companies that manufacture goods for consumer use. Here are a few examples of how the commercial and consumer industries can use RBD:
- During product design, RBD analysis can be used to evaluate the effects of potential design changes. Cost-benefit analysis can then be employed to identify the best overall solution.
- After a product is in use, real-life data can be utilized in RBD to get a more accurate picture of product performance. Critical components can be identified to be improved in next generation products.
- RBD can be used to ensure a product achieves its desired quality goals, thereby minimizing the cost of poor quality (COPQ).
RBD in Defense
The defense sector has a clear need for reliability driven goals and strict adherence to reliability and maintainability (RAM) standards. Due to the potential catastrophic implications of system failure, products or systems designed for use in the defense sector must achieve a high level of reliability and availability. Companies that manufacture equipment and systems used by the military can employ RBD to ensure the reliability and availability of the weapons, vehicles, software and other equipment they produce, such as:
- RBD can be employed during the design and deployment of components of military aircraft, such as radar systems, avionics, navigation systems, and weapons systems to confirm that compliance requirements are met.
- RBD analysis can assist in determining the effectiveness of various field-based repair strategies toward improving system performance.
- In systems with catastrophic failure consequences, the impact of adding redundancies to critical components can be evaluated.

RBD in Energy
In the oil & gas sector, predictability of extraction systems is a critical area of focus. From offshore rig disasters to gas line ruptures, the consequences of failure in this field can be catastrophic. Because of this, risk assessment and minimization are key areas of focus. Below are a few examples of how RBD analysis can be implemented in the oil & gas sector:
- Because of its high-powered mathematical engine, RBD can be utilized to calculate reliability and availability metrics of highly complex systems, including systems as large as entire oil rigs.
- System downtime is a critical metric in the oil & gas sector. As part of RBD analysis, downtime can be calculated, and the impact of any potential repair processes can be taken into account.
Primary sources of power generation include fossil fuels, nuclear energy, and renewable sources. In each, RBD analysis can be a helpful tool – some examples include:
- Similar to oil & gas extraction operations, RBD can be utilized to calculate reliability and availability metrics of highly complex systems, such as entire fossil fuel generation plants.
- In nuclear power, safety goals are a key area of focus. RBD analysis allows you to calculate safety metrics and take into account any applicable redundancies to ensure required performance is being met.
- Many solar energy farms consist of an array of photovoltaic (PV) inverters that directly convert sunlight into electricity. In these cases, redundancy in RBD analysis can be leveraged to provide easy and accurate reliability and availability metrics.

What are the Results from RBD Analysis?
To perform its calculations, RBD analysis relies on a powerful calculation engine that takes into account the component arrangement and all defined failure and repair models. Depending upon the complexity of the diagram and component data, RBDs may be analyzed using analytical techniques, Monte Carlo simulation, or a combination of the two. Thus, a powerful calculation engine is required. Results obtained can include various reliability and availability metrics as well as path sets for the system.
Reliability and Availability Metrics
Central to RBD analysis is a calculation engine that supports a host of both time-based and steady state reliability and availability related metrics. The measures to calculate can be selected depending on the specific needs or requirements of the system under consideration.
Commonly considered reliability and availability metrics include reliability, availability, downtime, failure rate, and MTBF.
Path Sets
In addition to system reliability and availability metrics, RBD analysis can include computations that help identify key components or groups of components in a given system. Results from these calculations can be used to denote paths of successful system operation or to discover critical components or groups of components.
In an RBD, a Path Set is a collection of components that ensure system success if all components are operational. They can be thought of as the ways to connect the start and end nodes through the diagram’s blocks. In other words, system success is guaranteed if none of the blocks fail in a given path set.
How to perform RBD analysis
Efficient and effective RBD analysis begins by constructing a system model using a diagramming tool and defining the appropriate input parameters to be used in the calculations. After system setup is complete, a calculation engine is engaged to compute the desired reliability and availability metrics. The calculated results are then evaluated to ensure the system’s required performance goals are met or, if desired performance is not achieved, to target areas for product improvement efforts.
In this section, we will step through an example of how to perform basic RBD analysis on a remote-controlled helicopter using Relyence RBD software.
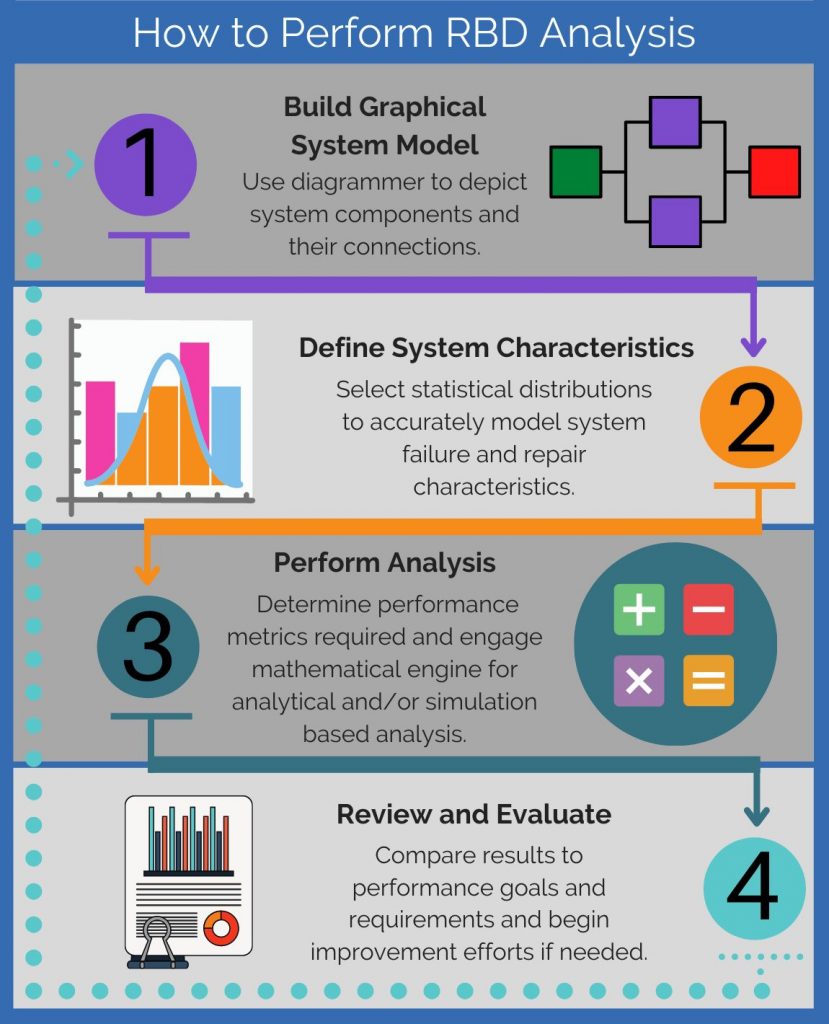
#1 Build Graphical System Model
RBD analysis begins by visually laying out the components in the system using the graphical modeling feature. The diagram depicts what components are required and in what configurations for successful system operation. Connections between blocks depict any relationship, physical connection or other, that exist between components.
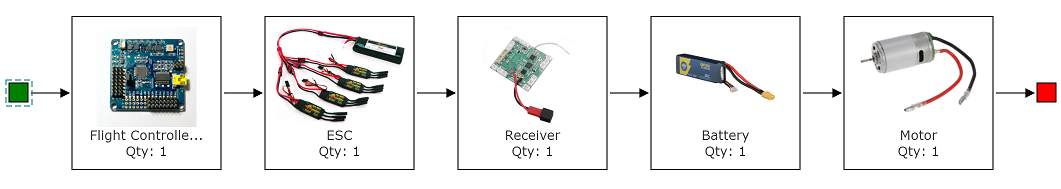
In this simple case, we will assume there are no redundancies in the system under consideration (i.e., all components must be functioning correctly in order for successful operation of the RC helicopter). Our RBD model consists of the following:
- Flight Controller PCB: Circuit board with flight controller avionics.
- Electronic Speed Controller: Interface between flight controller board and rotor for speed control in flight.
- Receiver: Radio receiver for obtaining commands from ground controller.
- Battery: Power unit.
- Motor: Provides power to spin the rotary wings.
Our visual model in Relyence RBD is below:
#2 Define System Characteristics
After the visual diagram is created and component relationships are specified, the next step is to define the appropriate failure and repair related information for each block. To model component behavior, RBD leverages known statistical distributions which can come from various sources, including prior component knowledge or other RAMS tool such as Reliability Prediction, FRACAS, Maintainability Prediction, Weibull, and ALT.
In the RC helicopter example, we will assume the components all have constant failure rate and are not repairable once they have failed. The failure profiles for each component are defined as:
- Flight Controller PCB: Failure Rate = 20 FPMH (Failures per Million Hours)
- Electronic Speed Controller: Failure Rate = 10 FPMH
- Receiver: Failure Rate = 10 FPMH
- Battery: MTBF = 15,000 hours
- Motor: Failure Rate = 5 FPMH
#3 Perform Analysis
After the calculation inputs are defined, the next step is to compute the appropriate reliability and availability metrics. To do so, RBD analysis relies on a powerful calculation engine that takes into account the diagram’s configuration and all defined failure and repair inputs. Depending upon the complexity of the system model, RBDs may be analyzed using analytical techniques or simulation, or a combination of the two.
In the RC helicopter example, we are interested in learning the mean time to failure (MTTF) and the probability that the system is still operational after 1000 hours of operation (i.e., Reliability at Time 1000). Results obtained from RBD calculations are:
- MTTF = 8955 hours
- Reliability at Time 1000 = 0.894342
#4 Review and Evaluate
Once obtained, the calculated results are then evaluated and compared to the required metrics. Depending on the outcome, system operation may be validated or product improvement efforts may be required. The evaluation step should be performed regularly as further data is gathered on the system’s components through their lifetime. Doing so helps ensure the system’s performance goals are continually being met.
In the RC helicopter example, assume our organization sets goals for our calculated metrics for at:
- MTTF = 10,000 hours minimum
- Reliability at Time 1000 = 0.90 minimum
As is seen, our calculated results do not meet our organization’s standards. As such, we must undergo product improvements efforts, such as adding redundancies, improving component performance, or some combination of these methods. A few examples of improvements that can be made to meet the organization’s requirements are:
- Purchase the flight controller unit or its components from different suppliers to improve performance of the flight controller to a failure rate of 8 FPMH. This would bring the RC helicopter into compliance with the organization’s standards and lead to system performance of:
- MTTF = 10,033 hours
- Reliability at Time 1000 = 0.905139
- Or, add redundancies to one or more of the system’s components. In this case, we will examine the impact of adding a backup battery unit to the RC helicopter. We will assume the backup unit has identical failure characteristics to the primary and is not operating until the event of primary unit failure. This would bring the RC helicopter into compliance with the organization’s standards and lead to system performance of:
- MTTF = 14,302 hours
- Reliability at Time 1000 = 0.953965
Relyence RBD Software
Given the complexity of RBD analysis, a multifaceted software tool is generally used for effective RBD analysis. Relyence RBD has a wide range of advantages that make it a powerful addition to your reliability toolset. Some of these features include:
- Easy-to-use diagrammer with smart layout to expertly manage diagram layout
- Visually impressive graphical model creation with the ability to upload images to RBD blocks
- Fast and accurate calculation engine, including Monte Carlo simulator capabilities
- Dashboards to view high level metrics
- Subdiagram pane to display hierarchical subsystem relationships and efficiently manage large systems
- Integration with other Relyence RAMS tools
- Flexible report generation
- Role-based permissions and access control capabilities
At Relyence, our mission is to build not only the most capable tools, but also the most technologically advanced and well-crafted applications available. We rely on our expertise to build the tools reliability experts expect, and couple that with a design elegance and utility that makes our tool suite stand out.
Relyence RBD accomplishes this goal on many fronts. Our front-end diagramming tool is not only easy to use, but also allows you to create effective, crisp, sharp-looking RBDs. Our back-end calculation engine is tuned for computing a broad range of metrics in the most efficient way. Added to those core capabilities is a complete set of features to extend RBD analysis to a new level. Relyence RBD represents the highest-level performance in system modeling packages.
To learn more about the advantages of Relyence RBD, or to see it in action, sign up today for your own no-hassle free trial. Or, feel free to contact us to discuss your needs or schedule a personal demo.