The latest and greatest – Relyence 2023 Release 2 is now available! We promise the wait was worth it! Relyence 2023 Release 2 adds several exciting new capabilities to the Relyence Studio reliability and quality tool suite – from the addition of new products, major enhancements to existing ones, and updates to more advanced features, this release has it all. As always, we strive to keep our promise to bring you the best-in-class reliability and quality tool suite so you can get the most out of your reliability analyses. Continue reading or check out our release highlights video to find more details about this exciting release.
Introducing Relyence RCM!
Reliability Centered Maintenance, or RCM, is a maintenance planning methodology to help determine the most effective maintenance program for a given system. The goal of RCM is to determine a maintenance plan for a system that includes a list of maintenance tasks and schedules that is both effective at failure mitigation and cost-efficient. RCM can be performed according to well-known and established standards, such as SAE JA1012, MIL-HDBK-2173, and NAVAIR 00-25-403. These standards provide guidelines that assist in the evaluation of a system’s potential failures to determine the optimal maintenance strategies that effectively mitigate the detrimental effects of those failures.

We are excited to announce that Relyence 2023 Release 2 introduces Relyence RCM to our best-in-class reliability and quality tool suite. Relyence RCM facilitates the use of the RCM methodology as laid out in standards such as SAE JA1011 and JA1012, MIL-HDBK-2173, and NAVAIR 00-25-403. Additionally, Relyence RCM comes supplied with several commonly used RCM elements and additional features that are designed to ensure your RCM process is as efficient and effective as possible.
Integration with Relyence FMEA
One of the first steps of many RCM processes involves determining the Functions, Failure Modes, and associated risk data for the system under analysis. This same information is commonly captured as part of a FMEA (Failure Mode and Effects Analysis) process. To take advantage of this data overlap, Relyence RCM is designed to work in sync with Relyence FMEA When used together, Relyence FMEA and Relyence RCM offer a powerful platform to complete the most highly effective Reliability Centered Maintenance analyses. This means that your Failure Modes and associated Relyence FMEA data are automatically shared with Relyence RCM – no importing required! Plus, Relyence RCM seamlessly integrates with whatever type of FMEA you perform including Design FMEA (DFMEA), Process FMEA (PFMEA), FMEA-MSR (Monitoring and System Response), and MIL-STD-1629A FMECAs.
Additionally, with the FMEA Insight capability, you can view relevant FMEA data as needed when performing your RCM analysis. A simple click in your Decision Diagram enables you to view the FMEA risk data associated with the Failure Mode currently being examined.
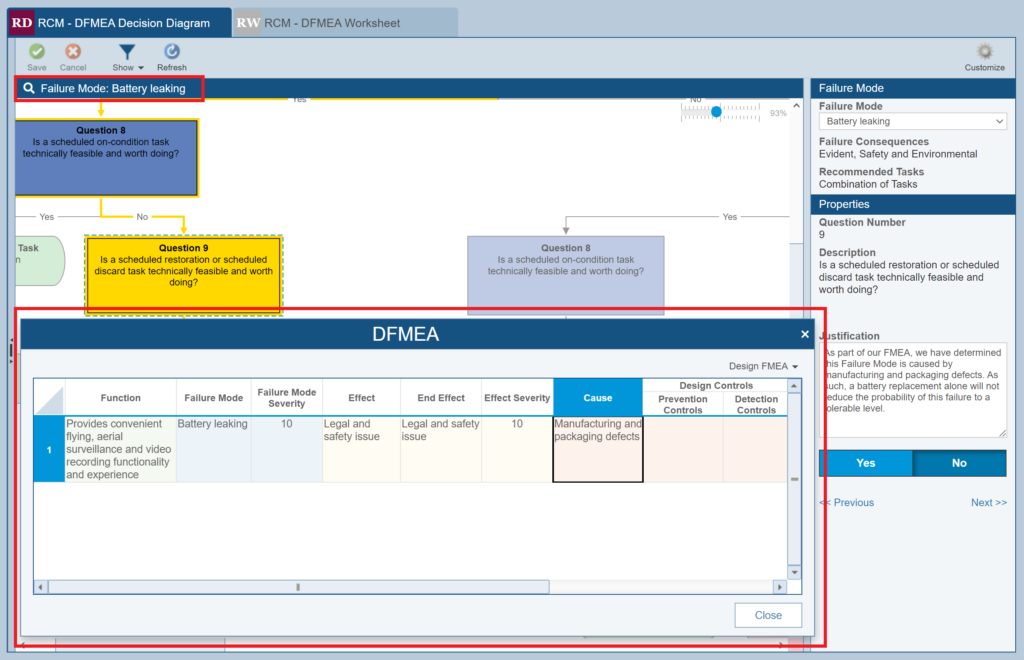
Simply click the blue FMEA Insight toolbar above the Decision Diagram to view the relevant Failure Mode with its Effect and Cause data.
This ensures you can easily view the relevant Failure Mode with its Effect and Cause data to help you complete your RCM analysis. It can also aid in classifying Failure Modes into RCM Failure Consequences and determining appropriate Maintenance Tasks.
Alternatively, if you prefer, Relyence RCM can be used as a standalone product. In this case, you can use Relyence RCM to develop your list of Failure Modes and then proceed through the RCM process.
Guided Decision Diagrammer
In many applications of RCM, especially those performed based on standards such as SAE JA1012 and MIL-HDBK-2173, a Decision Diagram is used to guide RCM practitioners through the maintenance task evaluation process. Relyence RCM’s Guided Decision Diagrammer makes building and navigating your Decision Diagrams an easy and straightforward process.
You can choose to either use one of the built-in Decision Diagrams based on SAE JA1012, MIL-HDBK-2173, or NAVAIR-00-25-403 or create your own. If you opt to create your own Decision Diagram or augment one of the built-in options, the Guided Decision Diagrammer can be easily modified using the Customize feature. You can modify Questions, insert Questions, and add Tasks or Non-Task Outcomes across all diagram branches.
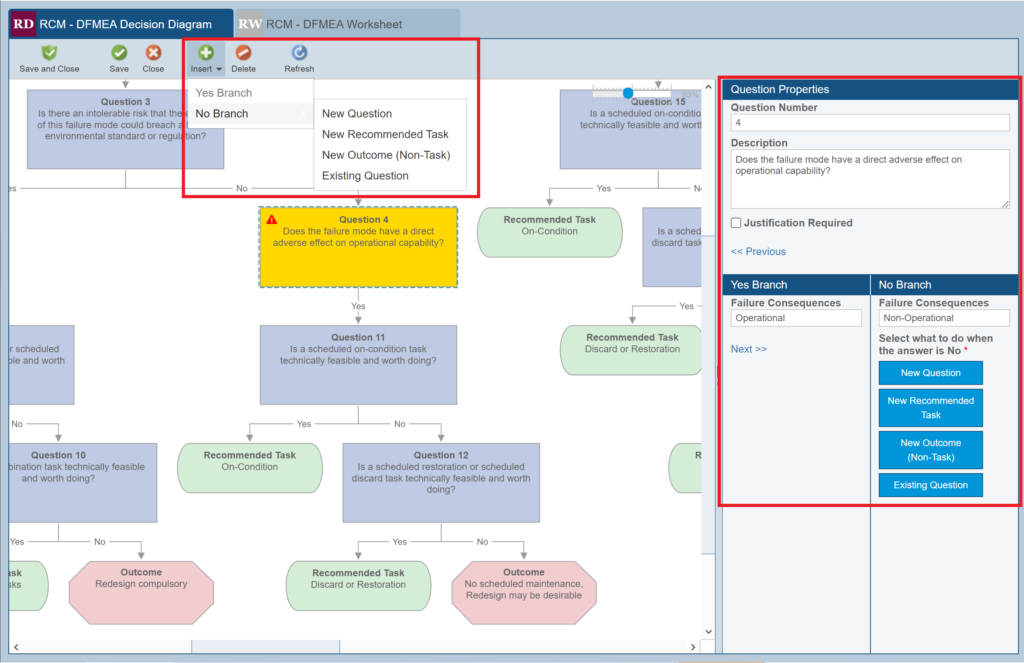
The Guided Decision Diagrammer in Relyence RCM allows you to easily modify Questions, insert Questions, and add Tasks or Non-Task Outcomes across all diagram branches.
The Guided Decision Diagrammer capability ensures that proceeding through the Diagram is made as easy as possible. With the appropriate Question highlighted, simply select Yes or No from the Properties pane and automatic navigation takes you to the next appropriate Diagram element – Question, Task, or Non-Task Outcome – that should be completed. Additionally, each Question in the Decision Diagram comes with a corresponding Justification field that can be used to further clarify the reasoning for the selected Answer.
Flexible RCM Worksheet
On the RCM Worksheet, you can define the specific Maintenance Tasks that will be used to mitigate the potential failures being analyzed. RCM standards, such as MIL-HDBK-2173, contain predefined Worksheet formats that can be used for your RCM data. Relyence comes with built-in Worksheet templates based on the RCM processes described in MIL-HDBK-2173, SAE JA1012, and NAVAIR 00-25-403.
Additionally, Relyence RCM offers full customization of the RCM Worksheets. This allows you to create a custom Worksheet format that may be best suited for your needs. The Relyence RCM Worksheet can contain the Failure Modes being analyzed, data from the Decision Diagram, and all Maintenance Task related information for each Failure Mode. From the RCM Worksheet, simply use the Customize View to customize your Worksheet with a variety of user-definable text-based, numerical, date, images, or checkbox fields. Additionally, the Relyence RCM Worksheet can automatically pull in data from your Decision Diagram, including your Answers and Justifications to the Decision Diagram Questions, Failure Consequences, Recommended Task Types, and Non-Task Outcomes.
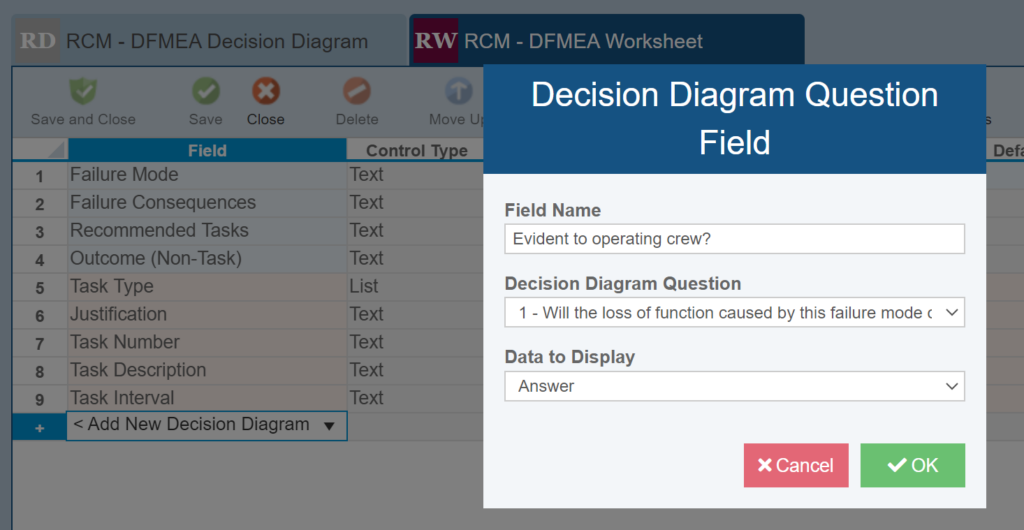
The Customize View feature in Relyence RCM allows you to customize your Worksheet with a variety of user-definable fields and Decision Diagram Question data.
Complete Support for All RCM Elements
Relyence RCM comes supplied with built-in templates for the SAE JA1012, MIL-HDBK-2173, and NAVAIR 00-25-403 RCM standards, including complete out-of-the-box support for the Failure Consequences, Maintenance Task Types, and Non-Task Outcomes as laid out in those standards. Additionally, these commonly used RCM elements are fully customizable so they can be tailored exactly to your organization’s needs.
Failure Consequences
Relyence RCM comes with a built-in list of Failure Consequences based on the SAE JA1012, MIL-HDBK-2173, and NAVAIR 00-25-403 standards. You can use the built-in Failure Consequences as-is, modify them, or create your own that are tailored specifically to your organization’s needs. From the Customize feature on the Decision Diagram, you can define a Failure Consequence for each Yes and No branch of the diagram. Then, as you proceed through the Decision Diagram, Relyence will automatically assign the appropriate Failure Consequences to your Failure Mode.
Maintenance Tasks
The end goal of the RCM Decision Diagram is to lead you to a recommended Maintenance Task Type for a given Failure Mode. In Relyence, you can easily define your Task Types from the Sidebar menu of Relyence RCM using the Configure > Task Types option.
Non-Task Outcomes
In some cases, you may find that certain failures cannot be integrated into the Maintenance program – that is, they do not have an appropriate Maintenance Task that can be associated with them. For these failures, Relyence RCM includes the Outcome (Non-Task) option to denote these non-Maintenance Task-related actions. In Relyence RCM, Non-Task Outcomes can be added to the Decision Diagram through the Customize feature either from the Insert toolbar command or the New Outcome (Non-Task) button in the Question Properties pane.
RCM Case Study
To see Relyence RCM in action, we’ll use the Relyence supplied Quadcopter Drone Example Analysis. We’ll perform an RCM analysis using the Failure Mode of Battery leaking. This Failure Mode and its associated risk data in Relyence Design FMEA can be seen below:

We have decided to use the SAE JA1012 Decision Diagram template, so our Questions align with those from the standard. To begin the RCM process in Relyence RCM, we proceed through our chosen Decision Diagram to classify our Failure Mode as a specified Failure Consequence. A summary of the resulting Decision Diagram data is shown below:
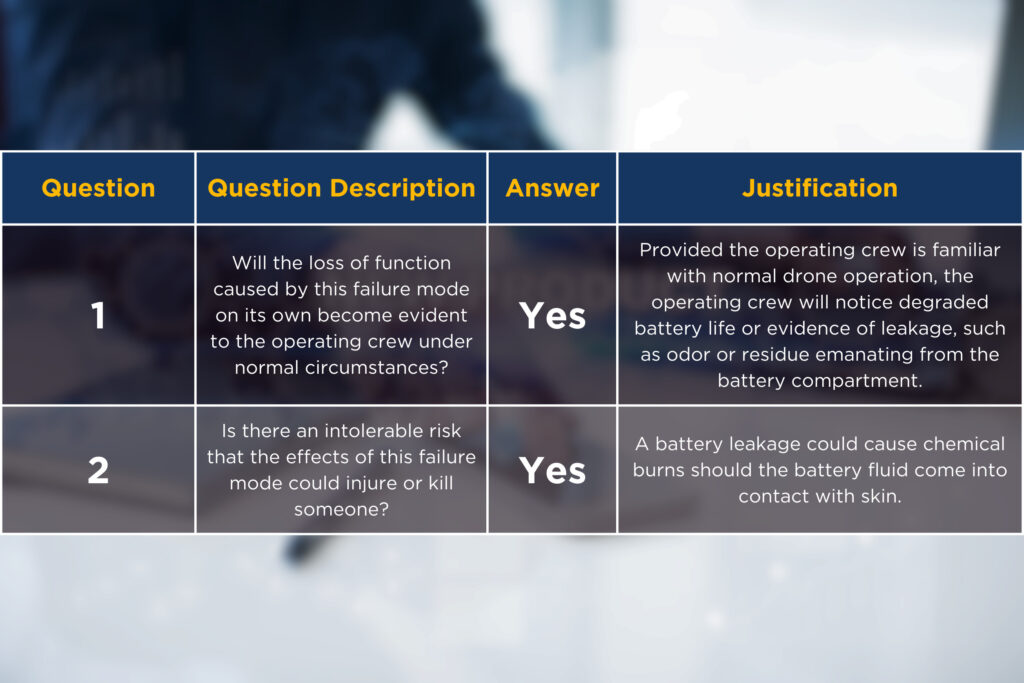
Based on the criteria laid out in the SAE JA1012, this means our Failure Mode has been classified to have Evident, Safety and Environmental Failure Consequences. We now continue our Decision Diagram through to Maintenance Task Selection:
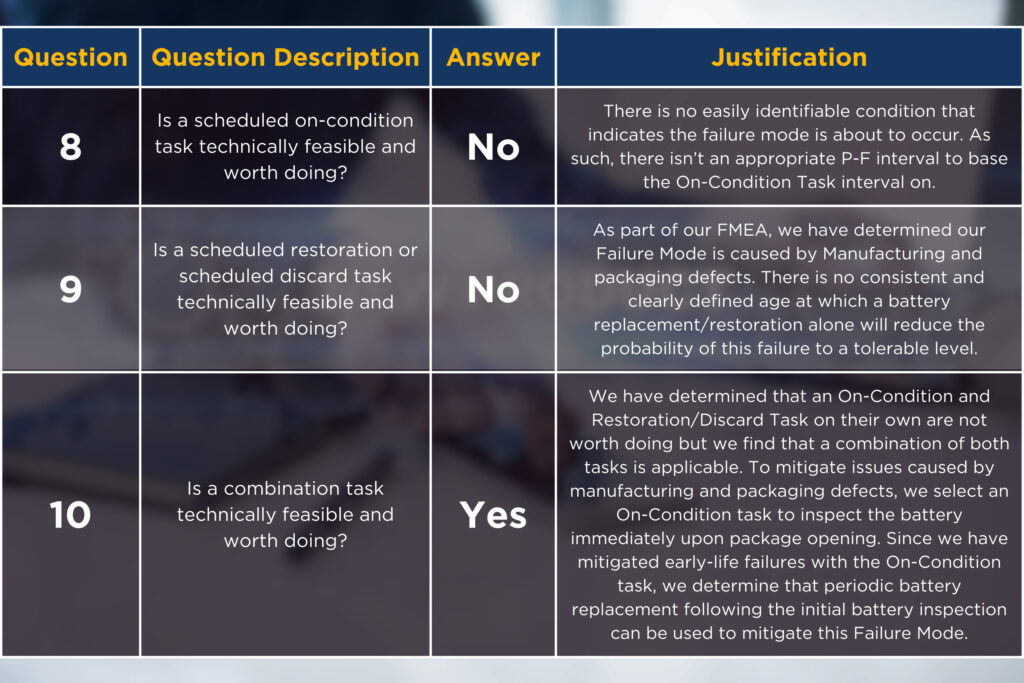
The corresponding Decision Diagram can be seen below:
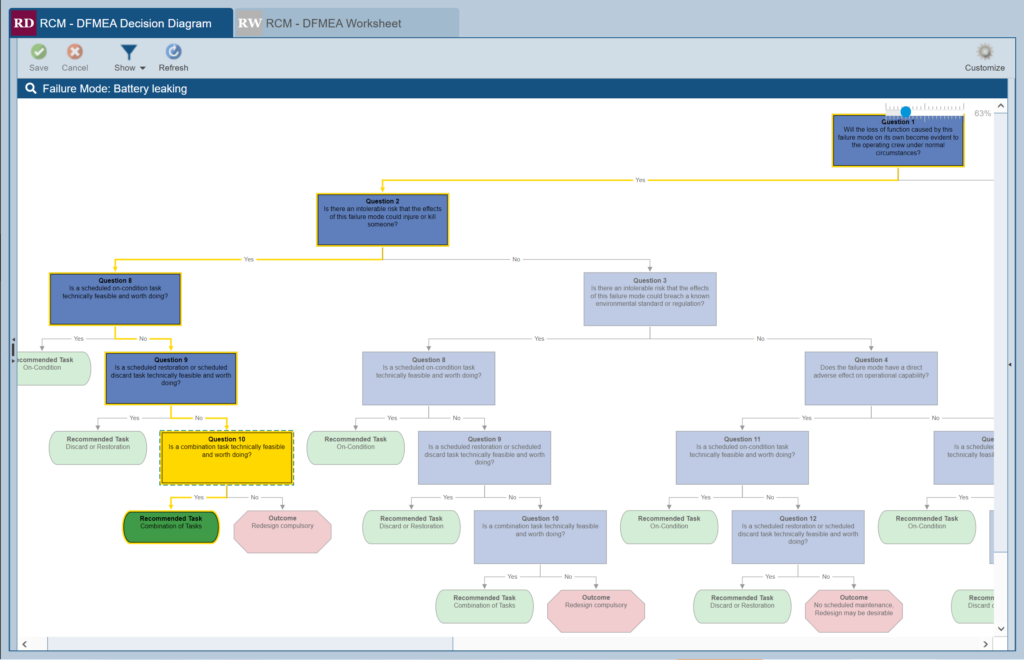
Now that our Decision Diagram is completed for our Failure Mode, we move on to the RCM Worksheet. With Relyence RCM, you can customize the RCM Worksheet to include the data from your Decision Diagram, including Failure Consequences, Question and Answer details, and Justifications. Additionally, you can create multiple Views to enable you to see the most relevant data as needed. For our example, we chose to create a Worksheet View that includes all the information that we added from the Decision Diagram:
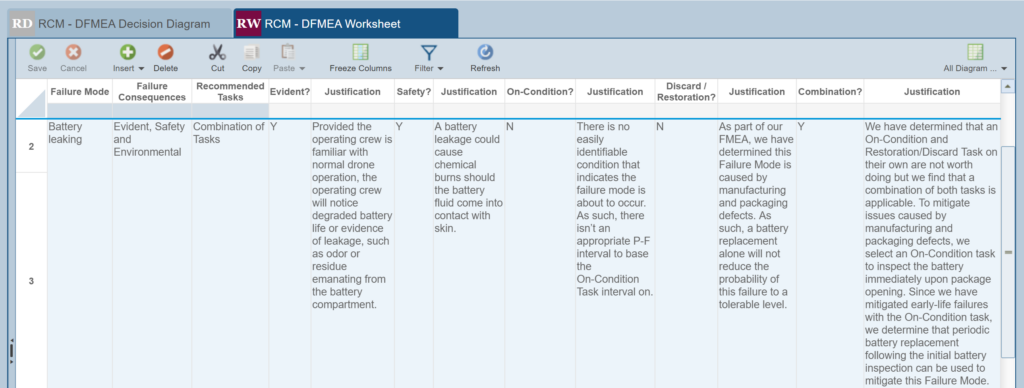
Creating multiple data Views ensures your RCM Worksheet can contain all the appropriate data needed for you to most easily complete your RCM analysis. Next, we proceed to add information about the specific Maintenance Tasks involved in the maintenance program for our Failure Mode. In this case, we decide to hide the Question and Answer details from our RCM Worksheet so we are better able to focus on adding the appropriate Maintenance Task details:

We have now completed the RCM process for our Failure Mode of Battery leaking.
Test Drive Relyence RCM Today!
With the addition of Relyence RCM, we are excited to continue our tradition of building intuitive and well-designed products for the Relyence Studio tool suite. Give it a test drive for free or contact us for more information on this exciting new product!
New in Relyence Weibull: Reliability Growth Analysis!
Reliability Growth Analysis (RGA) is a methodology for analyzing life data obtained during a product’s design phase in order to measure and track a system’s reliability metrics over time. When a product is initially designed, its first prototypes often fail to meet the organization’s reliability targets due to various causes, such as manufacturing flaws, inadequate repair procedures, or engineering oversight. These issues can be uncovered by putting the prototypes through testing procedures, such as field-based or lab tests, that are designed to stress the system to uncover potential issues that can be corrected. Improvements can then be put in place for the prototype’s next iteration, thereby increasing product reliability. Reliability Growth Analysis provides a methodology to track the effectiveness of the improvements made over time on a product’s reliability performance.

The first step in Reliability Growth Analysis is to gather the data from the prescribed testing procedures. The exact testing procedures chosen by your organization will vary based on your system’s requirements or organization’s goals, but metrics that are often tracked include time to failure or failed interval.
Once a sample set of life data is gathered, the next step in Reliability Growth Analysis involves analyzing the data using statistical techniques. These statistical techniques are utilized to analyze the data and predict reliability metrics, such as Failure Rate and MTBF (Mean Time Between Failures), of your sample data set. You can then use this information to evaluate trends in your reliability metrics. This can help provide insights into the effectiveness of certain change actions that were taken at various points in the prototyping process, such as design changes, process improvements, or corrective action implementation. Additionally, this analysis can help target areas of the system that need improvement by providing insight into the which change actions had largest impact on reliability.
Reliability Growth Analysis Using the Crow-AMSAA Methodology
Relyence Weibull software provides complete life data analysis as part of the powerful Relyence reliability and quality tool suite. As part of Relyence 2023 Release 2, the capabilities of Relyence Weibull have been expanded to include the ability to perform Reliability Growth Analysis using the Crow-AMSAA technique.
With RGA in Relyence Weibull, you can input your life data set either as Exact Failure Times or, if the exact time to failure isn’t known, as time Intervals on the Data Points Table. Once your life data set is complete, you can perform statistical analysis calculations based on the Crow-AMSAA reliability growth model. Also included are reliability metric plots to provide a visual representation of the underlying data and statistical fit line in a graphical format. Reliability growth plots are an important aspect of Reliability Growth Analysis and allow you to easily see your reliability metric changes over time as design changes are implemented. Supported plot types including Instantaneous and Cumulative Failure Rate, Instantaneous and Cumulative MTBF, Cumulative Occurrence, and Cumulative Failures. Additionally, you can add upper and lower confidence bounds to your plots, as well as customize the legend appearance and plot headings. Also included is a built-in Analytics Calculator that allows you to calculate various point-based metrics based on your Reliability Growth data set.
For RGA analysis, Relyence will set a Termination Time equal to the last Failure Time in the Data Points table. Or, you can choose to specify a Termination Time from the Calculation Parameters pane. Termination Time is used to indicate the end time of the test period and is denoted by an orange vertical line on reliability growth analysis plots.
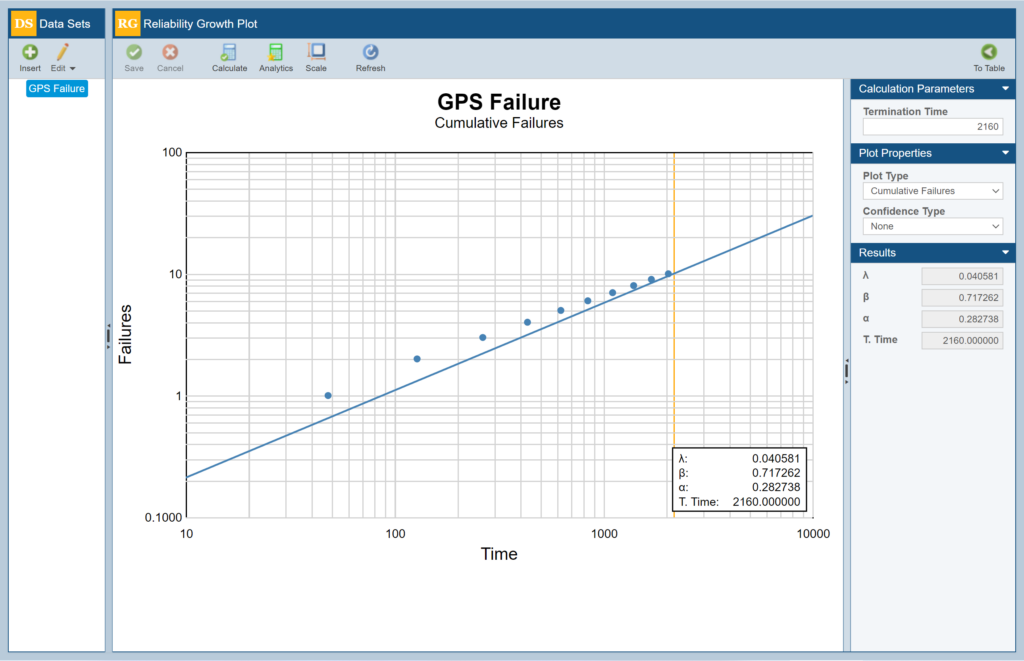
Relyence Reliability Growth supports various plot types including Instantaneous and Cumulative Failure Rate, Instantaneous and Cumulative MTBF, Cumulative Occurrence, and Cumulative Failures.
To utilize the Reliability Growth Analysis capability, simply enable the Reliability Growth option from the Properties on the Sidebar menu of Relyence Weibull.
Expanded FMEA Characteristics Customization Features
Product and Process Characteristics are two important elements that are commonly used in Failure Mode and Effects Analysis (FMEA). Product Characteristics, which can also be referred to as Special or Critical Characteristics, are used to represent identifiable features or traits of the element under analysis. Example Product Characteristics include weight, hardness, and material composition. Process Characteristics, used when performing Process FMEA, are the various factors that can affect the output of a process step. Process Characteristics examples include torque, flow rate, and tool temperature. With Relyence 2023 Release 2, we have introduced the ability to customize your FMEA Characteristics to include a variety of field types, including text-based, numeric, image, and attachment fields. The ability to customize your Characteristics ensures that your FMEA data is kept consistent and accurate across your FMEA documents.
For example, you may have defined a Product Characteristic for the bolt diameter used to mount the camera unit to a quadcopter drone. In this case, the bolt diameter used in this process is one inch, so we decide we would like to add this additional information to our bolt diameter Product Characteristic. To do so, simply select Customize Table from the bottom of the Configure > FMEA > Characteristics dialog. Then, we use the dropdown selector to add a new “Specification” text field to our Characteristic and define the diameter measurement of one inch from the Characteristics dialog.
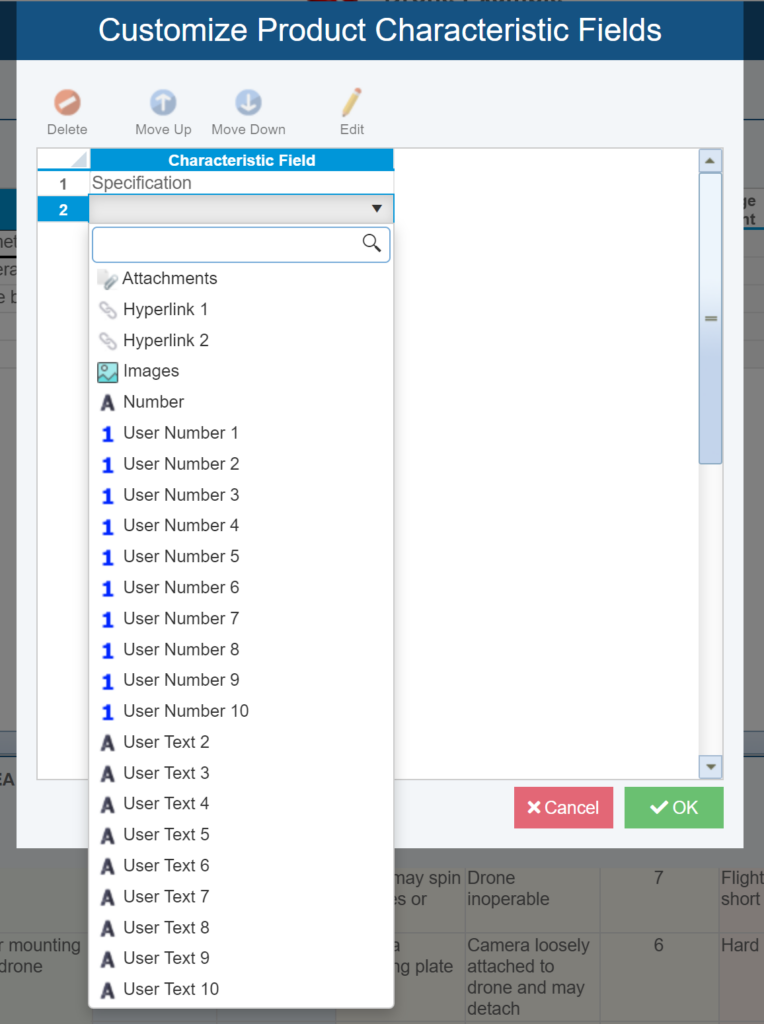
The ability to customize your FMEA Characteristics ensures that your FMEA data is kept consistent and accurate across your FMEA documents.
Now, to see our custom Characteristic field on the appropriate FMEA documents, we can simply add the new field to our Worksheet using the Customize feature. This allows for ultimate flexibility in the Characteristic data that is shown across your FMEA documents – for example, you can choose to show the “Specification” field on the Control Plan but not on the PFMEA Worksheet. This ensures your Worksheets are kept as concise as possible and show only the applicable data for that FMEA document.
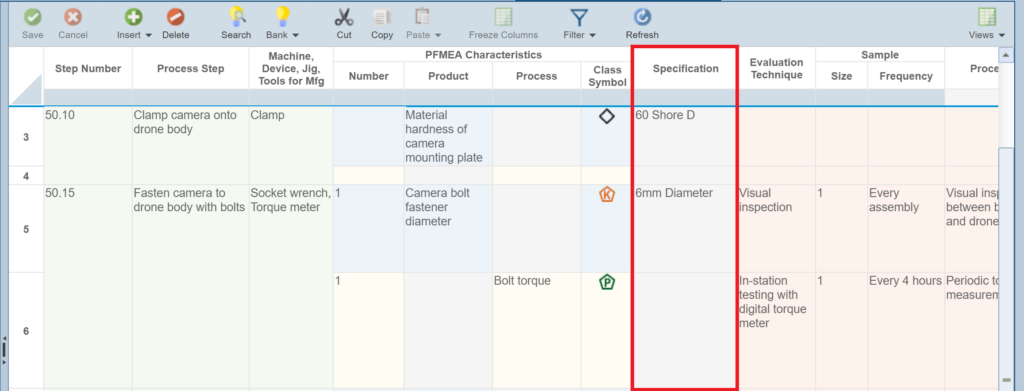
Use the Customize feature to add custom Characteristic fields to the appropriate FMEA documents.
New Relyence ALT Calculation Capabilities
Relyence ALT (Accelerated Life Testing) provides powerful statistical analysis capabilities of accelerated test data obtained from stress testing procedures. Relyence out-of-the-box features include Best Fit analysis, a point-based Analytics Calculator, and visually appealing plots such as Acceleration Factor vs. Stress, PDF (Probability Density Function), and Reliability vs. Time with optional confidence bounds. Relyence 2023 Release 2 expands on Relyence ALT’s powerful calculation engine with a number of new calculation capabilities.
Relyence 2023 Release 2 adds four new Stress Models to Relyence ALT – General Eyring, General Log-Linear (Complex), Temperature Humidity, and Temperature Nonthermal. Additionally, Relyence ALT now allows up to 5 stresses to be defined and used in its statistical calculations. Select the Stresses you want to use from the Active Stresses dropdown menu in the Data Set Properties pane.
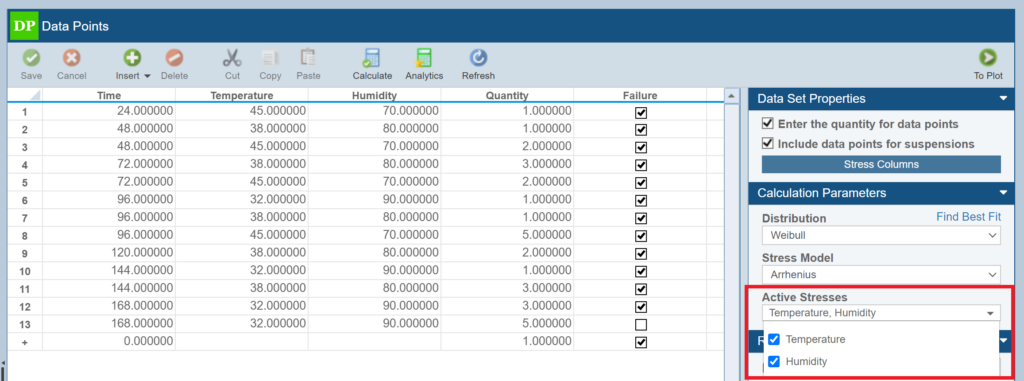
You can now choose up to 5 Stresses from the Active Stresses dropdown menu that should be used for ALT calculations.
With these powerful new capabilities included in Relyence 2023 Release 2, Relyence ALT expands on its ability to take your accelerated life stress data and analyze it for full real-world predictive analytics to predict long-term reliability metrics with minimal test time.
And more!
In addition to the exciting new products and features highlighted above, Relyence 2023 Release 2 also adds several notable enhancements to the Relyence Studio reliability and quality software tool suite, including:
- Additional Workflow date and save options
- Improved Weibull Life Data set creation from FRACAS Incident data
- New option to show Report header only on the first page of multi-page Reports
- Enhanced importing of checkbox fields from Excel
And you’ll find even more enhancements that are included in Relyence 2023 Release 2! Many of these enhancements came as requests directly from you, our customers. So please continue to reach out with your comments and suggestions. Your valuable feedback helps us to continue achieving our goal of creating the best-in-class reliability tool software package!
Use Relyence 2023 Release 2 Now!
If you are a customer of the Relyence Cloud-Hosted solution, you will see all these exciting new capabilities now! Or, if you are a customer of the Relyence On-Premise solution, you will have access to these new features as soon your installation is updated.
If you are evaluating RAMS software tools, sign up today for your completely free trial to check out our new features as well as all the capabilities of the Relyence Studio reliability and quality tool suite. No hassle, no strings, just register here and put us to the test! Or call today to speak to us about your requirements. Or schedule a personal demo at your convenience.


