
Failure Mode and Effects Analysis (FMEA) is a systematic methodology to identify potential failure modes in a system, product, or process, assess the impact of those failures, and address areas of concern. It is a proactive approach to aid in anticipating and preventing failures, resulting in improved reliability and quality. Due to its proven track record, it has widespread acceptance as a valuable engineering tool. FMEA is employed in various industries, including automotive, aerospace, consumer electronics, medical devices, manufacturing, and many more.
Conducting an FMEA begins with evaluating all possible failure modes of the item being analyzed and then determining the potential causes and effects of those failures. The next step is to assess the level of risk associated with each failure mode based on a set of established criteria. Finally, you find ways to detect, mitigate, or prevent the most critical failures. For more insight into the FMEA process, view our real-world tutorial.
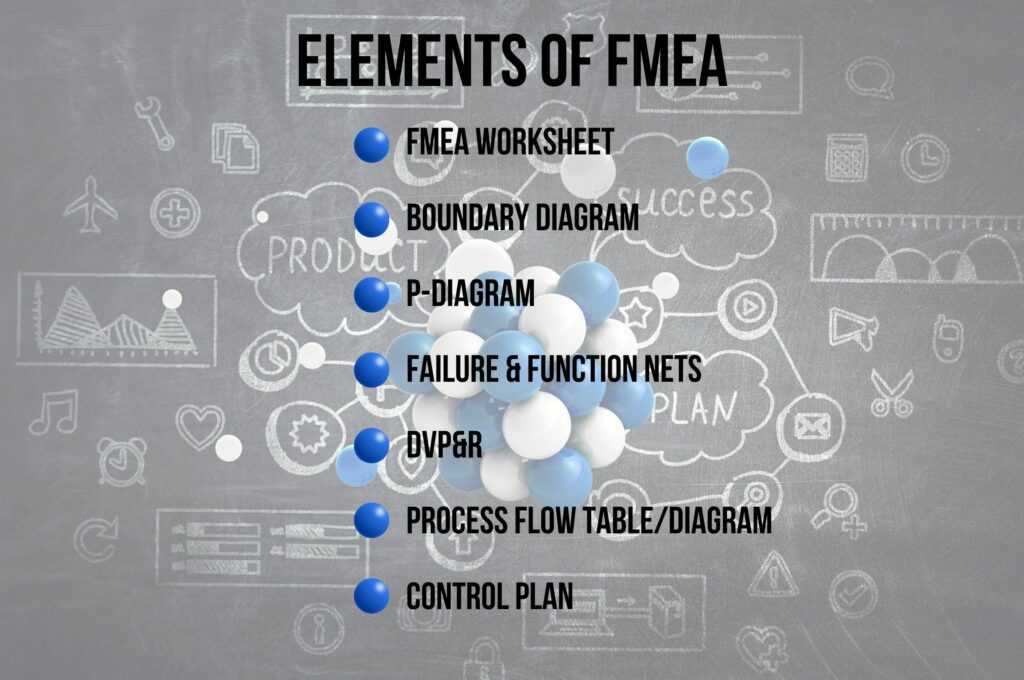
This article will highlight other analyses often performed in conjunction with the core FMEA process. These additional techniques offer a variety of advantages—enabling you to leverage your FMEA efforts for more extensive planning, ensuring your FMEA coverage is comprehensive, and providing tools for better collaboration and team communication. Read on to discover more about all the elements of the FMEA process:
- FMEA Worksheet
- Boundary Diagram
- P-Diagram
- Failure & Function Nets
- DVP&R
- Process Flow Table/Diagram
- Control Plan
FMEA Elements and Their Relationships
There are various types of FMEAs, each employing a unique analysis methodology. Additionally, established guidelines for performing FMEA—such as the AIAG & VDA FMEA Handbook, MIL-STD-1629, SAE J1739, ARP5580 and the AIAG 4th Edition—are commonly used as a starting point and can be modified to suit an organization’s needs. For this reason, FMEAs vary in their application. This customization is one of the key advantages of FMEA.
Two of the most commonly used FMEA variants are Design FMEAs (DFMEAs) and Process FMEAs (PFMEAs). DFMEAs are used to analyze and address potential failure modes of a product, typically during the design stage. PFMEAs are used to analyze and address potential failure modes of a process, such as a manufacturing process. Oftentimes, organizations will perform both DFMEAs and PFMEAs. In other cases, only one or the other is required.
The FMEA Worksheet
The essential element of the FMEA process, whether you are using DFMEA, PMEA, or any other type, is the FMEA Worksheet. The FMEA Worksheet provides a methodical approach for performing the failure analysis. The FMEA Worksheet must be comprehensive and complete. It is also helpful if the process is efficient, so that teams can work effectively, and the analyses can provide a baseline for future work. The purpose of additional elements of the FMEA process is to help ensure that the failure analysis compiled in the FMEA Worksheet meets these objectives.
DFMEA Elements
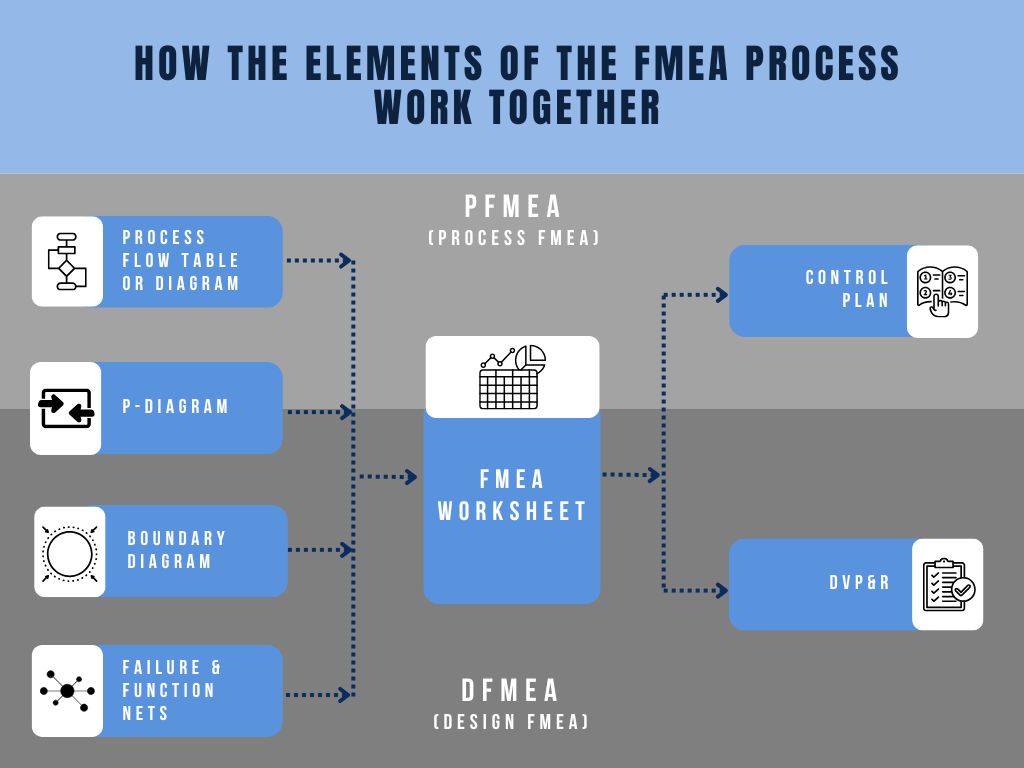
For DFMEAs, Boundary Diagrams, Parameter Diagrams (P-Diagrams), and Failure and Function Nets are best used before completing the FMEA Worksheet. These elements offer guidance to establish the scope of the analysis, clarify the influence of external factors on the system, and enable teams to understand the interactions between system components.
Boundary Diagrams are used to delineate the system’s physical and functional boundaries. P-Diagrams aid in documenting inputs and intended outputs for the design, along with unintended outputs, noise factors, and control factors. Failure and Function Nets clarify the relationships between different aspects of a system. All of these useful elements allow you to obtain a holistic view of the system to ensure the analysis considers all facets that can contribute to potential failures.
After the DFMEA Worksheet is completed, the Design Verification Plan & Report (DVP&R) provides the team with a structured way to ensure that all design specifications are achieved. The FMEA Worksheet provides an excellent starting point for the DVP&R.
PFMEA Elements
For PFMEAs, the Process Flow Table (PFT), Process Flow Diagram (PFD), and P-Diagrams are usually developed prior to PFMEA Worksheet completion. The PFT and PFD describe the process under analysis in a step-by-step format. The PFT offers a tabular view and the PFD provides a graphical view. By delineating all the steps of the process before full failure analysis, the PFT and PFD ensure that the entire process is known and that all team members understand the details of the process under review. The PFT and PFD can also be the starting points for defining the Product and Process Characteristics that flow through the rest of the PFMEA elements. P-Diagrams are also used in PFMEAs, typically at the start of analysis, just like in DFMEAs. They are a useful tool used to determine and document inputs and intended outputs for the process under review, along with unintended outputs, noise factors, and control factors.
Similar to DVP&R, the Control Plan (CP) is often completed after the PFMEA Worksheet. The PFMEA Worksheet provides an excellent starting point for compiling the Control Plan. The Control Plan describes the procedures to follow to ensure the process meets quality and performance requirements.
Elements of the FMEA Process
As noted earlier, the core element of the FMEA methodology is the FMEA Worksheet. The additional elements support FMEA in various ways. It is up to your team to determine which of the other documents you utilize depending on your own preferences and external requirements.
What is the FMEA Worksheet?
The FMEA Worksheet, the central FMEA document, provides a structured approach to identifying potential failures, their effects on the system, possible causes, and assessing their risk. Once the risk level is determined, the FMEA Worksheet is used to help track mitigation strategies, their implementation, and their level of success. In many cases, the FMEA Worksheet is the only element employed in the failure analysis process, and is enough to achieve the benefits associated with FMEAs.
Using the FMEA Worksheet, teams can proactively address potential issues before they occur. This preemptive failure mitigation offers improved reliability, enhanced safety, and reduced costs.
Data in the FMEA Worksheet
The FMEA Worksheet is typically a series of columns of data with a similar feel to a spreadsheet. The Worksheet configuration depends on the type of FMEA you are performing and your specific desires or requirements. Data fields found on a majority of FMEA Worksheets include:
- Function or Step: For DFMEAs, the focus Function of the item under analysis; for PFMEAs, the process Step being evaluated.
- Failure Mode: Ways in which the Function or Step could fail.
- Effects of Failure: The impact of the potential failure.
- Causes of Failure: The reasons why the potential failure may occur.
- Risk Categorization: An assessment of the risk associated with the potential failure. Not all risks are equal— some are much more catastrophic than others, and some may be deemed tolerable or acceptable. By categorizing the risk of each failure, the team can ensure that efforts are directed at addressing the failures that have the most impact on system reliability. Data fields commonly used to assess risk are:
- Severity: The seriousness of the effect of the failure.
- Occurrence: The likelihood of the failure happening.
- Detection: The ability to detect the failure before it occurs.
- Risk Value: RPN (Risk Priority Number) or AP (Action Priority) are commonly used and are determined based on a combination of the Severity, Occurrence, and Detection values.
- Controls: The mechanisms in place to prevent (Prevention Controls) or detect (Detection Controls) the potential failure.
- Characteristics: The specific features or attributes of a process (Process Characteristics) or product (Product Characteristics) critical to its function or performance.
- Action-related: A group of data fields related to the implementation of risk mitigation tasks. These fields may include data like the Recommended Action, Task Assignment, and Due Dates.
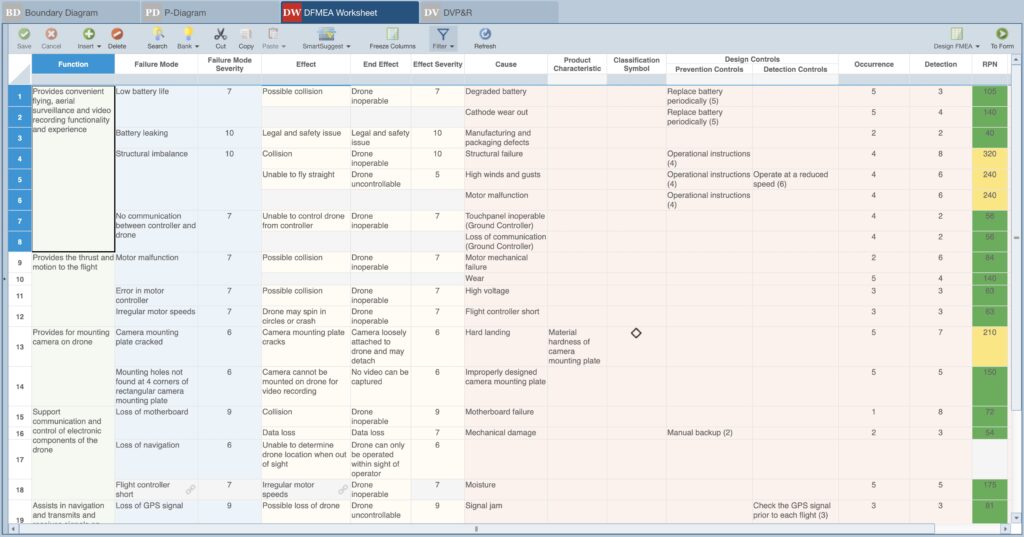
Example Design FMEA Worksheet
What is a Boundary Diagram?
A Boundary Diagram is a visual representation that outlines a system or process’s physical and functional boundaries. It helps to clarify the scope of the FMEA by identifying the system and its interfaces, which is key for understanding where potential failures may occur.
The purpose of a Boundary Diagram is threefold:
- Communication: The diagram helps the FMEA team understand the system structure and interfaces.
- Focus: The development of the Boundary Diagram enables the team to determine the most relevant parts of the system in order to focus analysis efforts.
- Failure Identification: The Boundary Diagram helps to identify potential failures that may occur at interfaces between system components and external influences, which is not as easy to determine with a simple component list.
Boundary Diagrams provide a visual representation of the components of a system, including the interfaces between components and external factors, such as environmental effects and human interactions. A Boundary Diagram works to improve understanding of the system by providing a graphical diagram of its interactions with internal and external elements. Boundary Diagrams can be helpful as an upfront brainstorming tool to help ensure all appropriate factors are considered.
The Boundary Diagram helps ensure that the FMEA covers all relevant aspects of the system, reducing the risk of overlooking critical components or interactions and preventing scope creep. Once built, the Boundary Diagram provides a clear visual overview, making it easier to understand complex systems. Boundary Diagrams are powerful tools to help better understand the design at a high level before the more detailed design analysis begins.
Data in a Boundary Diagram
A Boundary Diagram consists of the following:
- Boundaries: The diagram outlines the system’s overall boundary and the boundaries of its subsystems, clearly showing which parts are included in the analysis.
- System Components: Parts, assemblies, or subsystems that are part of the system being analyzed.
- Interfaces: Connections between system components or with external factors.
- External Factors: Outside factors that may impact the system, including Environmental Factors like temperature, humidity, or vibration. Understanding the external interfaces is key for assessing factors that might lead to failures.
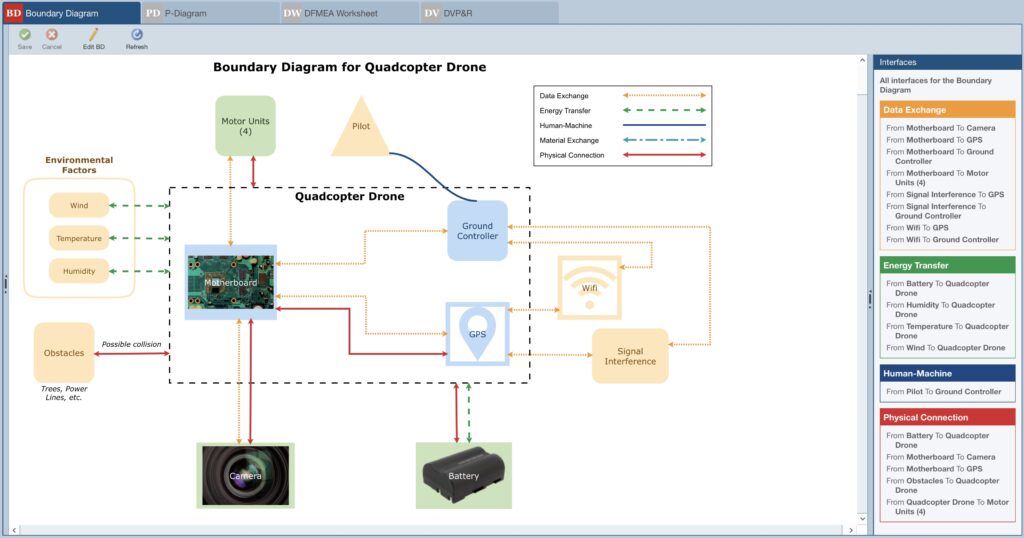
Example Boundary Diagram
What is a Parameter Diagram (P-Diagram)?
The P-Diagram is used to understand the inputs and outputs of a product or process, as well as the noise factors that can affect performance. It can help in identifying potential failures and related details like prevention controls.
Often, P-Diagrams are used as the first step of the FMEA process to provide an upfront assessment to ensure that your required design outputs are met considering all inputs. They can be especially helpful when analyzing complex products or processes with many interactions and specific requirements. Because P-Diagrams provide a high-level visual overview, they can aid in understanding the overall system and the interactions of various factors influencing successful operation. The P-Diagram aids in identifying and analyzing the effects of different factors on the system’s performance, enabling teams to develop robust designs and processes that are less sensitive to outside influences.
Data in a P-Diagram
Data in a P-Diagram includes:
- Input Signals: Variables or parameters the system or process receives to perform its function.
- Output Responses: Desired outcomes, or system or process performance metrics.
- Noise Factors: External or internal variables that can cause variation in the system’s output, such as temperature changes or manufacturing inconsistencies.
- Control Factors: Elements that can be adjusted to control the system’s performance, or ways to offset any Noise Factors.
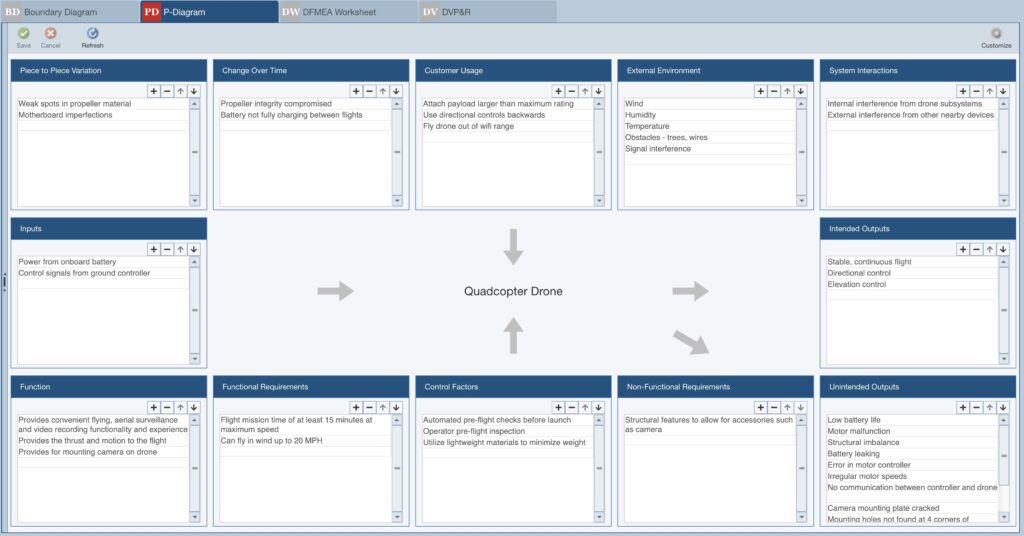
Example P-Diagram
What are Failure and Function Nets?
Both Failure and Function Nets provide a graphical representation to clarify the relationships between different aspects of a product or system. Failure and Function Net diagrams consist of:
- Nodes: Nodes are the blocks in the diagram.
- Connections: Connections are the lines between nodes.
What is a Failure Net?
A Failure Net illustrates the relationships between different failure modes and their effects across various levels of a system. Constructing a Failure Net helps teams understand the interdependence between failure modes, empowering them to identify common causes or cascading effects that could impact multiple parts of the system. This enhanced understanding makes it easier to analyze failure propagation and identify critical failure paths that may not be as obvious in a traditional, linear FMEA Worksheet. Using a Failure Net to identify which failure causes or modes have the greatest downstream impact, you can prioritize mitigation efforts to be as beneficial as possible.
In Failure Nets, the nodes represent failure modes, causes, or effects. The connections represent the cause-and-effect relationships between the items delineated by the nodes.
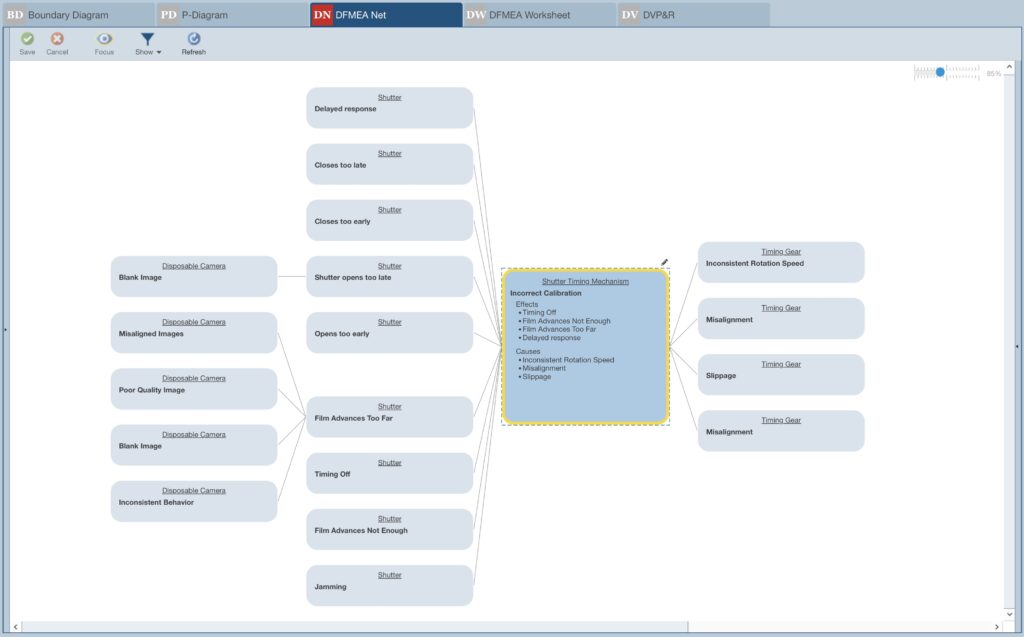
Example Failure Net
What is a Function Net?
A Function Net is a way to visually and logically represent the relationships between the functions of a system. It maps out how the system’s functions interconnect and depend on one another, allowing for a clearer understanding of the overall system construction and its potential vulnerabilities. Function Nets offer a structured way to explore and analyze the interplay between system functions and can help uncover design weaknesses and opportunities for improvement. By helping to identify how the failure of one function can affect others, Function Nets aid in highlighting critical functions that could lead to significant issues upon failure. Constructing a Function Net also helps to identify the various failure modes, causes, and effects of a system.
In Function Nets, the nodes represent individual functions or operations. The connections indicate how functions interact or depend on each other.
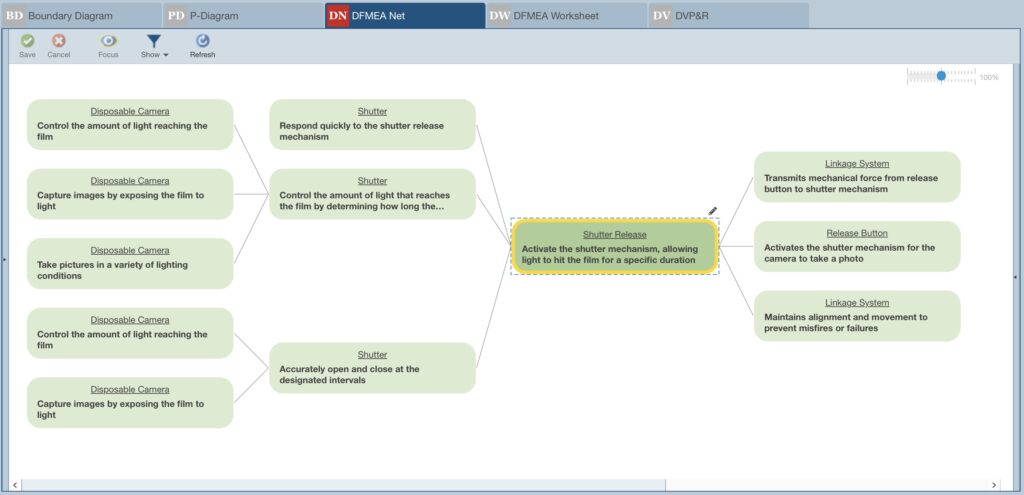
Example Function Net
What is a Design Verification Plan & Report (DVP&R)?
The DVP&R defines the test plans used to verify that a design meets its requirements and specifications. The DVP&R document also ensures that all critical aspects of the design are thoroughly tested and validated, reducing the likelihood of failures during production or use.
Design specifications or product requirements are listed in the DVP&R document along with the tests used to verify that they have been met – the Plan portion of the DVP&R. Once the tests are performed, the results are recorded in the Report portion of the DVP&R. You can log pass and fail testing and keep track of progress and issues that may arise.
The DVP&R is a tool that ensures you have an organized approach to product design validation, provides feedback to know how well design verification tests are progressing, and maintains all this information in a central place for efficiency and future design iterations.
Data in a DVP&R
Data in the DVP&R document includes:
- Requirement: The requirement that must be met for a test to be successful.
- Test Number/Name/Description: Identifying information about the test to be performed, such as a number, name, and description of the test procedure.
- Acceptance Criteria: The criteria which must be met for the test to pass.
- Verification Report: The actual outcomes of the test and whether the acceptance criteria were met. This may also include information on the test findings and who completed the test.
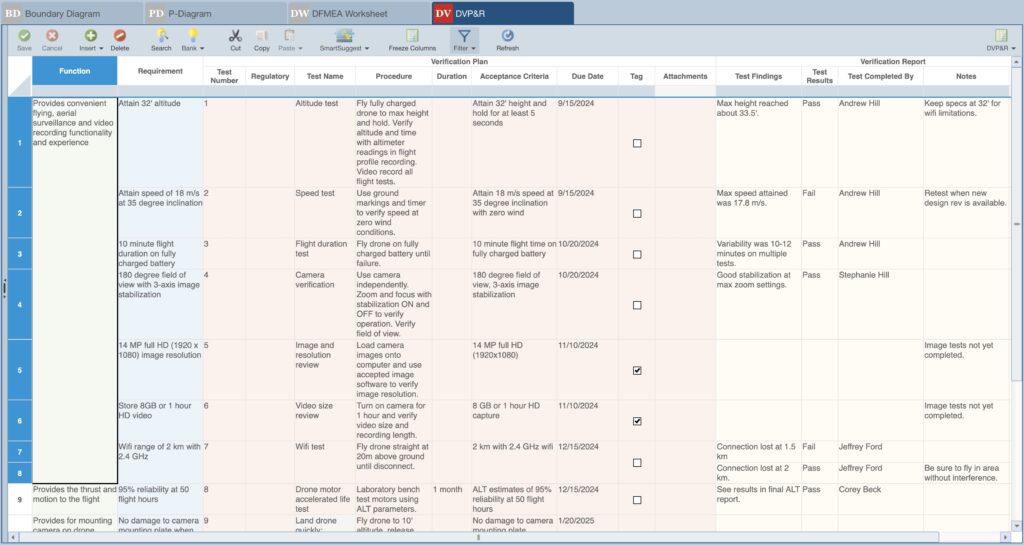
Example DVP&R Worksheet
What is a Process Flow Table (PFT)?
A Process Flow Table is a tabular representation that delineates the sequential steps of a process, such as a manufacturing or assembly line process. By helping to examine the entire process, the PFT aids teams in analyzing where failures might occur and assessing their potential effects on the process. The PFT makes identifying potential failure points easier and ensures that all steps are accounted for in your PFMEA.
Data in a PFT
Data in the PFT often includes:
- Step Number: A numerical value to indicate the order of the step in the overall process.
- Process Step: A description of the process step.
- Symbol: Symbols are commonly used to indicate the type of procedure being performed in the process step, such as Move, Store/Retrieve, Fabricate, Inspection, Rework.
- Characteristics: The specific features or attributes of a process (Process Characteristics) or product (Product Characteristics) that are critical to its function or performance. Product Characteristics can be thought of as the output of a particular Process Step, such as the diameter of a drilled hole. Failure to meet the output would be defined as Failure Modes for the Process Step, such as Diameter is too large and Diameter is too small. Process Characteristics are the inputs that influence the Product Characteristics, such as drill speed. Variations in drill speed could be defined as failure Causes for the Failure Modes, such as Drill speed too fast or Drill speed too slow.
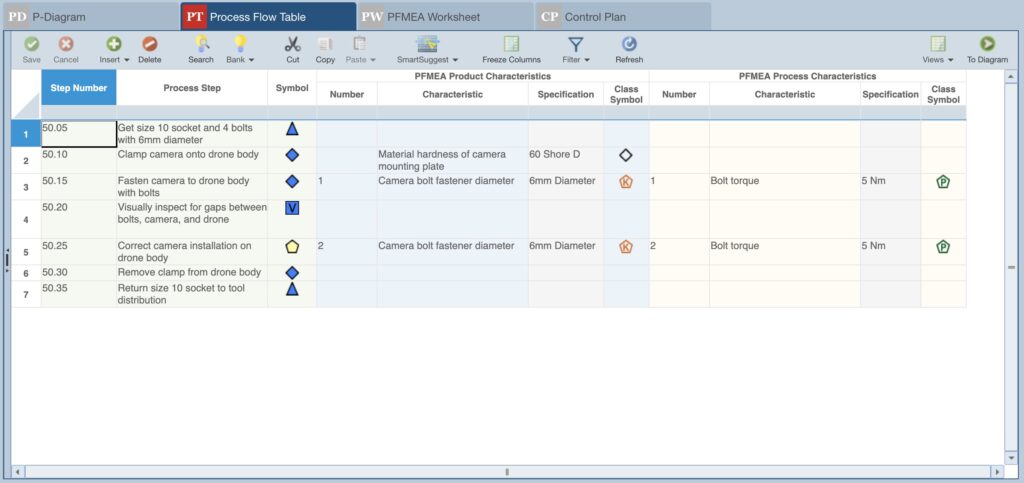
Example Process Flow Table (PFT)
What is a Process Flow Diagram (PFD)?
A Process Flow Diagram, as indicated in the name, is a diagram, or visual view of a process. It is a complement to the PFT. The Process Flow Diagram includes the same information as the Process Flow Table, but in graphical format instead of a tabular view. The PFD is a flowchart, or flowsheet, and typically has a start node and an end node, as well as interim blocks that indicate the process steps. The symbols used in a PFD are helpful to indicate the type of action performed in the process step.
This graphical view allows the overall process to be easily understood and is therefore helpful in team communication and presentation.
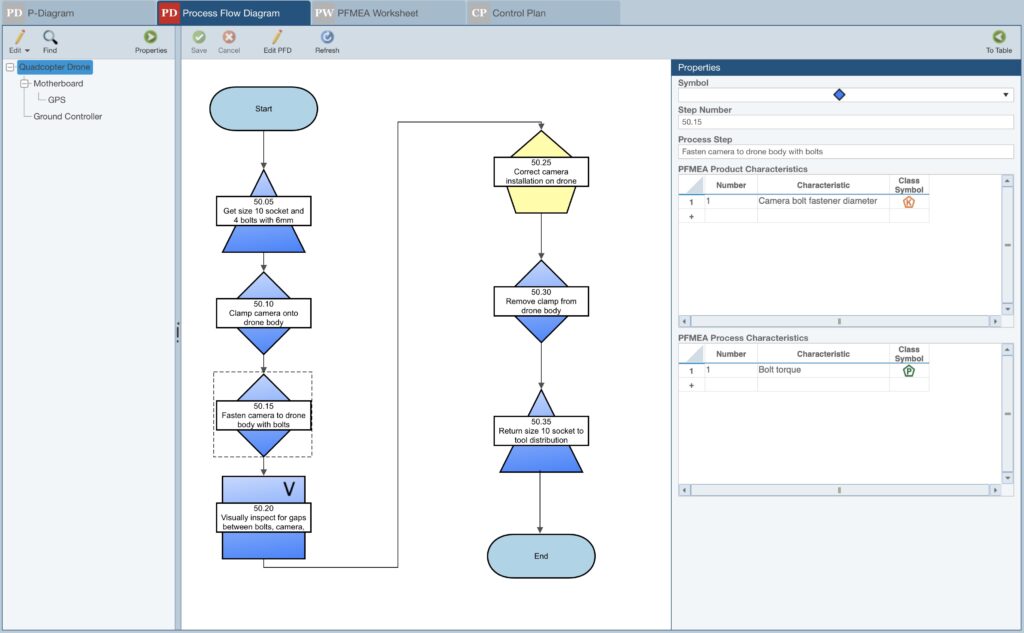
Example Process Flow Diagram (PFD)
What is a Control Plan (CP)?
A Control Plan outlines the methods and procedures for controlling and monitoring process or product characteristics to ensure they meet quality and performance requirements. The purpose of developing a Control Plan is to prevent, detect, and respond to failure modes identified during the FMEA process and ultimately outline steps and actions needed to ensure the quality of the process and product. It is designed to ensure consistency and reliability during a production process. It also helps maintain process stability and product quality by ensuring that all critical process parameters are controlled and monitored effectively.
Also sometimes referred to as a PCP (Process Control Plan), the Control Plan provides an organized, detailed procedure for documenting all the controls put in place to ensure quality control in your processes. Ultimately, the CP can also be used to create operator instructions.
Data in a Control Plan
Key data commonly in a Control Plan includes:
- Process Steps: The specific steps in the process; similar (if not identical) to steps outlined on the Process Flow Table or Diagram.
- Measurement Tools: The tools and equipment used for measurements and inspections.
- Key Characteristics: Identifies the critical characteristics that need to be monitored to ensure the process or product meets its specifications.
- Specification/Tolerance: Defines the acceptable range for the process or product characteristics when applicable.
- Sampling Frequency and Size: Indicates how often the characteristic will be checked (e.g., every hour, per batch) and how large of a sample will be used.
- Control Method: Describes the methods used to monitor and control each process step, including the tools or techniques used (e.g., inspections, tests, gauges).
- Reaction Plan: Specifies the actions to be taken if the characteristic falls outside the specified limits or if a failure is detected.
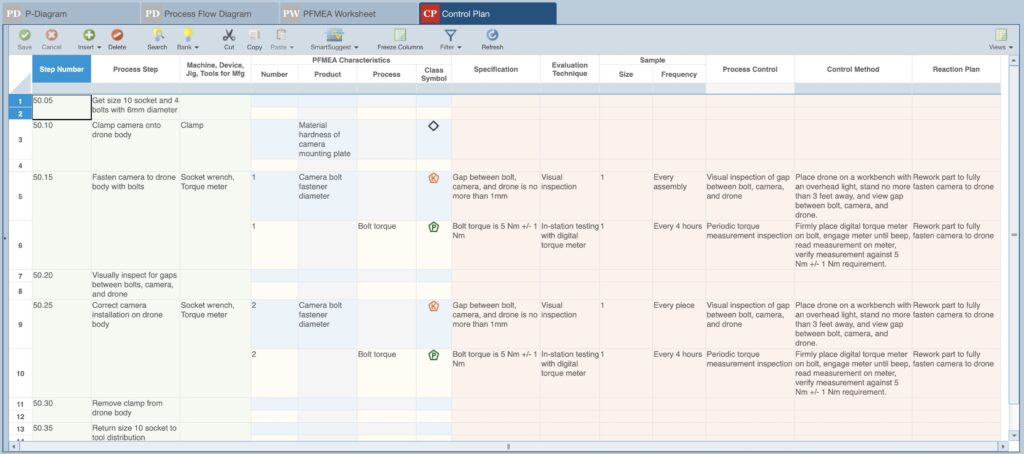
Example Control Plan (CP)
Learn More
FMEA is a comprehensive process that can involve a number of different elements. While the FMEA Worksheet is the essential element of a Failure Mode and Effect Analysis, all other components contribute to making sure that the analysis is complete and comprehensive. In some cases, the added elements, such as Boundary Diagrams and P-Diagrams, aid in the upfront assessment of the system at a high level. They can be especially useful in a collaborative, team-based approach at the start of failure analysis to establish overall objectives. In other cases, the additional elements, such as Control Plans and DVP&Rs, aid in formulating a plan for product maintenance and control after the FMEA Worksheet is complete and the product is in production or process is implemented.
All elements of the FMEA process are intended to help teams systematically assess and manage risks. By leveraging these tools, you can ensure that your analyses are effective and comprehensive and gain the most from your FMEA efforts.
The benefits of FMEA are well established, which is why so many engineers use this methodology across a broad spectrum of industries. FMEA’s proven track record of helping organizations enhance product reliability, ensure process quality, improve safety, and meet performance goals makes it a key element of a robust reliability and quality tool set.
At Relyence, we offer a best-in-class FMEA solution incorporating all the elements described in this article. Our website offers a wealth of information, including an array of informative articles on FMEA. Additionally, you are welcome to give Relyence FMEA a free test run, schedule a personalized tour, or contact us to learn more.