What is Fault Tree Analysis?
Fault Tree Analysis is a systematic approach used in the engineering field for risk assessment and management. Sometimes abbreviated as FTA, Fault Tree Analysis is used to determine the probability that an unwanted event will occur. The unwanted, or top-level, event is typically some type of failure of a product, system, or process. The undesired events can be major, life-threatening incidents, such as the crash of an airliner; other critical events, such as an explosion or fire; or less crucial failures, such as losing network connectivity.
An FTA diagram is constructed by starting with the identified unwanted event and then delineating all possible causes and pathways that could lead to the occurrence of that event. FTA then analyzes the probability of the undesirable event using Boolean logic principles. If the probability does not meet the organization’s goals or requirements, then the Fault Tree can be used to develop potential mitigation measures or design changes to reduce the likelihood of occurrence. FTA can also help identify weak points in a design through various techniques, such as highlighting high-probability failure paths or single cause failure points. This enables engineers to intelligently target areas for potential improvement.
Overall, Fault Tree Analysis offers a methodical, analytical approach for evaluating and mitigating risk and safety issues in complex systems. FTA is a valuable tool to ensure systems are reliable, safe, and meet regulatory or internal compliance requirements.
What are the Benefits of Fault Tree Analysis?
Whenever there is a need for high-level risk assessment, or for the evaluation of events leading to mission critical or catastrophic failures, Fault Tree Analysis is the tool of choice. With its focus on using known failure events and Boolean logic to determine the probability of a system failure, an FTA provides valuable metrics unavailable with other qualitative tools.
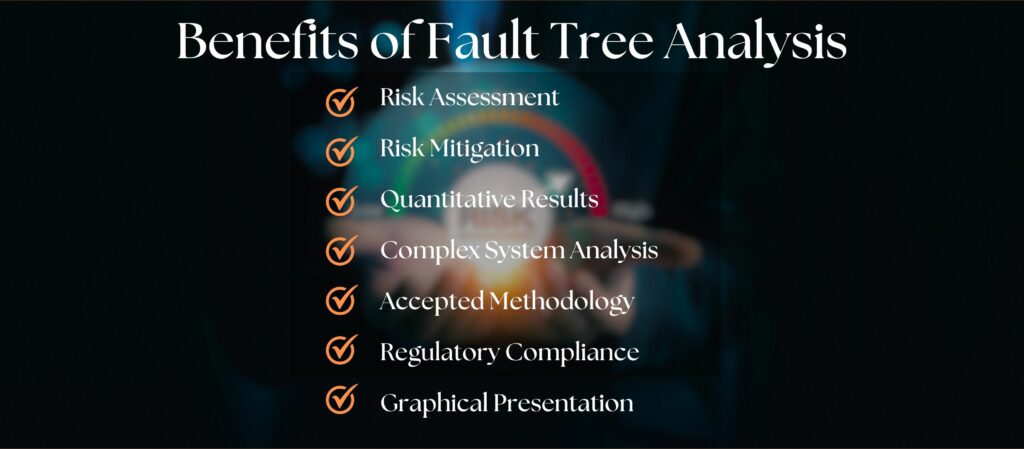
Some of the key benefits of FTA include:
- Risk Assessment: The core objective of FTA is risk assessment. Fault Tree Analysis begins with defining a high-risk event and then identifying all the possible ways that event could occur. The resulting Fault Tree then allows you to assess the probability of the top event’s occurrence and the various combinations of events and critical paths that can lead to it. This information is vital to determine strategies for eliminating or mitigating risk.
- Risk Mitigation: Fault Trees aid in risk mitigation planning. If Fault Tree Analysis is done in the early design stage, it can help identify high probability failure events or failure paths. Those insights can be used for investigating redesign options. If used during post-design timeframe, FTA can be utilized to uncover problematic areas as part of Root Cause Analysis (RCA) or other similar processes.
- Quantitative Results: FTA offers a metrics-based approach to risk analysis. Once event probabilities are defined, the Fault Tree calculation engine uses Boolean algebraic techniques to determine the probability of occurrence of the top-level event, the probability of intermediate events, and the probability of the paths leading to the top event. Quantitative results allow engineers to make informed decisions for design improvement and risk mitigation efforts.
- Complex System Analysis: Fault Tree Analysis excels at handling risk analysis of large, complex systems. By breaking down the events and paths into separate branches, analysts can focus on one area at a time and delve as deep as required.
- Accepted Methodology: First developed in the 1960s for use in the defense sector, Fault Tree methodology now has widespread acceptance in reliability and safety engineering and is used across a broad range of industries including aerospace, nuclear power, energy, and healthcare.
- Regulatory Compliance: In some industries, especially those with strict safety requirements such as nuclear power and aerospace, FTA is used to show that compliance requirements are achieved.
- Graphical Presentation: Fault Tree Analysis employs a unique visual representation using logic gates to define system failures, their causes, and associations. This graphical view helps explain complex systems in an easy-to-understand format.
In summation, Fault Tree Analysis provides a solid foundation for risk analysis and management, enabling businesses to ensure their systems are reliable and safe.
What Industries Use Fault Tree Analysis?
Fault Tree Analysis is used in a wide range of industries to aid in quality improvement and risk reduction. Risk and safety assessment activities are vital to many businesses, especially in known high-risk areas such as nuclear power, medical, and aerospace. FTA is employed across the spectrum because it is a valuable tool to quantify the risk associated with events that can lead to system failures of any kind.
Some of the industries that rely on FTA include:
- Aerospace: In the aerospace industry, safety is paramount. The reliability and safety of aircraft directly impacts the safety of thousands of people who travel each day throughout the world. For this reason, businesses responsible for the production of aircraft—as well as those tasked with the safety, maintenance, and repair of those planes—must continually meet both regulatory and internal compliance requirements. FTA helps to ensure aircraft safety and reliability.
- Nuclear Power: Due to the high risks inherent in nuclear power generation, Fault Tree Analysis is a widely accepted methodology for helping to ensure the safe operation of nuclear power plants. FTA helps to identify high-risk events in order to implement measures to prevent catastrophic failures.
- Processing Plants: The obligations of the oil & gas industry include protecting its workers and consumers from equipment-related and human-induced failures. FTA helps the oil & gas industry keep its drilling operations, offshore rigs, pipelines, and processing plants safe and reliable. Chemical and other processing plants that are subject to high-risk failures such as explosions or harmful fires also use FTA to ensure safe operation.
- Transportation: The automotive industry performs Fault Tree Analysis to ensure vehicle reliability in critical areas such as braking, crash prevention systems, and airbag deployment. The railway industry turns to FTA to help in implementing safety measures for its operators and the public.
- Medical: Additional sectors where safety is paramount are the medical and healthcare industries. Fault tree analysis is key for ensuring safety of medical devices and implementing measures to avoid human risk factors in patient care.
Overall, in any industry where reliable and safe operation is key for business success and consumer safety, Fault Tree Analysis provides an effective and proven strategy for maintaining safety-related goals and meeting regulatory requirements.

How Do I Perform Fault Tree Analysis?
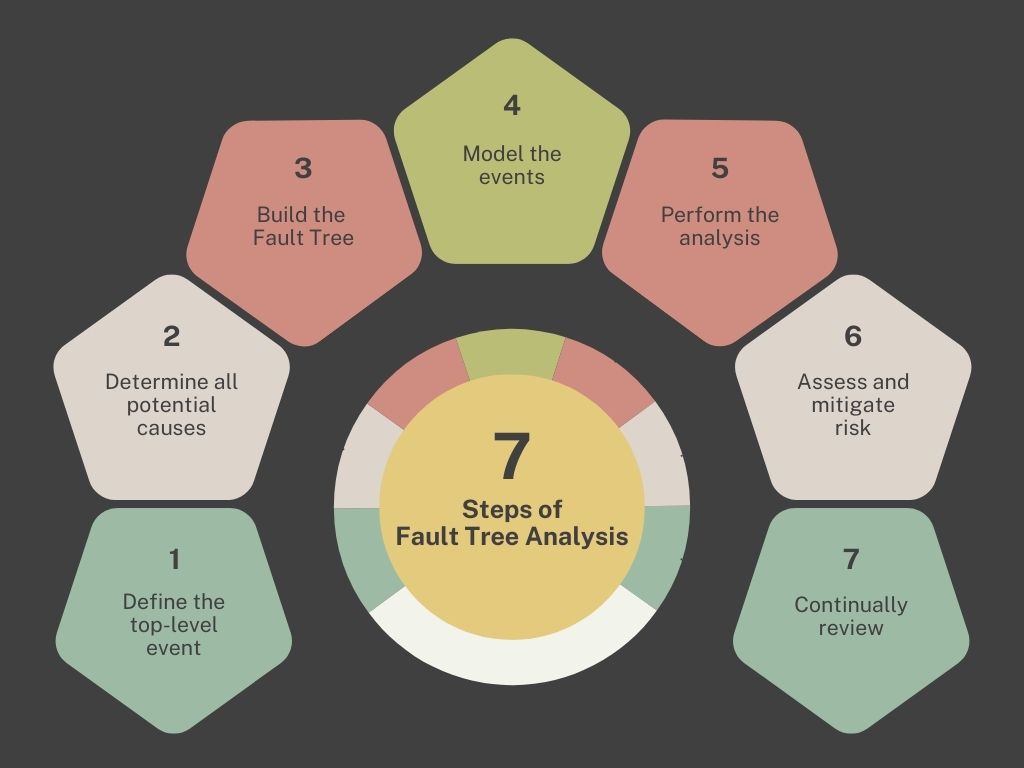
FTA is a systematic, structured process. The typical steps for conducting a Fault Tree Analysis include:
- Define the top-level event. Fault Tree Analysis is used to assess the probability of an undesired event’s occurrence, so the first step is to identify the event to be analyzed. This event could be potentially harmful or catastrophic, so the effects of its occurrence must be eliminated or mitigated, and its likelihood of occurrence must be minimized.
- Determine all potential causes. The second step requires analysis and evaluation to consider all possible events that could lead to the occurrence of the top-level event. It is helpful during this part of the process to have a diverse team that collaborates to uncover all potential problematic areas.
- Build the Fault Tree: Using a graphical format, the Fault Tree is created with the top-level event at the top of the diagram and events arranged as branches stemming from it. Logical gates, such as AND and OR gates, are used to depict the relationships between events and indicate how combinations of events can lead to the top-level event.
- Model the events: To perform a quantitative analysis, the events of the Fault Tree are modeled to define their behavior. For example, some events may be assigned a constant value that indicates the probability of failure occurring. Modeling events can be as sophisticated as required to properly define each event’s likelihood of occurrence. For example, input models may use statistical distributions such as Normal and Lognormal, as well as metrics such as Constant Probability and Failure Rate.
- Perform the analysis: Analysis of the Fault Tree is typically performed using a software tool with a built-in mathematical engine that employs Boolean logic techniques to assess the probabilities of the events and paths leading to the top-level event. The overall probability of the top-level event can then be determined, as well as the likelihood of all contributing factors.
- Assess and mitigate risk: Once analysis is complete, the results are used to determine if the probability of occurrence is within acceptable limits. If not, then the critical paths and/or events that are candidates for risk reduction efforts are identified. The steps for risk mitigation are outlined and then assigned to appropriate team members for implementation.
- Continually review. Once risk mitigation efforts are complete, the system is reviewed again to ensure that safety requirements are met. Continuous review and updates to the Fault Tree should be performed as changes to the system occur to ensure the overall system remains within risk tolerance levels.
Fault Tree Analysis provides a well-structured approach to risk management. It enables analysts to focus on specific high-risk events and thoroughly evaluate all potential ways that an event could occur. By providing metrics-based results, analysts can use the resulting probabilities of occurrence to provide a targeted approach for risk reduction efforts. Therefore, FTA not only enables analysts to ensure systems meet safety objectives, but it also allows for the most effective risk reduction.
Example Fault Tree Analysis
While most Fault Tree Analyses are used to evaluate high-risk or catastrophic events, for our example, we’ll use a simple case to illustrate the basics of performing FTA.
Step 1: Define the top-level event
For this example, our top-level event will be the failure to heat a house.
Step 2: Determine all potential causes
In this case, if the house is not heating, we determine that are three possible problems: an issue with the thermostat, a power-related issue, or an air flow problem. We then develop each of these problem areas further.
If there is an issue with the thermostat, it could be simply that the thermostat has failed. However, in our case, we have a programmable thermostat, so the issue could be with the programming.
A problem with power could be due to several different issues. First, the furnace could simply have experienced a failure and is unable to operate. Or, because we have a gas furnace, the pilot light could be out. In another situation, our furnace is operational, but there is no power to it. For our gas furnace, this could happen if the gas supply is out, or a fuse was blown.
For air flow issues, we can point to problems with the air ducts: there is a blockage, or the ductwork is not properly connected to direct airflow as expected.
Step 3: Build the Fault Tree
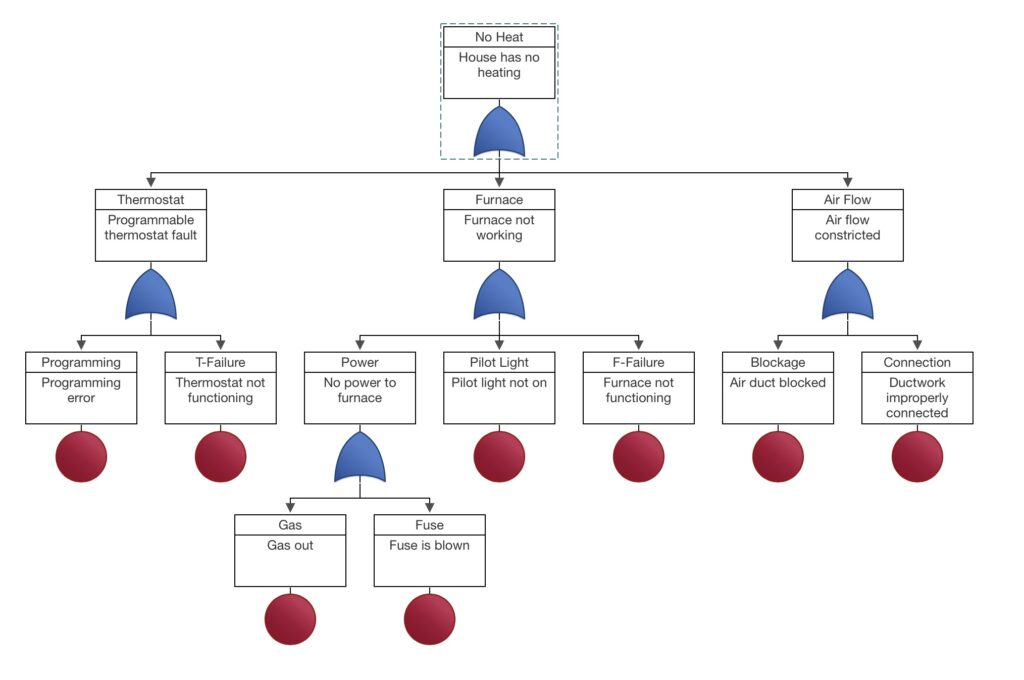
To summarize, our Fault Tree has the following components:
Top-level Event:
- House has no heating
Intermediate Level Events:
- Programmable thermostat fault
- Furnace not working
- No power to furnace
- Air flow constricted
Basic Events:
- Programmable thermostat fault
- Programming error
- Thermostat not functioning
- Furnace not working
- No power to furnace
- Gas out
- Fuse is blown
- Pilot light not on
- Furnace not functioning
- No power to furnace
- Air flow constricted
- Air duct blocked
- Ductwork improperly connected
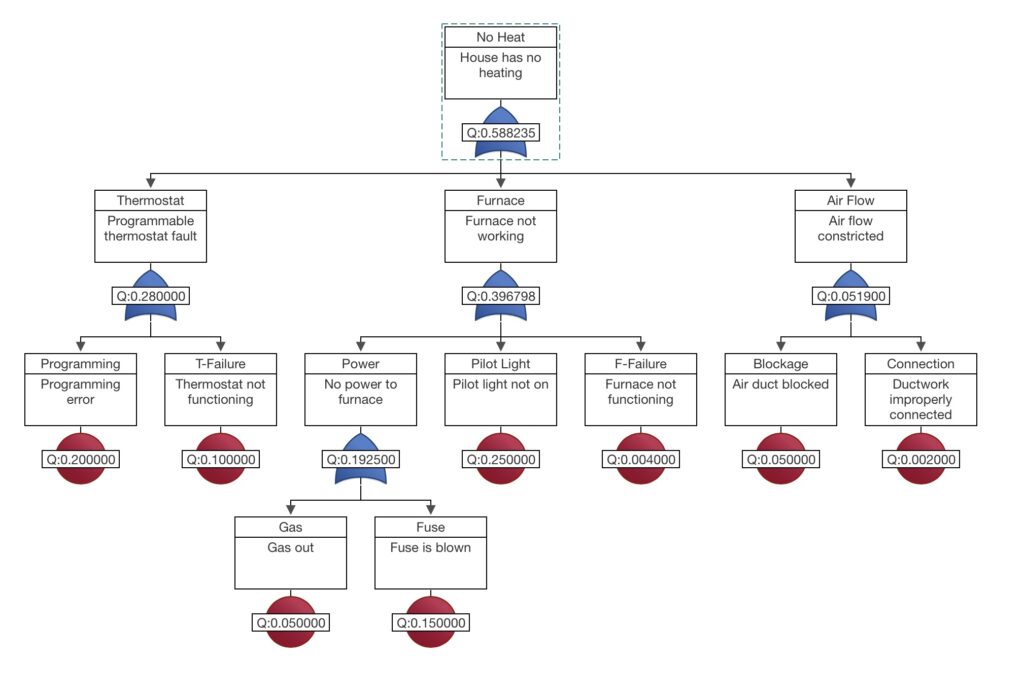
In this case, all paths leading to our top-level event are independent events and do not need to happen in combination to produce the problem. Therefore, our Fault Tree will consist of OR gates. Our resulting Fault Tree looks like this:
Step 4: Model the events
Typically, modeling events can take time in order to perform a detailed analysis to define the most appropriate way to model their behavior. To keep our example simple, we’ll assign constant probabilities of occurrence to all our basic events.
We’ll assign the following probabilities to our Fault Tree events:
- Programming error: 0.2
- Thermostat not functioning: 0.1
- Gas out: 0.05
- Fuse is blown: 0.15
- Pilot light not on: 0.25
- Furnace not functioning: 0.004
- Air duct blocked: 0.05
- Ductwork improperly connected: 0.002
Step 5: Perform the analysis
Using Relyence Fault Tree, we’ll perform a calculation. The unavailability—or probability of occurrence in this example—results for each Gate and Event of the FTA are displayed on the Fault Tree diagram:
Step 6: Assess and mitigate risk
From our simple FTA, we can see that the most likely reason for a heating failure is due to a furnace-related issue. Delving further into that path, we can see that a problem with the pilot light has the highest probability of occurrence. In this case, perhaps we want to consider replacing the current pilot light with something more reliable, or perhaps we could decide to develop a way to add an indicator so the operator can be notified or easily see that the pilot light has gone out.
Step 7: Continually review
We can continue to reassess our analysis in the future. Perhaps we uncover additional causes of failure or determine better ways to model our events for more accurate results.
Advanced Fault Tree Analysis Techniques
Fault Tree software tools can also provide support for other features to aid in accurate risk modeling. Some of these helpful capabilities include:
- Unique Logic Conditions. Beyond the basic AND or OR gates, Fault Trees can incorporate a variety of gates and events, such as NAND, NOR, NOT, Priority AND, Voting, Exclusive OR, and Inhibit gates for comprehensive modeling.
- Repeat Events. Repeat events allow you to model the same exact event in multiple branches of your tree.
- Common Cause Failures (CCF). CCF events are simultaneous failures of components due to a common cause.
- Disjoint Events. Disjoint events are events that cannot happen at the same time. For example, a resistor cannot fail open and shorted simultaneously. In this case, if one event occurs, the probability of the other event occurring is zero.
- Monitors. Monitors are methods which detect a latent failure, or a failure that is not detected upon its occurrence. Monitors are typically used when performing SAE ARP 4761 and SAE 4754A based Fault Tree Analyses.
- Cut Sets. A cut set is a collection of basic events that lead to the top-level event if they all occur. Oftentimes, Minimal Cut Sets (MCS) are used in FTAs. MCS refers to the smallest collection of events which occur to cause the top-level event.
- Importance Measures. Importance measures are metrics that can be calculated to identify events that would result in the best improvement in system safety when their probability of occurrence is lowered.
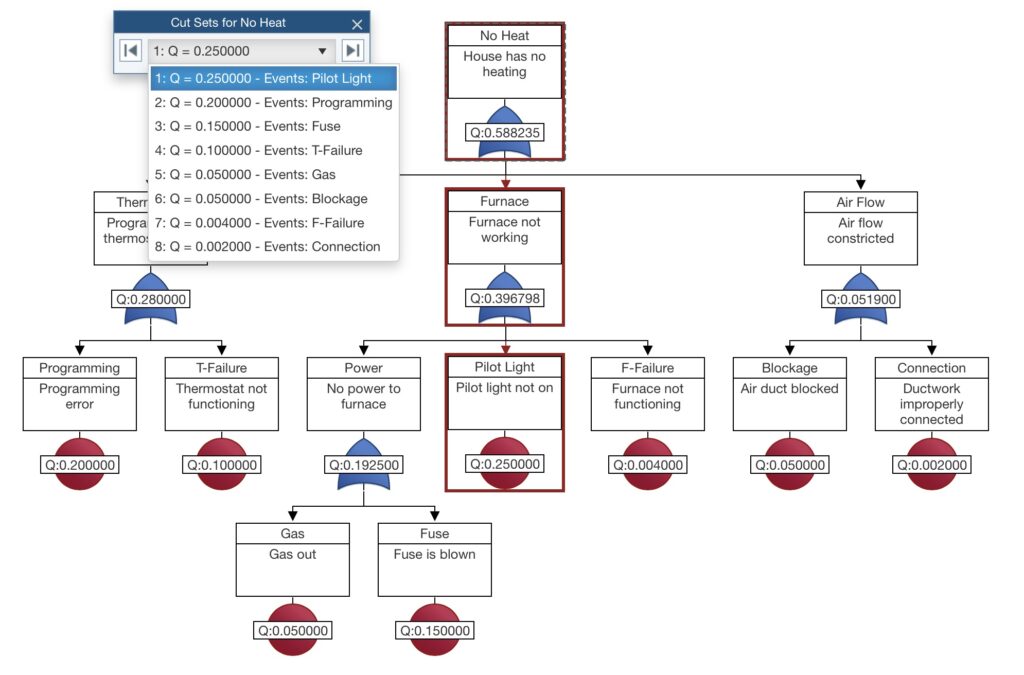
A cut set is a collection of basic events that lead to the top-level event. In Relyence Fault Tree, you can easily view cut sets and sequence through them.
What Should I Look for in a Fault Tree Analysis Software Tool?
Engineers turn to Fault Tree software tools in order to perform accurate and robust analyses. There are key features to look for in a best-in-class software solution.
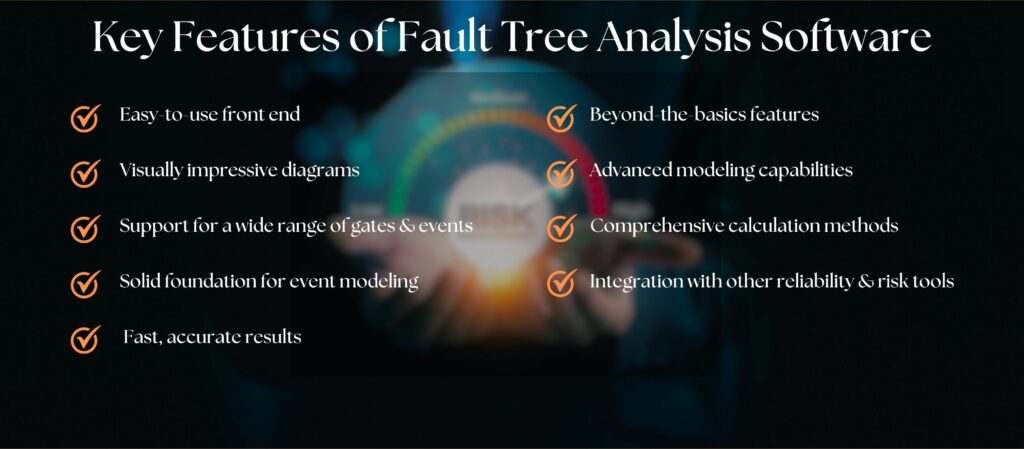
- Easy-to-use front end. The front-end diagramming function must be easy to navigate and result in well-organized and optimally configured trees. Automated abilities, such as optimizing layout and auto-connection, are desirable. Additionally, features that aid in handling large trees—such as support for transfer gates and linked sub-trees—are critical.
- Visually impressive diagrams. A significant feature of FTAs is their graphical format. Unlike other heavily textual and numerical based tools, Fault Trees are impactful due to their easy-to-grasp graphical presentation. A clean, visually impressive front end that incorporates color and a streamlined look produces results that are easy to comprehend and are helpful for the purposes of presentation and explanation. A nice visual interface is not just pleasant to use, it offers a unique opportunity to effectively communicate system complexities across the organization.
- Support for a wide range of gates and events. Because FTA software can serve as a vital tool in risk assessment and mitigation, the ability to model real-world scenarios is important. This means that a variety of logic gates and events must be supported.
- Solid foundation for event modeling. To produce accurate results, it is imperative that the events delineated in the Fault Tree can be modeled to represent their real-world behavior. This means an extensive list of input event models to choose from is critical.
- Fast, accurate results. As noted, Fault Trees can become large and complex. This complexity not only needs to be handled well to produce accurate results, but also to perform calculations with speed and efficiency. Additionally, an array of output results, such as unavailability, failure frequency, number of failures, and minimal cut set (MCS) evaluation, should be supported.
- Beyond-the-basics features. In addition to performing the basic analyses for risk assessment, a Fault Tree software tool should include features to streamline your analyses and enhance your work. This includes features such as event and Fault Tree libraries which encapsulate data for easy reusability and consistency, Dashboards for aggregating information into a high-level overview for quick assessment, complete reporting capabilities that enable you to produce comprehensive and well-formatted reports, a browser-based interface for ultimate flexibility, and installation options that enable you to configure the tool to your needs.
- Advanced modeling capabilities. More advanced capabilities, such as CCF (Common Cause Failure) groups and disjoint events, are beneficial when constructing complex Fault Trees.
- Comprehensive calculation methods. In addition to supporting an exact, or analytical, calculation method, the mathematical engine must be able to support simulation to handle complex scenarios where analytical results are not possible. When performing qualitative analyses, a variety of cut set approximation methods should be supported, such as cross-product, cut set summation, and Esary Proschan. Also, if your needs include support for the techniques described in the SAE ARP4754A and SAE ARP4761 standards, your Fault Tree software must support this capability.
- Integration with other reliability and risk tools. Fault Tree Analysis is one component of a complete reliability and risk management platform. It is helpful if your Fault Tree software tool integrates with other reliability and quality tools such as Failure Mode and Effects Analyses (FMEA), Reliability Prediction, and Failure Reporting, Analysis, and Corrective Action System (FRACAS). In some cases, tight integration between two of the most common risk tools, FMEA and FTA, enables you to autogenerate a Fault Tree and link important shared data.
Relyence Fault Tree
Relyence Fault Tree is the best-in-class FTA tool that melds a visually impressive, easy-to-use diagramming front end with a highly accurate and fast mathematical calculation engine. With built-in support for a wide range of gates and events, an impressive array of performance metrics, and a long list of capabilities for maximum efficiency, Relyence Fault Tree remains the tool of choice for reliability professionals across a broad spectrum of industries throughout the world.
To learn more about Relyence Fault Tree, test it with our completely free online trial or schedule a free personalized demonstration. Contact us to talk to one of our knowledgeable team members today!


