What is RBD?
RBD, or Reliability Block Diagram analysis, is a widely used methodology for evaluating critical performance metrics like the uptime, or availability, of complex systems. Engineers perform RBD analysis by creating a graphical representation of the system under evaluation using blocks and connection lines. The blocks represent system components, while the connection lines indicate the paths that lead to successful system operation. Using the constructed model, analysts then use mathematical techniques to compute the necessary metrics.
In its simplest form, an RBD is a group of components connected in series, as shown below:

When blocks are drawn in series, it indicates that all components must be operational for the system to be functioning. If one component fails, the system will fail.
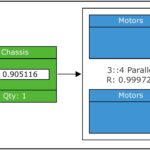
The value of RBD is in its applications for evaluating highly complex systems, such as those that incorporate redundancy. In the context of RBD analysis, redundancy means that when a component or path fails, a secondary component or path can take over to keep the system up and running. One example of redundancy is a system where a battery backup keeps the whole system operating when a power failure occurs. The graphical model below shows a system employing redundancy with four total motors while only three are required to keep the system operational.
RBDs can model various complexities and configurations, such as:
- Backup components that remain powered on all the time
- Backup components that power on only when needed
- Backup components that operate in a reduced, or quiescent, state until needed
- Switches that trigger transferring from a failed component to a backup
- Switch delays that may occur upon transfers to backup components
- Redundant components in k-of-n configurations (where there are (n) component groups in parallel, but only (k) are required for successful operation)
System Configurations Supported in RBD Analysis
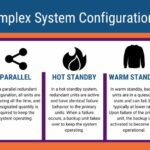
In RBD analysis, the terms Series, Parallel, and Standby are used to describe the various system configurations that can be modeled and analyzed. In Series configurations, all components are needed to keep the system functioning and there is no redundancy. In systems with Parallel and Standby components, multiple units are connected in a redundant configuration. In Parallel configurations, all components are operational; however, all may not necessarily be required to keep the system functioning. In Standby configurations, a backup is available to take over upon failure of the primary component. Standby configurations can be Hot, Warm, or Cold, indicating the state of the backup units. The types of RBD system configurations include:
- Series: All components are required for successful operation and no redundancy is present.
- Example: An assembly line operating with a number of robotic arm stations where the failure of a single robotic arm results in the stoppage of the assembly line.
- Parallel: Multiple units operate simultaneously.
- Example: Two operating power supplies for a database server where only one is needed to keep the server up and running.
- Hot Standby: The backup unit is active and always operating.
- Example: A mirrored server that is kept up to date with the primary server so that upon failure, the mirrored server can take over.
- Warm Standby: The backup remains in a quiescent state until primary unit failure.
- Example: A backup server that periodically syncs with the main server that must be brought online upon main server failure.
- Cold Standby: The backup is inactive until failure of the primary unit.
- Example: A generator that must be turned on upon power failure.
RBD analysis incorporates highly sophisticated mathematical algorithms to assess system metrics for these various complex real-world situations. In some cases, systems can be modeled using mathematical equations that can be solved analytically. For more complicated scenarios, simulation methodologies, such as Monte Carlo simulation, are required. For more details about RBD analytics, download our “Deep Dive into System Modeling Using RBD Analysis” white paper.
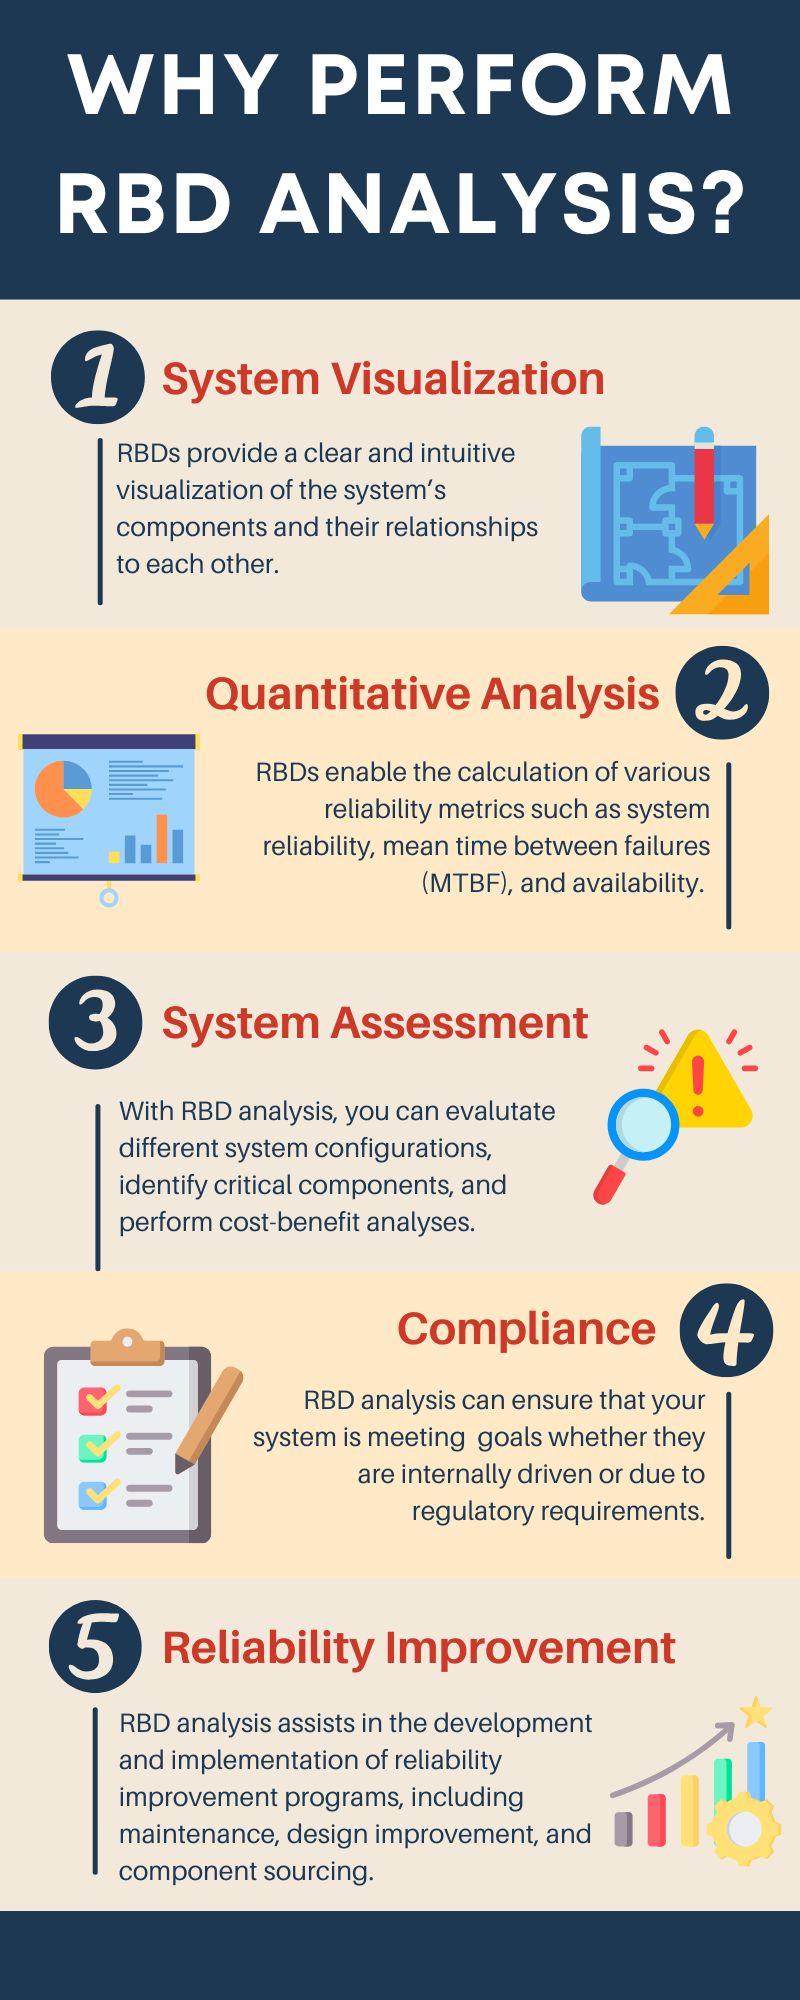
Why Perform RBD Analysis?
Availability is a vital performance metric in many industries. Availability is defined as the ability of a system to perform its intended function without interruption over a specified period. This metric is especially significant in those industries that utilize redundant design to maintain high uptime, such as aerospace, defense, telecommunications, networks, power, oil & gas, and medical systems. RBDs are used to aid availability assessment and quality improvement. RBD analysis is a valuable tool for meeting quality, reliability, and availability goals due to its many benefits, including:
System Visualization
Reliability Block Diagrams (RBDs) provide a clear visualization of a system’s components and their relationships with each other. Since RBD analysis begins by creating a system model in a front-end diagramming tool, it helps team members build a strong foundational understanding of the system’s configuration and complex interdependencies. This visual approach strengthens their ability to analyze system availability and other metrics.
RBDs also provide a common language for engineers, managers, and other stakeholders to discuss system performance metrics. As a result, this shared resource facilitates communication and enhances collaboration and understanding across different teams and disciplines.
Quantitative Analysis
RBDs enable the calculation of various time-based and steady-state metrics. RBD analysis can include time-based results to show performance over time, such as reliability, availability, failure rate, number of failures, and more. Additionally, steady-state metrics, such as MTBF and MTTR, can be calculated to examine system performance when it reaches a steady state. With several metrics available for calculation, RBD analysis ensures that you obtain the most complete and accurate assessment for your system. These metrics are essential for making informed decisions about system design and maintenance.
System Assessment
In addition to providing analysis of key performance metrics, RBD analysis also enables you to perform additional system assessments, such as:
- Evaluating Different Configurations: Because RBD offers the ability to analyze system design, you can model various configurations to assess the viability of different design options. For example, you can evaluate the effects of adding redundancy or adjusting the number of redundant components. If you have performance metrics with specific requirements, RBD analysis can help you effectively design your system to meet those objectives.
- Identifying Critical Components: RBDs can help to identify critical components whose failure significantly impacts system availability. Through visual analysis, component metric assessment, and path and cut set analysis, you can identify areas that need to be addressed to maintain high performance. Identifying potential problem areas can help you prioritize maintenance plans and determine appropriate actions for quality improvement.
- Performing Cost-Benefit Analysis: Because RBD analysis helps to quantify the impact of different system configurations, you can weigh cost versus improved system availability. This comparison provides the information necessary to perform cost-benefit analyses to determine the most effective ways to enhance system performance.
By evaluating different configurations, identifying critical components, and performing cost-benefit analysis, you can optimize system designs and improve system reliability using RBD analysis.
Compliance
RBD analysis helps to ensure your system is meeting both internally driven goals and external regulations and requirements. These standards can include specific performance metrics your system must attain to meet contractual specifications, compliance requirements, or internal goals.
For industries where regulatory compliance and safety are critical (such as aerospace, nuclear energy, medical devices, automotive, and defense), RBD analysis provides a metrics-based approach to demonstrate that all reliability and safety requirements are met.
Reliability Improvement
RBD analysis assists in developing and implementing reliability improvement programs, including maintenance, design improvement, and component sourcing.
- Predictive Maintenance Planning: RBDs help predict the reliability of a system over time, which can be used to proactively plan maintenance activities, reducing downtime and unexpected failures.
- Design Improvement: By pinpointing areas of design weakness, RBDs can help identify design changes that improve system reliability.
- Component Sourcing: RBD analysis can provide metrics for individual components, allowing you to determine which components affect overall system performance the most. This insight helps you determine how to best source your system components, balancing costs with failure profiles.
Whenever there is a need for system reliability and availability assessment, especially when redundancy is an integral part of the design, RBD analysis is the tool of choice, either on its own or as part of a larger reliability and quality program.
The RBD Process
Almost all RBD analyses are conducted using a specific software tool designed for the process. When considering different RBD tools, you should prioritize those that provide an easy-to-use diagram interface combined with a powerful computational engine. A web-based package will allow you to access your RBD analyses across remote teams or distributed locations.
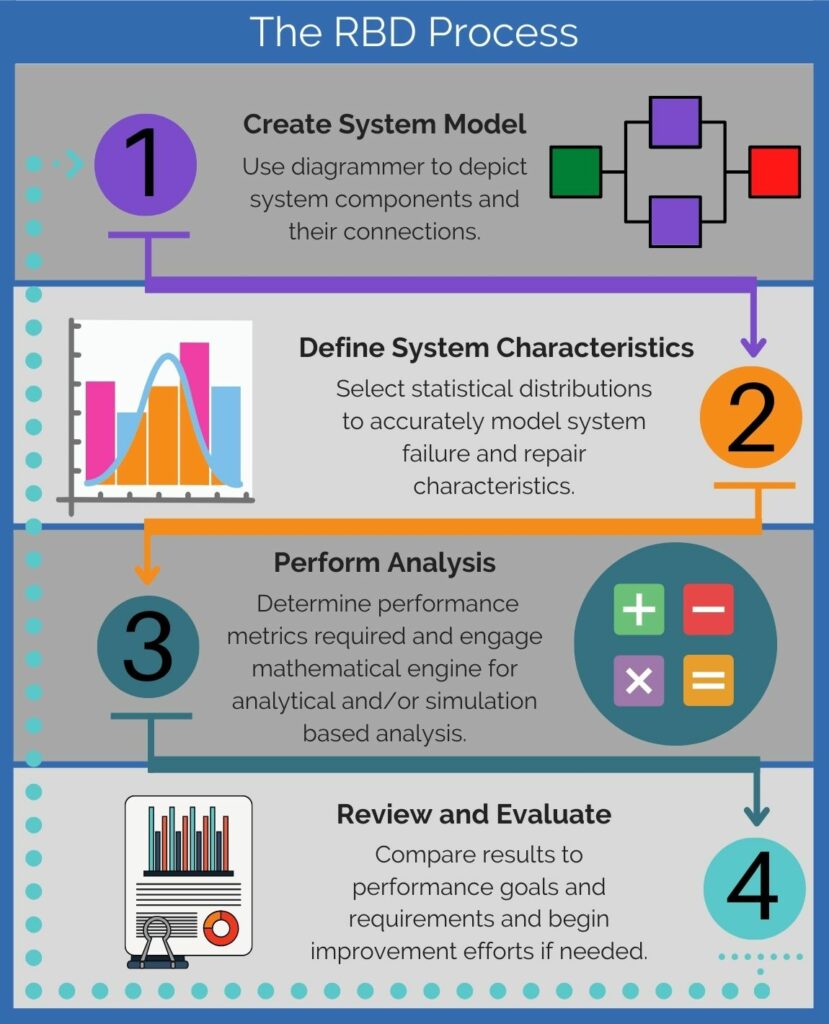
Efficient and effective RBD analysis begins by constructing a system model using a diagramming tool and defining the appropriate input parameters for the calculations. After the system setup, a calculation engine is engaged to compute the desired reliability and availability metrics. The calculated results are then evaluated to ensure that the system’s required performance goals are met or, if desired performance is not achieved, to identify areas to target for product improvement efforts.
The steps in the RBD process are broken down below:
Step #1: Create System Model
RBD analysis begins by visually laying out the components, or blocks, in the system using the graphical modeling feature of your chosen tool. The diagram depicts the required components and configurations for successful system operation. Connections between the blocks represent the relationships that exist between them.
Step #2: Define System Characteristics
Once the visual diagram is created and component relationships are specified, the next step is to define the appropriate failure and repair information for each block. RBD analysis utilizes statistical distributions to model component behavior, which can come from various sources, including prior component knowledge or other RAMS tools like Reliability Prediction, FRACAS, Maintainability Prediction, Weibull, and ALT.
Step #3: Perform Analysis
After the calculation inputs are defined, the next step is to compute the appropriate reliability and availability metrics. RBD analysis relies on a powerful calculation engine that considers the diagram’s configuration and all defined failure and repair inputs to compute metrics. Depending upon the complexity of the system model, RBDs may be analyzed using analytical or simulation techniques.
Step #4: Review and Evaluate
Once obtained, the calculated results are evaluated and compared to the required metrics. Depending on the outcome, system operation may meet goals or require product improvement efforts.
The evaluation step should be performed regularly, since outcomes may change as further data is gathered on the system’s components throughout their lifetime. Doing so helps ensure the system’s performance goals are continually being met.
Example RBD
We’ll consider a very simple example to demonstrate RBD analysis and the use of redundancy to improve system reliability.
RBD Example Initial Design
Assume we operate a small business and are implementing a new server for our sales team. Our simple system consists of a server and a power supply. After completing RBD Step #1, our initial system model looks like this:
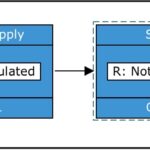
Next, to gather reliability information for our components and complete RBD Step #2, there are several methods we can utilize. In some cases, the manufacturer might provide information like MTBF. Alternatively, we may perform a Reliability Prediction analysis, which provides failure rate estimations. We also can look up failure rate metrics in commonly used databases such as NPRD or EPRD.
For this example, we will use the following for our components:
Failure Rate of Power Supply = 105 Failures per Million Hours (FPMH)
Failure Rate of Server = 20 FPMH
Using these values, we can move to RBD Step #3 and compute the reliability of our small system using our RBD software tool:
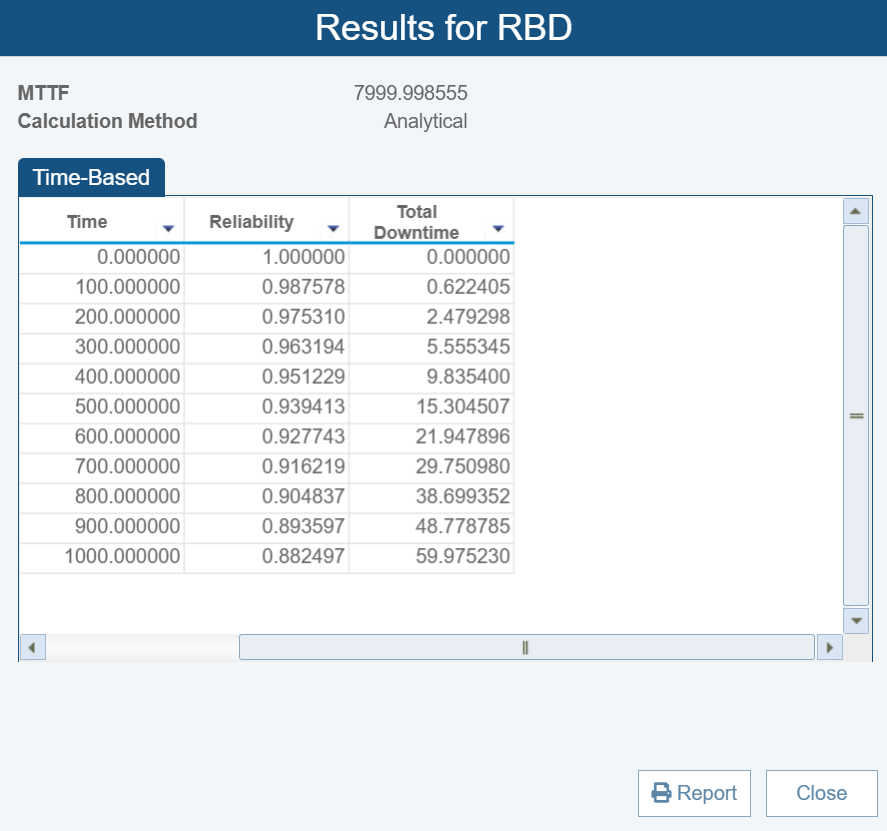
At 1000 hours, our reliability is 0.882.
We can move on to RBD Step #4 and compare our results to established goals and requirements. Suppose our goal is to ensure our server has a reliability greater than 0.9 at 1000 hours. In this case, we need to work to improve our system reliability.
RBD Example Revised Design for Improved Performance
We can analyze the effect that adding a redundant backup power supply would have on our system reliability. We will use a duplicate power supply in parallel to our existing one. After updating our system model, it now looks like this:
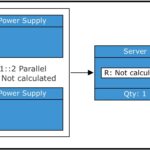
The resulting reliability shows we have achieved our performance objective:
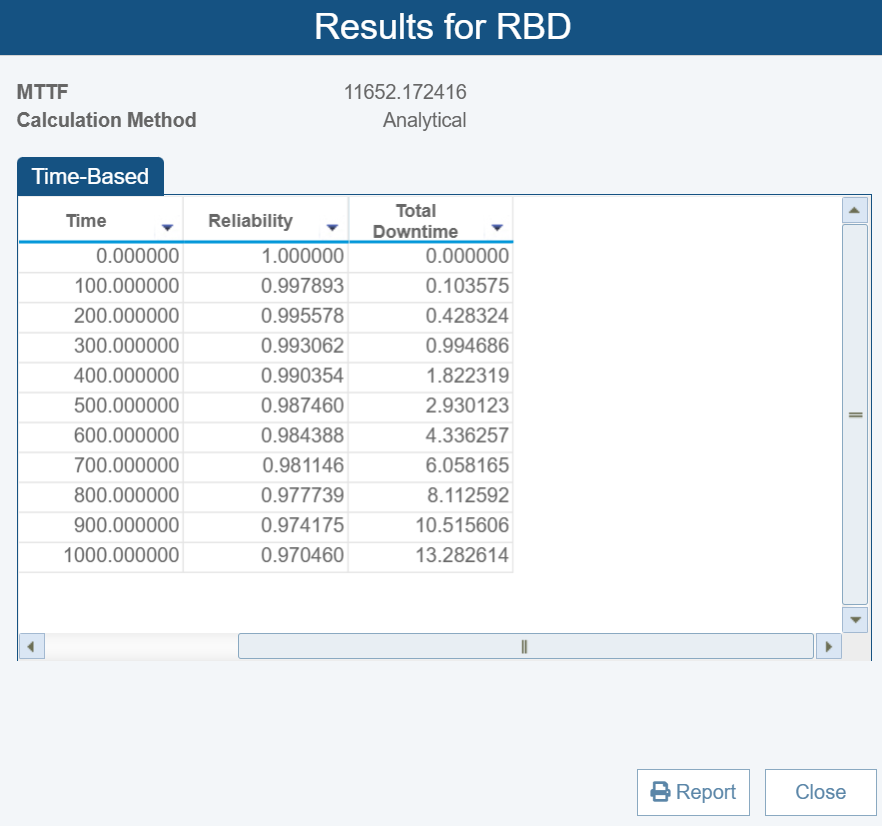
The overall reliability of the server system with redundant power supplies has improved to 0.97. Adding redundancy to the power supplies significantly increases the reliability of the server system, causing higher uptime and reduced risk of failure due to power supply issues. This example illustrates how redundancy can be a powerful method to enhance system reliability in critical applications.
Though simple, this example demonstrates how more complexities can easily be added for further detailed analysis. For example, perhaps we don’t want to keep both power supplies operational at all times. Instead, we can use a switch to activate the backup power supply only if the primary one fails (i.e., cold standby). We also may want to include the reliability of the switch itself in our RBD model.
The advantage of RBD analysis is that it can handle these increasingly detailed system models so that you can accurately assess your most complex system configurations.
For another RBD example using an RC helicopter, see our Guide to System Modeling Using RBD blog post.
What Should I Look for in an RBD Software Tool?
To perform RBD analysis, engineers typically rely on a software tool designed specifically for reliability block diagrams. There are several important elements to consider when selecting an RBD tool that will meet your needs. First, the core functionality for system evaluation is critical; the tool must combine an intuitive front-end for system modeling with a sophisticated, high-powered back end for performance assessment. In addition, a full set of advanced features offers benefits beyond the core capabilities outlined below and provides a best-in-class experience.
RBD Software Key Features
The core capabilities of an RBD software analysis tool include:
- Easy-to-use modeling tool. The front-end diagramming function should make the creation of your system models easy and efficient. The resulting diagrams should be well-organized and aesthetically pleasing. Having the ability to include images in your diagrams is also a bonus. Visually appealing, easily understood system diagrams are especially helpful when generating documentation for presentations and explanations to stakeholders. A well-constructed system model will enable you to effectively communicate system complexities to all concerned parties.
- Support for complex system modeling. RBD analysis is designed to analyze the performance of real-world systems. This means that a best-in-class tool should support creating complex system models, including those that incorporate redundancy. Redundancy modeling should support all redundant configurations, such as series, standby, and parallel, and their associated switch delays and switch probabilities. In addition, RBD components should incorporate a complete set of failure modeling characteristics to model real-world performance. These characteristics should include a comprehensive set of failure and repair distributions to model component behavior accurately.
- Advanced calculation engine. A fast, accurate, and powerful calculation engine is key for an RBD software tool. The mathematical engine should support analytical calculations that rely on equations to provide exact results. Additionally, the engine must be capable of employing simulation techniques, such as Monte Carlo simulation, to effectively analyze complex systems that cannot be solved analytically. Results should be comprehensive and include an array of performance metrics such as Reliability, Availability, Failure Rate, Downtime, Failure Frequency, Hazard Rate, MTTF, MTBF, Cut Sets, and Path Sets.
- Integration with other reliability tools. RBD Analysis is just one component of a complete reliability management platform. It is helpful if your RBD software integrates with other reliability and quality tools, such as Reliability Prediction and Weibull Analysis.
- Beyond-the-basics features. In addition to performing the core aspects of reliability assessment, an RBD software tool should include features to streamline your tasks and build more thorough analyses.

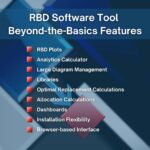
RBD Software Tool Beyond-the-Basics Features
Some of the beyond-the-basics features you should look for in an RBD software tool include:
- RBD Plots. RBD plots allow you to map and analyze system lifetime performance. An array of different plot types, such as Availability over Time, Failure Rate over Time, and PDF (Probability Density Function) plots are helpful.
- Analytics calculator. An Analytics Calculator enables computations of point-based RBD metrics, such as Availability, Bearing Life, Mean Life, and Warranty Time.
- Large diagram management. System models can become large and overwhelming when modeling detailed high-end systems. Your RBD tool should offer organization and management features to efficiently handle these cases. Features such as sub-diagrams and linkages for easy navigation are useful for managing large-scale models.
- Libraries. For efficiency and consistency, your RBD tool should support databanks to encapsulate subsets of your RBD data. RBD Libraries allow you to store and retrieve components and full system diagrams for reusability and improved diagram management.
- Optimal Replacement calculations. An Optimal Replacement function is available to help determine the best time for planned component replacement.
- Allocation calculations. Allocations allow you to determine how to achieve your overall system reliability goal by selecting from a variety of allocation methods and distributing that goal across the system’s components.
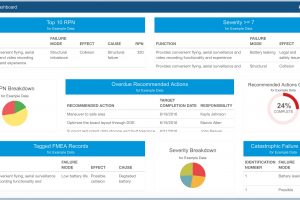
- Dashboards. Customizable Dashboards are helpful for aggregating information into a high-level overview for quick assessment.
- Installation flexibility. Multiple installation options allow you to choose between an online, personal cloud, or on-premise installation based on your requirements and organization needs.
- Browser-based interface. Browser-based interfaces offer ultimate flexibility and provide easy access for all team members.
Relyence RBD
Relyence RBD is a powerful tool for performing comprehensive RBD analyses. It simplifies and streamlines diagram creation and offers an impressive calculation engine that supports a variety of reliability and availability metrics. Built with today’s emerging technologies in mind, Relyence RBD offers a wealth of features that secure it as a best-in-class solution. Some notable Relyence RBD features include:
- Simple front-end diagramming tool with an intuitive layout to expertly manage diagrams
- Support for complex system configurations including parallel and hot, warm, and cold standby redundancy
- Fast and accurate calculation engine with Monte Carlo simulation capabilities
- A wide array of built-in performance metrics
- Cut sets and path sets, including the ability to highlight and traverse through RBD diagrams
- RBD Plots
- Analytics, Optimal Replacement, and Allocation calculations
- Customizable Dashboards for high-level graphical overviews
- Integration with other Relyence reliability and quality tools
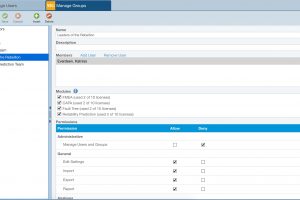
- Role-based user permissions and advanced access control capabilities
To learn more about the advantages of Relyence RBD or to see it in action, sign up today for a no-hassle free trial. Or feel free to contact us to discuss your needs or schedule a demo.


